Here’s a fun story!
I purchased a vintage hockey card last month and I think it was a win.
It’s really tough to tell in this asset class since the “value” is hard to define.
But just to throw some example numbers out there, let me explain…
Let’s say that I was offered this card for $10 by a dealer that I know and trust. Despite being attracted to the investment and the offering price, I wanted to look into potential “value” a little bit further.
I emailed another vintage dealer who I know, based in Vancouver, and I sent him a photo of the card.
He said, “Wow, incredible.”
I asked him for his professional opinion on the value of the card, while not telling him the price at which the card was offered to me.
He said, “I would ask $18 for this card. And I would probably take anything $15 or more.”
Awesome!
I bought the card for $10.
But let me ask you this:
What is the card worth?
Even if my Vancouver contact told me that he felt the card was worth $10, I still would have happily purchased it. This is a great long-term investment and I probably would have paid more for it, if I were asked. But there’s something to be said about knowing that there’s potential additional value that helps make you feel good about an investment.
None of that answers our question, however. What is this card worth?
Establishing value in any market can be difficult.
The irony of something like the stock market is that establishing value is exceptionally easy – just log on to Bloomberg or Yahoo Finance and you can see exactly what a stock is trading for, to the penny, to the second.
But the irony lies in the fact that these “values” can change every second and the entire purpose of the stock market (unless you believe in “owning pieces of companies”…) is for people to make wagers on values going up or going down, and thus it seems to follow that these market participants believe in stocks being “overvalued” or “undervalued” at any point in time.
So what does that say about the definition of “value?”
Tesla was “worth” $250 per share in November. But then it was “worth” as much as $488 per share in December, and now it’s “worth” only $225.
Does that make sense?
Is that representative of “value” or is this something altogether different?
Financial analysts will talk about the “intrinsic value” of a stock, which could be perceived as an insider’s view based on a complex mathematical analysis, or it could be viewed as a person’s hope of where that stock could end up trading in the near future.
In speaking with industry colleagues over the past couple of weeks, many of us have concluded that 2025 will be “the year of seller expectations.”
As we had discussed consistently throughout 2024, the number of sales in the GTA was substantially impacted by the buyer’s willingness to buy and the seller’s willingness to sell. More specifically, the “overlap,” so to speak, in the price expectation of the seller and the price expectation of the buyer in a market that had come off a massive peak in 2022, had seen interest rates skyrocket and then fall.
I’m of the opinion that 2025 is going to take things to an entirely new level, and through the first two months of the year, I have ample evidence to back this up.
A friend of mine from another brokerage told me a story last week about clients of hers who were eyeing a west-end home, listed for sale for $1,499,000. She said that the house checked every box possible for her buyers and that it was in impeccable shape, but there was one major problem: the price.
This house was purchased in January of 2022 for $1,450,000 and my friend opined, “There’s absolutely no way that this house is worth more today than it was in January of 2022.”
So I asked her what I’ve asked to nobody in particular in the preceding – to define value.
“This house is worth what somebody is willing to pay for it,” my friend told me. “And I guarantee you nobody is going to buy this house for what the sellers want.”
What the sellers want. Ah, right! There was more to the story.
Because this house wasn’t just listed for $1,499,000, but rather there was also an “offer date” set, presumably because the seller wanted more than the list price.
Offer day came and went without success. There were no bids on the house.
But then the price was raised to $1,579,900.
My friend said, “This is the literal definition of insanity. Just doing the same thing over and over and expecting a different result. This house isn’t going to sell at that price. It didn’t sell at their so-called ‘under-listed’ price either!”
She chatted with the agent over the next few days as he tried to do his job and she tried to do hers. But every time she tried to make an argument about value, the listing agent simply said, “None of this matters. They’re just not going to sell.”
This went on for a while until finally he blurted out, “Look, they’re just not going to lose money, okay?”
And thus we arrive at their definition of “value.”
To these sellers, the house will only sell for a price that makes them whole.
But is that how our market works?
Does the real estate market have a built-in protection for people who refuse to accept the ups-and-downs of an active, dynamic, free market?
If you believe that “A property is worth what somebody is willing to pay,” then you and I are aligned in that view. I firmly believe this is the only way to establish “value” in the real estate market, but how you get to those numbers is a whole other story.
I recently had an experience with a west-end property that was listed for sale for $1,999,900, with an offer date.
When I first saw the property on MLS I thought, “This house is incredible. Geez, this thing is going to get a big number!” But when I looked at the listing history, I started to wonder…
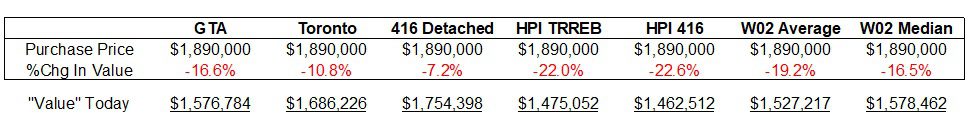
This property had sold in March of 2022 for $1,890,000.
The first thing that popped into my head was, “March of 2022 was basically ‘market peak.’ This can’t be worth more than that!”
I called the agent to feel her out and I asked her about expectations.
She was very forthcoming. Perhaps more than she should have been, and told me, “The seller would love to see like $2.2 or $2.3 million. I think, like, $2.25 million would be good, but we’ll see.”
I went and saw the house and my gut told me that this was “worth” what they were asking, but that’s a subjective view.
I wanted more objectivity so I decided to run an experiment.
In March of 2022, the average GTA home price was $1,299,984. This was already off the peak of $1,334,554 recorded in February, but still well ahead of the market today, at least statistically-speaking.
Our most recent data point, from February of 2025, tells us that the average GTA home price is now $1,084,547, so the change in market value is easy to calculate:
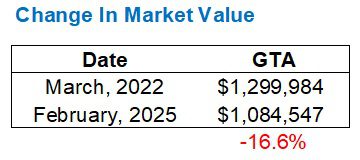
Again, this is “on paper” and not every house or condo in the GTA is automatically worth 16.6% less today than it was in March of 2022, but at the very least, this gives us a starting point, right?
As we all know, there are many measures of our market. In fact, the “GTA average home price” is merely one of several that I would just even as a starting point if I wanted to ascertain an estimate of current market value.
For example, what if we wanted to look closer than simply “GTA”? How about we run the same numbers for the City of Toronto?
Here’s what that looks like:
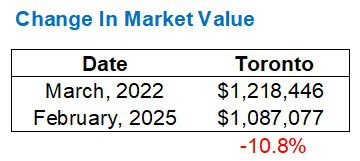
Alright, so while the 416-Toronto number is 5.8% “better” than the GTA, the data still shows that a house purchased in March of 2022 is worth less today, right?
So what is the seller of this home thinking?
Does he or she know something we don’t?
Let’s run the data for 416-detached:
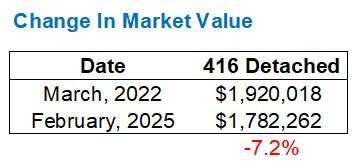
Alright, so still down 7.2%.
Still no reason for the seller to want, need, expect, covet, or demand a substantial premium over what he or she spent to purchase the home in March of 2022.
But maybe the 416-detached sample size is too small.
And maybe the overall “averages” are way too volatile.
Maybe we should look at the smoother, more reliable Home Price Index (HPI) instead and see what it shows?
Alright, that’s probably not a number that the seller would want to use in his or her calculation of “current market value.”
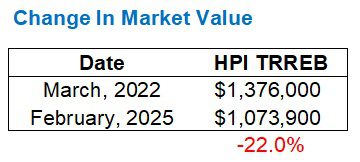
But that’s the Home Price Index for all TRREB areas. What if we looked specifically at the 416?
How would that look?
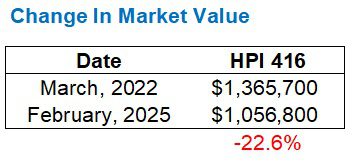
Eek! That’s slightly worse.
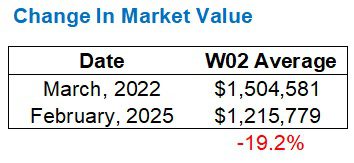
So what if we looked only at sales in W02 where this property is listed?
You know I don’t like small sample sizes for volatility reasons, but maybe this will show the market value in a different light?
Here’s the change in market value using the average W02 sale price:
And here’s the change in market value using the median sale price:
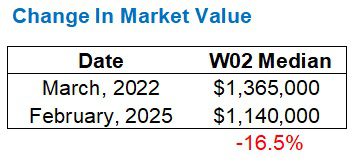
Phew!
That’s a lot to take in.
But the bottom line is: by looking at seven different market metrics, we could theoretically argue that this property is “worth” only 7.2% less than when it was purchased but we could also argue that it’s “worth” 22.6% less as well.
I’ve always loved the saying, “You can make numbers say anything you want.”
Now, some of you might want to ask, “David, why are you using the change in market value, based on market metrics from when this house was purchased, to find current market value? Why aren’t you looking at comparable sales?”
That would be a very fair question considering that we typically do look at neighbourhood sales as a method of measuring current market value.
But I would offer the following:
Do we need to bother asking the question of whether or not Jimmy can successfully fly across the lake if Jimmy has no wings to begin with?
Seriously, just use this as a starting point:
I don’t think it’s lazy or irresponsible to suggest that looking at comparable sales is a fruitless task when we’re armed with so much data to suggest this property is worth less today than when it was purchased, and yet the owners are expecting hundreds of thousands of dollars more.
But again, their “expectations” don’t have any effect on market value.
Talk to the agent in a situation like this, and what can they say back?
“This is a really great house.”
“It’s tough to find a house that checks as many boxes as this one does.”
“Nothing in the area compares to this.”
Those all may very well be accurate and truthful points but they don’t have the effect on value that the seller and the listing agent would like.
The last chart above clearly demonstrates the volatility in market metrics, as this exercise provides a low value of the home of $1,462,512 and a high value of $1,754,398
But none of those numbers are close to the $1,890,000 that the owners paid, let alone the $1,999,900 at which they’re listed, nor the $2.2 – $2.3 Million that the seller “wants.”
So let me ask the obvious question:
Does the seller know this?
In today’s market, it’s an even split between sellers who know but don’t care, and sellers who are absolutely clueless.
Within that cluelessness comes a further breakdown between those sellers who haven’t been told by their agent and those who are simply ignorant of what’s going on around them.
Markets go up.
Markets go down.
Ours went up for a long, long time, and then came down.
It will go up again.
But right now, sellers can’t expect to recapture the absolute peak market price from the spring of 2022, and yet so many out there hold exactly that expectation!
At the end of the day, the numbers used above represent an absolute starting point for a seller looking to pinpoint current market value.
However, the definition of “market value” in today’s real estate climate isn’t all that subjective. It is, always has been, and will always remain: what a buyer is willing to pay…


Ace Goodheart
at 8:07 am
With house prices, the value doesn’t seem to be “what someone is willing to pay” but rather “what buyers believe another buyer is willing to pay”
That seems to be why offer nights work so well in overheated markets.
Stocks are different. Other than Tesla (which is vastly over valued and has been so for years) it’s very easy to determine a stocks value. You just run the metrics.
Based on the math, you purchase or you don’t.
Tesla is an outlier (similar to stocks like Uber and Groupon, whose metrics never made sense). Most stocks you can easily come up with a set value and then make a purchasing decision.
With real estate, there are no metrics per say. There is just the fear of your chosen house being sold to someone else.
Derek
at 8:49 am
Fake news! While the average price of all houses sold may decline, the value of your own specific home never drops.
Serge
at 9:03 am
So the good metaphor for RE markets is the used hockey card market, not the used car market.
Mike
at 10:04 am
Oh come on David, share the hockey card with us! Inquiring minds want to know.
Anwar
at 11:23 am
LOL I thought the same thing. We’ll settle for a pic. You don’t have to share any other details!
Serge
at 3:15 pm
In our times, hockey players could be a sensitive political subject…
David Fleming
at 7:12 pm
@ Serge
I assume you’re referring to Wayne Gretzky.
It’s amazing how we politicize everything.
I don’t invest in any Wayne Gretzky hockey cards. In fact, the single most boring hockey card in existence, in my opinion, is the 1979-80 O-Pee-Chee Wayne Gretzky card. There are currently 13,780 graded by PSA. Doesn’t exactly scream “scarcity” to me, but I’ve been to shows where one dealer has a showcase with 800 Gretzky rookie cards, graded from 1 through 9. That’s such a turn-off.
The player in question for the purpose of today’s blog post is Frank “King” Clancy.
Serge
at 8:28 pm
Thanks, David! Pls do not take it seriously. It was just such an uncanny subject. Looks like those cards are the “condo zone” of this market. Mass-production. Now it could be in crisis, too.
David Fleming
at 3:41 pm
@ Serge
Oh I know it’s not serious, but it’s hot-button for sure. I wanted to say “Poor Wayne,” but how many people would attack me for that?
Many Canadians think that anything short of Wayne taking a slapshot to Donald Trump’s face is unnacceptable.
Everything is political these days, and I don’t think any two people can agree on anything.
Vancouver Keith
at 10:50 pm
The “intrinsic” value of any publicly traded company, is the net present value of future earnings discounted at the current 10 year bond yield. Mr. Market, the market price of a stock is manic depressive – usually on the manic side. Every day he pitches you the company at a different price. The stock market is not efficient in the short term and traders exaggerate short term price movement.
Tesla has been at wildly different prices. Market “value” can only be proven when the earning come in. Obviously Tesla sales are about to take a real and unpredictable hit, so the price is falling. Real value is in the earnings power of any company. Watch any company fall short of expected revenue or earnings, and the price gets hammered.
Real estate is a different market entirely. You don’t buy a house in most parts of Canada based on the expected earning capability of the asset. Real estate in Vancouver is priced on demand, which has zero connection to the actual population of the city, local incomes or the GDP of the local economy – not a major financial or political center. More expensive than Toronto for much of my lifetime – go figure.
Libertarian
at 12:26 pm
David, I know you have referred to MaxSold in one of your previous posts. Have you ever used it to buy an old hockey card? There seems to be lots of them on there. Some of them even graded. Problem is they are an hour’s drive away.
I bought some old cards (not hockey) on there. Not much money. Pick them up soon. Will be interesting to see what shape they are really in.
David Fleming
at 3:39 pm
@ Libertarian
A lot of people have told me to look on MaxSold for hockey cards. I’ve tried, but it’s usually junk.
The problem with the sports card market (or the benefit…) is that it’s now highly commoditized. In 1988, I would go to a show, ask to see a 1983-84 Steve Yzerman rookie card from behind the showcase, then tell the dealer, “This looks near-mint, not mint, so I’ll give you $40 instead of $50.” It was just how it looked to the naked eye. In 2025, every card has to be professionally graded by PSA and “slabbed” in plastic, with a serial number, and grade. Then you can look up the card and see: 1) Population, 2) Trending sales history.
Let’s look at a MaxSold listing:
https://maxsold.com/auction/97400/bidgallery/item/6828280
That’s a Ray Bourque rookie card, but it’s “raw,” meaning not graded.
From the looks of the card, I think that would grade a PSA-2.
There are over 3,000 Ray Bourque rookie cards graded according to the population report available on the PSA website:
https://www.psacard.com/auctionprices/hockey-cards/1980-o-pee-chee/ray-bourque/322215
A Gem-Mint PSA-10 sells for $8,000+.
But a PSA-2 sells for $25.
It costs $20 minimum to send a card for grading, hence why so many “raw” cards aren’t worth anything.
But if you ever see any hockey cards on MaxSold from before World War II, let me know!
Plots
at 6:06 am
This post is very helpful and thank you very much for giving us such good information, but we also want to give you some information about property investment. If you want to buy Best Plots in Noida at affordable rates, then you can visit plotsinnoida.com and call the given number-7289000808.