I have a condo currently listed for sale for $399,900.
There is an offer date.
I have received many calls on the property, but this weekend, in the space of about ten minutes, I received two phone calls that demonstrate the current state of the condo market.
The first agent said,
“I see that the high-water mark for this unit is $522,000, but that sold last year in a better market. I know one recently sold for just under $500,000. Is that sort of where your client is expecting this to land?”
The second agent said,
“Is your client flexible at all on the price?”
Seriously.
The first agent did her homework. She looked at the comparable sales for the unit (remember when this was automatic and we didn’t applaud people for this?) but more importantly, she understood the idea of an “expectation” and that the $399,900 list price was a starting place and that we had hoped to “land” at a price near the previous sales.
The second agent was obviously a complete and utter moron who saw a listing for $399,900, with an offer date, and comparable sales from $465,000 to $522,000, and asked if the $399,900 price was “flexible.”
It’s been a very interesting year in the condo market thus far, and while I’m tempted to say that it’s been a seller’s market all along, there have been a few “close calls.”
Imagine you have a condo listed for $599,900 for which you hope to get $750,000. The market is hot and your last few listings have been gangbusters, not only that, you’ve had over 50 showings on this listing.
You’re hoping to see eight or ten offers, again, like your last few listings, and then offer night comes along…
….and you only get three offers.
You get an offer of $599,900 from a dummy who says “I’m only making this offer to show my client that it’s a waste of time,” then you get an offer for $650,000, and an offer for $660,000.
You’re screwed right?
You’re going to have to terminate this listing, re-list tomorrow at $749,900, and go to the dreaded “Plan B?”
But at 7:15pm, after you’ve already reviewed the three offers in hand, somebody emails you an offer….
….for $775,000.
That’s a story that every condo agent can tell at least once so far this year.
There have been “automatic” listings where you get eight, ten, or twelve offers and you know you’re going to get your price, but there have been some tougher listings where it looked like you weren’t going to sell.
And I’m speaking for me and my team.
Out there – in the wild, I’ve seen all kinds of listings that didn’t sell, had to re-list, or messed up their offer nights.
But I’m talking from experience here, and, sorry to sound verbose, but we do things properly and at the highest level. So when I say that we’ve had listings that “almost didn’t sell,” it’s different. It means that the market hasn’t responded in the way that we would expect of a “red-hot, seller’s market.”
There have been moments of “red hot” this year but not consistently like we’ve seen in years before.
So let’s look at the statistics through the first half of 2023 and get a sense of how the data tells the story.
First, lets look at the 416 and the number of units sold:

Look at January. Wow.
From 1,703 units in 2021 to 1,409 units in 2022 down to a paltry 604 units in 2023.
That is a story!
Again, we’re at the mercy of listings when it comes to sales, but you can’t deny that hte market started slowly in 2023.
Then, the market picked up. Not right away, as February was quite similar to January, but April was almost on par with 2022, and May and June both beat out 2022. Consider that the market slowed in 2022 around this time as interest rates began to rise, but the June data is on par with 2018 and 2019 as well.
Let’s look at the chart:

Seeing January start out the way it did is even more shocking on a chart.
But then when you look at where we were in April, May, and June, the market seems to have completely normalized.
Perhaps we’ll see this year finish more like 2018 and 2019 than 2021?
As for the 905, it started out the same as the 416, declining from 2022, but not quite to the same extent:

But the 905 got hotter faster.
By April, we had seen the 905 surpass 2021.
And by June, we had seen the 905 surpass all of 2018, 2019, 2020, and 2022.
When you look at the figures on a chart, one data point jumps out. At least, it did for me:

Look at May sales.
That green point that hovers above the rest, including the yellow from 2021 which was an all-time high for the condo market.
That’s astounding, is it not?
And while sales dipped well below the 2021 high for the month of June, we still have six months left in 2023. Is it possible that the 905 condo market will remain stronger than the 416 condo market? And could it have a significant enough impact that it carries the GTA average?
Now, the regular readers know that I love looking at the Sales To New Listings Ratio (SNLR) or the “absorption rate.”
This is the number of sales as a percentage of the number of new listings and it shows the relationship between supply and demand, perhaps better than anything.
So let’s look at the same period as above:

Look at January!
33.1%, wow. How did I not come across this sooner?
This underscores the weakness in the 416 condo market better than anything above. And more to the point, look at February as well. At 49.8%, this pales in comparison to the previous five years; even 2018 and 2019, at 67.7% and 62.9% respectively, which weren’t really special years.
Now again, look at how this changes in Q2.
In April, we see an absorption rate of 61.0% which is on par with 2018 and 2019 (we can’t really use 2020 because of the pandemic), as well as 2021, and it blows 2022 out of the water.
The story is the same for May.
By June, the market seems to slow. The absorption rate of 45.1% is significantly lower than 2018, 2019, and 2021, albeit well higher than 2022 as the market had fallen off by then.
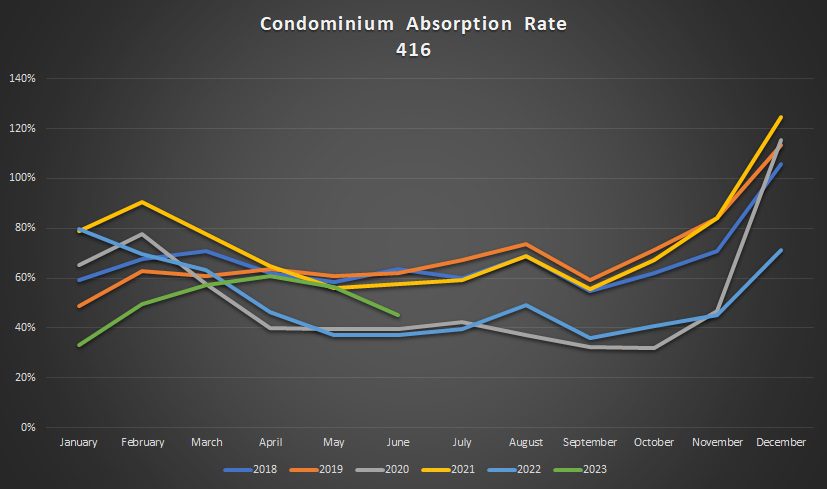
Here’s how the chart looks:

While some of you might have your eye drawn to December when the absorption rate shoots up like a rocket every year, I’m looking at that green line once again.
Look at April and May.
The 416 condo market is essentially as tight as it’s been in the past five years, and that speaks to a true “red-hot seller’s market.”
By June, we see the relationship between supply and demand change in a way that takes us from “seller’s market” to “balanced market.”
Could we see a buyer’s market in July and August?
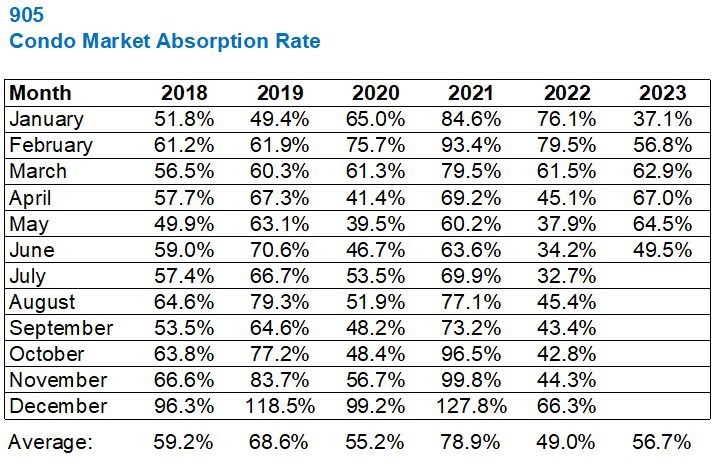
In the 905, we see a similar trend overall but the market is tighter:

The absorption rate has been higher in the 905 every month so far this year.
In the peak months of April and May, the 416 saw 61.0% and 56.4% absorption rates, but the 905 was 67.0% and 64.5% respectively.
When the market cooled in June, the absorption rate in the 416 was 45.1% but it remained higher at 49.5% in the 905.
The chart shows us that the absorption rate in May and June was essentially in line with the 5-year high:

That’s a very sharp decline in absorption rate, relatively speaking.
If that trend continued, as I surmised with the 416 above, we could see a buyer’s market by August.
For the record, the average condo price in the 416 in January was $711,171 and it peaked at $784,914 in May, before declining slightly to $770,423 in June.
That’s an increase of 8.3% from January to June.
In the 905, the average condo price in January was $646,714, it also peaked in May – at $677,874, and also declined slightly in June, moving to $674,305.
That’s an increase of 4.3% from January to June.
How interesting that, while the market is tighter in the 905, prices haven’t increased at the same pace.
Does that blow any theory about supply-and-demand out the window? Or is the 416 just far more volatile because of prices, activity, and buyer emotions in the downtown core?
On Wednesday and Friday, we’ll be doing a Q&A with economist, Ben Rabidoux, and I’m sure we’ll touch on the condo market at least a few times!


Ace Goodheart
at 2:08 pm
House market appears to be in a downward spiral.
These are the first ten listings that come up in my area (Bloor west – Junction) on zoocasa:
1. $1,199,000 – fresh listing, no sales history
2. $1,379,000 – listed twice, now at $1,279,000.00. Sold in 2020 for $1,247,000. Seller will take a major hit at $1,279,000 as that doesn’t even cover land transfer tax.
3. $1,288,000 – previous sale price $569,000 in 2011.
4. $1,475,000 – previous lists at $1,499,900, $1,599,900, and two at $1,699,900 going back to summer of 2022. Price cut, no sale yet.
5. $1,999,999.00 – previous lists at $2,499,900, and two at $2,599,900. Purchased for $1,650,000 and extensively renovated. No way they are making a profit on this if it goes for $1,999,999.00
6. $1,699,900 – previously listed at $2,195,900. Sold in early 2023 for $2,150,000.00 – this one is interesting. It would appear that either the seller purchased the home in early 2023 for $2,150,000 and is now trying to get rid of it, or the deal fell through. Previously listed in 2022 for $2,098,000 and $2,439,000 and not sold
Those are the top six. Of them, I can see that four of them have sellers who are losing money. Two appear to be new to the market, not sold for a while.
There is a ton more to go through, but it would appear that there is vulture meat now out there for anyone with cash who wants to go looking for it. The real estate bull market appears to be over, at least for the time being
Nobody
at 12:39 pm
Just checking if the comment system is broken.