
Are you familiar with the stories that begin with, “This guy that I know….”?
Depending on the tone, and of course, whether the storyteller pauses and clears his throat before checking himself and offering, “…this guy I know…,” this story could be about the storyteller him or herself.
But sometimes, it’s just easier to say, “Mom, Dad, I swear, I’m holding those drugs for a friend…”
Anyways, this guy I know purchased a rental property in the summer and put the property up for lease last month.
The lease price was $2,300 per month and he had immediate interest.
But there’s a difference between “quality” and “quantity” in many areas of life, and while you might not care who buys your home, you most certainly care who leases it.
As a sidebar, most property sellers in other countries do care who buyers their home. We live in one of the few countries where when somebody submits an offer to purchase, there’s absolutely zero information provided about the buyer, nor is it ever asked for.
My American clients always ask me, “How many years of tax returns and financial statements should I provide with my offer?”
They’re amazed when I say, “We don’t do that here.”
The follow-up question is usually some form of, “What? How does the seller know that I can actually afford to buy his house?”
I wish I had an answer.
It’s just one of those cases of, “This is how we’ve always done it…”
Anyways, when it comes to the lease market, you do care who rents your home.
Not only do you want that person to be able to afford the lease payments, but you would also hope that he or she isn’t going to move in, stop payment on the post-dated cheques tomorrow, and abuse the system that’s so ripe for abuse in Ontario.
This guy I know received an offer to lease his condo from an individual who has a salary of $42,000 per year.
I’m sure the prospective tenant is a super-nice dude, but at $2,300 per month in rent, this person’s GDS ratio (which is not to be used when evaluating the worthiness of a potential tenant, per the Ontario Human Rights Commission) is a whopping 65.7%.
What is “acceptable” by historical standards?
32% – 36%.
I mean, if that metric didn’t discriminate, according to the Ontario Human Rights Commission.
Toronto is a tough place to afford, no doubt.
However, does an early-20’s individual in his or her first job out of university, making $42,000 per year, need to live alone in a 600 square foot condo downtown?
Does this person deserve to do so?
Is the rental market “difficult” or “unfair” because of prices or because of expectations?
This guy I know also received an offer to lease from an individual who was financially unqualified but who obtained a guarantor…..who was also financially unqualified…….and living in Florida.
This guy I know said his agent also received about thirty emails from leasing agents who had never shown the condo but who emailed with a “tenant profile” and asked for the tenant to be pre-approved.
Eventually, this guy I know found a suitable tenant and turned down higher offers and faster possession dates in order to get the “right” tenant.
I’m not sure if anybody out there is watching or listening to The Last Honest Realtor podcast, but I have several dedicated episodes on the rental market.
Here’s one, although we covered this in a previous blog post here in Toronto Realty Blog:
Here’s another, and this one solicited a lot of comments from landlords who shared their horror stories:
By the way, I don’t really look like that. I have no idea who that dude is, but I digress…
The last time we met in this space, it was early-July and we had the whole summer ahead of us! My, my, how time flies.
We had also witnessed a Q2 rental market that was lukewarm.
Not only that, inventory in the downtown condominium rental market was hitting new highs.
Let’s refresh the New Lease Listings chart and see how the data looked in Q3:
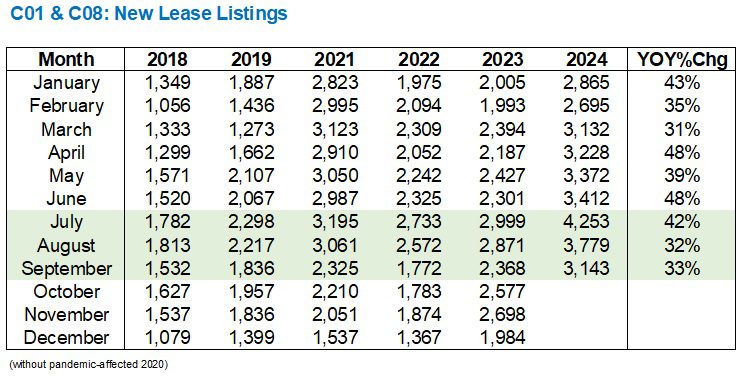
Inventory is increasing, however, it’s increasing at a decreasing rate.
The year-over-year increase went from 48% to end Q2, down to 42% in July, then 32% and 33% in August and September.
Inventory is still up.
It’s just not keeping pace with Q1 and Q2.
Nevertheless, take any one month in Q3 and you’ll see that we’re at all-time high inventory levels, save for perhaps the pandemic, but we’ve removed that from the charts.
Come to think of it, the data is getting a bit long in the tooth. Maybe we’re due to shrink this down to four years?
That’s even more apparent when we look at the graph:
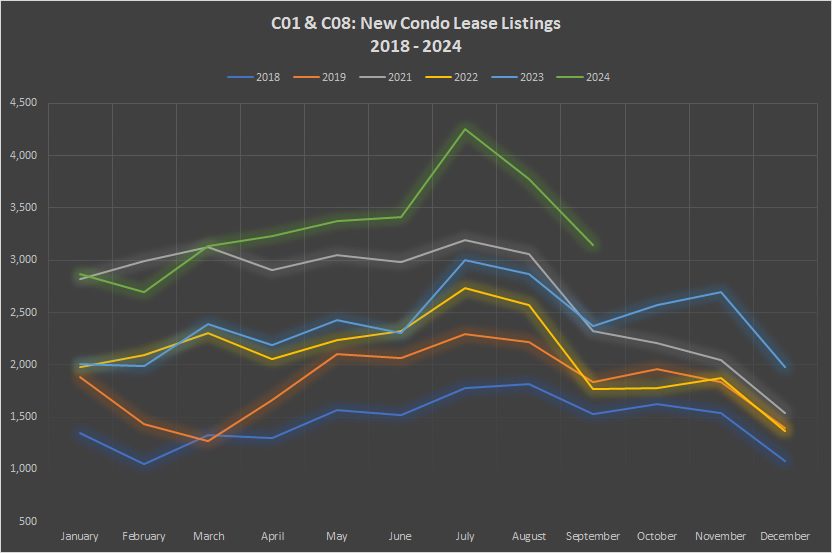
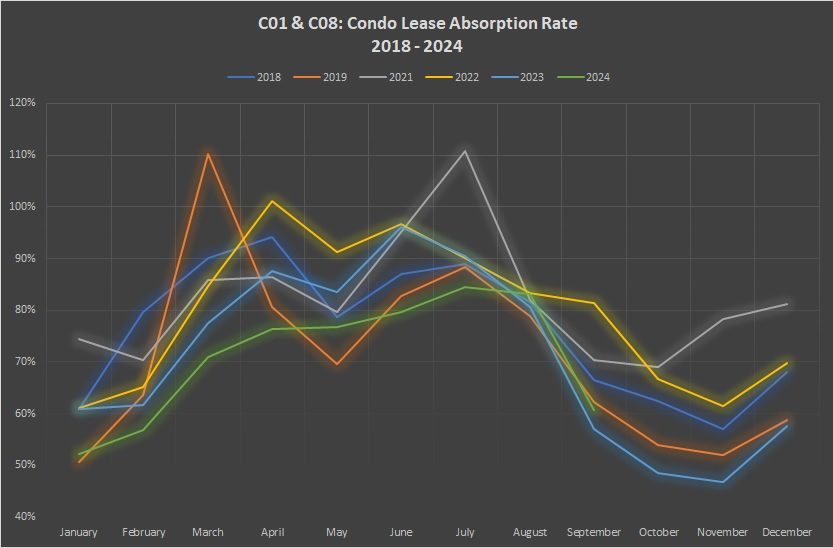
Alright, starting next year, it’s a five-year chart only. That will tidy things up as we move to the last chart today – absorption rate, which is a bit harder to read.
But as you can see from the above graph, inventory levels in 2024 have been well ahead of the 3-year or 5-year trend.
Save for January, every month so far this year has set a record.
Now, if we did not see a corresponding increase in the level of units leased, then there would be cause for concern.
However, the following chart shows that leasing activity in Q3 skyrocketed, just as lease listings did:
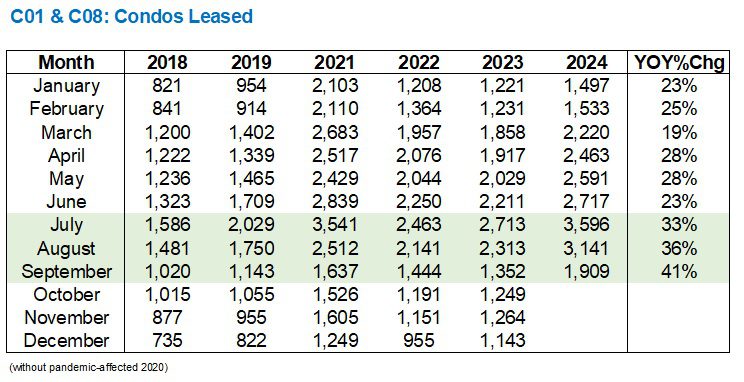
The respective year-over-year increases didn’t exactly line up month-over-month, ie. July for July, etc., but overall in Q3, lease listings and leased units essentially moved in tandem.
We’ll come back to that last.
But here’s the graph of units leased, looking a little bit like the graph for lease listings:
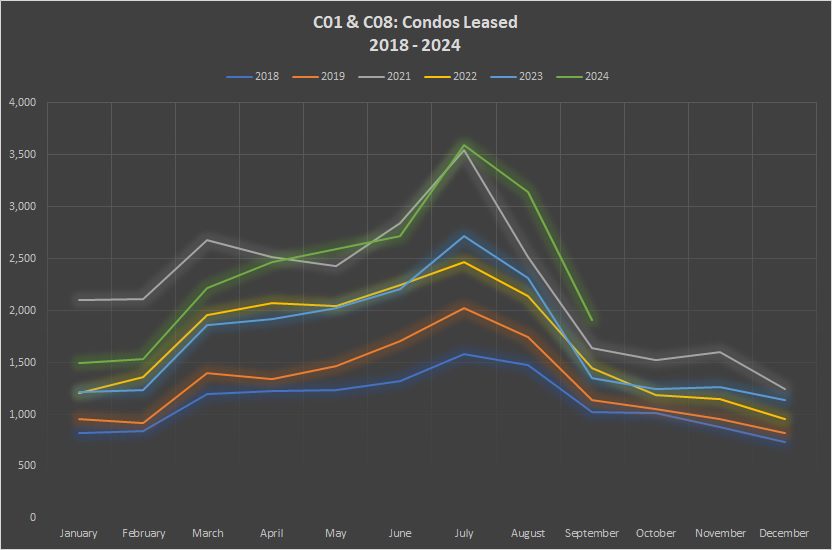
Hmm….maybe I don’t need to cut this down to 4-5 years only? Maybe it’s just that my rods and cones are firing, but my oh my, look at all the colours!
The green line is hard to ignore, however, just like it was for lease listings.
We’re peaking.
No, not peeking, like when as a child, you looked under your parents’ bed for Christmas presents (Mom, couldn’t you come up with a better hiding place?), but rather we’re peaking in terms of lease listings as well as leased units.
This is a good thing for the sake of the market and the health of the market.
And while 2024 didn’t start out with leasings/leases moving in tandem, they pulled together in Q3 as the following chart shows:
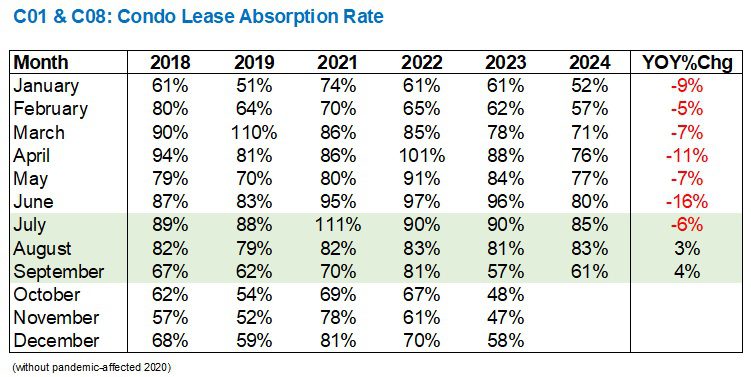
The year-over-year absorption rate was dropping in Q1 and Q2 but by August, we saw a complete turn-around.
Will we ever see a 111% absorption rate in July again, as we did in 2021?
Probably not.
But the absorption rate was higher in 2024, over 2023, in both August and September. Not by much, but this significantly bucked the trend from Q2.
The chart is where our lines start to look like Spirograph:
I actually just bought Spirograph for my daughter for Christmas.
And yes, I have purchased Christmas presents already. I’m that odd. I’ve also wrapped them…
…in any event, let’s circle back to new lease listings, just for a moment, and consider the 3,779 new lease listings recorded in August.
In the previous five August’s, we saw lease listings of:
1,813
2,217
3,061
2,572
2,871
Lease listings increased massively over previous years, but what about the absorption rate:
In August of 2024, we saw an 83% absorption rate.
The respective absorption rates in the month of August from the prior five years:
82%
79%
82%
83%
81%
So despite the incredible surge in listings, the absorption rate fell right in line.
This means that the number of units being listed for lease is in line with the demand.
Of course, I chose August, and you could choose March to prove a different point. But today’s blog post is about Q3, and in Q3, it seems as though the market is moving as it should.
Next week, we’ll return to another quarterly feature when we ask, How Is The GTA Condo Market Faring In Q3?
A hint: not great.
Have a fantastic long weekend, everybody!


Marina
at 9:35 am
David, you have the change that LHR photo! Love your content, but in that photo you look like you are sitting on a cactus. And we know you have great photos – just use the one from your website.
A friend just rented a bunch of rooms in her house, and everyone is renting from September – couple of students, couple of new grads. So it makes sense. But curious to see what you have to say on the condo market. We are starting to see some major economic struggles for non-investor owners, and with more layoffs coming up, I’m not optimistic for the next 6-12 months.
Marty
at 5:36 pm
I like the photo.
Derek
at 9:53 am
I can never really get into the rental market stuff, but I see, what did we used to call him… “LG”… tweeted yesterday:
“There are usually 2,600 condos available for rent this time of year in the Toronto area
Today, there are over 8,000 units available”
Derek
at 11:31 pm
Hoo boy
I used to think Nasma Ali was the real deal. Crooked as a barrel of fish hooks that one
https://registrantsearch.reco.on.ca/DisciplineAppeals/LoadDocument?
q=%2FOKZvhqWeDlExqSEoga53ESvS%2B7bCzdDQ5GH8hURz5vg9mfmVmr0GvqjndyuJS7OhMbWgzvnz%2BD5RK6nEc1XwQ%3D%3D