I’m really not sure where to go with this post.
Is it possible that the market can “turn on a dime?”
And if so, would you believe that my recent stories provide greater insights into the current rental market than the data from the previous three months?
The rental market has been sluggish all year, and my colleague Tara Amina and I sat down last week to chat about it in our weekly podcast, which you can view on YouTube HERE or listen to on Spotify HERE.
Most of our conversations were about how the market has changed this year and how the horror stories of providing twelve months of rent up front, or competing against ten other tenants, or even submitting an offer to lease on a scheduled “offer night” aren’t happening in 2024 like they were in 2023.
But then last week, I brought out three properties for lease and the results made me question whether the rental market has turned around.
The first was a 1-bed, 1-bath at 40 Scollard Street in Yorkville.
The building is old and tired but it’s still Yorkville, and this has been a hit-or-miss rental over the last ten years.
Previously leased for $2,450 per month, we put the property up for the same amount this year, thinking the market was sluggish and that we were really after a quality tenant rather than an extra fifty dollars.
We had 18 showings booked on the unit and that produced 7 offers.
Had we waited longer, or had I not been as transparent and direct with agents (telling them not to bring offers because we were committed to a tenant but just doing our diligence), we could have had more showings and more offers.
The unit leased for $2,600 per month, which is the most I’ve ever used this unit for, and I’ve been leasing it for a decade.
The second listing was for a 2-bed, den, 2-bath unit which we had previously listed for sale, but the owners decided to keep it for at least one more year and see what condo prices are like down the road.
Historically, the rental market for larger units has also been hit-or-miss, and over the last few months, it was quite weak.
This same model unit had leased for $3,500 and $3,400 this year, but had leased for $3,700 last fall. We decided to try the listing at $3,600 per month.
On the first day of the listing, we had five showings booked.
We had an offer in hand the very next day.
While reviewing that offer, which was from two very high calibre tenants, we received a second offer to lease as well.
We selected our tenants and leased the unit for $3,600 per month.
As with the first listing, had we left the unit up longer, we’d have had more showings and more offers. It was clear that the rental market for this type of unit was busy as well.
The third listing we put out last week is for a larger 2-storey, 1,200 square foot unit with a 300 square foot terrace, priced at $4,600 per month.
We only had two showings.
And yet those two showings produced a full-price offer from very high-quality tenants.
So has the rental market changed in the course of one week?
Summer is often quite busy as students look to secure rentals for September 1st, but coming into this summer, I expected our 2024 trend to continue.
Let’s take a look at that data…
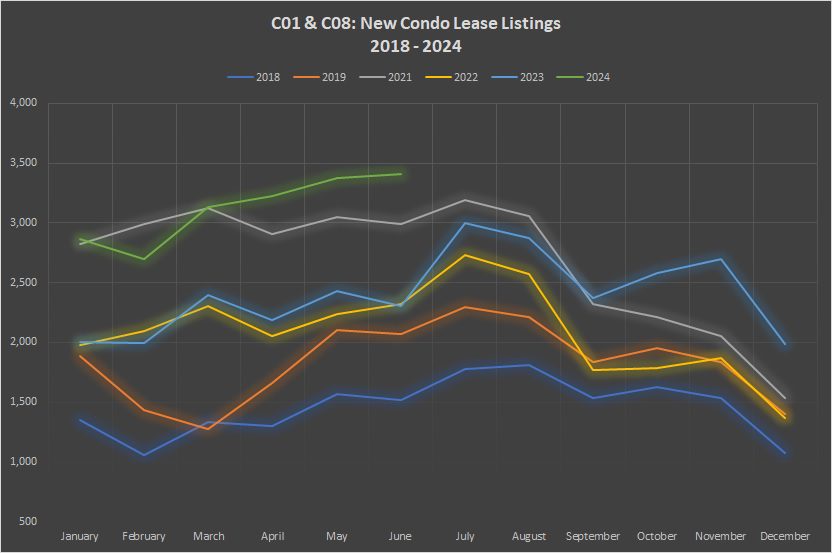
First up, let’s look at Q2 for lease listings:

Historically, Q2 produces more listings than Q1, so the uptick is in line with past results.
But the absolute number of listings is at an all-time high.
Those 3,412 new lease listings in June are more than double the 1,520 listings in June of 2018.
That’s only six years. It’s not like the city has doubled in size since then.
And simply comparing to 2023, those year-over-year figures for April, May, and June are quite high at 48%, 39%, and 48% respectively.
Those increases are also well ahead of Q1 where we saw 43%, 35%, and 31% year-over-year comparisons in January, February, and March.
Graphically, the green line tells the story:

Other than the month of February, we saw record-high numbers of new listings in every month so far this year.
The contrast between the green line (2024) and the dark blue line (2018) is striking.
Although I love numbers and statistics, I’m also a visual thinker. This chart, visually, is like a piece of art to me! It’s more Edvard Munch than Bob Ross, if you catch my drift, but it tells a story…
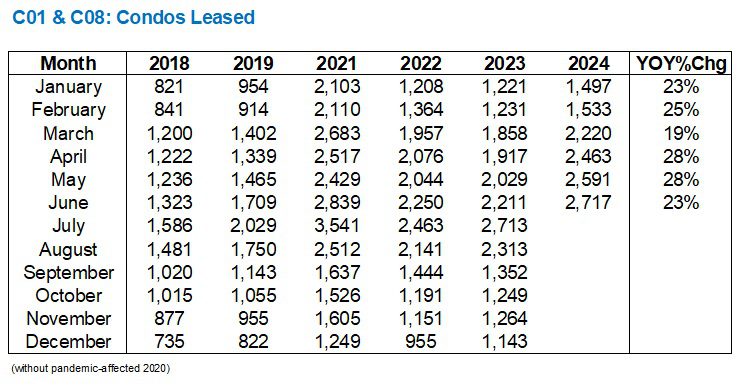
As for the number of units leased, anything short of a 40-50% year-over-year increase would weaken the rental market, so let’s have a look:

As I said: anything short of a 40-50% increase would weaken the market, and that’s exactly what we saw.
On the one hand, the number of units leased in April, May, and June are near all-time highs, with April and June only moderately trailing 2021, and with May setting a new record. I would also add that units leased are double what they were in 2018.
However, the “new listings” increased, year-over-year, by 48%, 39%, and 48% in April, May, and June, and “units leased” only increased by 28%, 28%, and 23% in the same time period. That’s going to wreck havoc on the absorption rate. But we’ll get to that shortly.
Here’s how the number of units leased displays graphically:

July of 2021 looks like a bit of an outlier, doesn’t it? Then again, there is a spike every July, so perhaps that 2021 data point was simply the result of the 2020-pandemic hangover in the lease market.
If we were simply looking at units leased, independent of new listings, we might suggest that 2024 was a fantastic year in the rental market.
Unfortunately, both supply and demand are essential factors in the “supply and demand” equation, and that leads us to the absorption rate…

If you parachuted into the Toronto rental market from some place else, and had absolutely zero knowledge of what’s going on, wouldn’t you think that an 80% absorption rate sounds…..high?
I probably would.
But we have to put this in context!
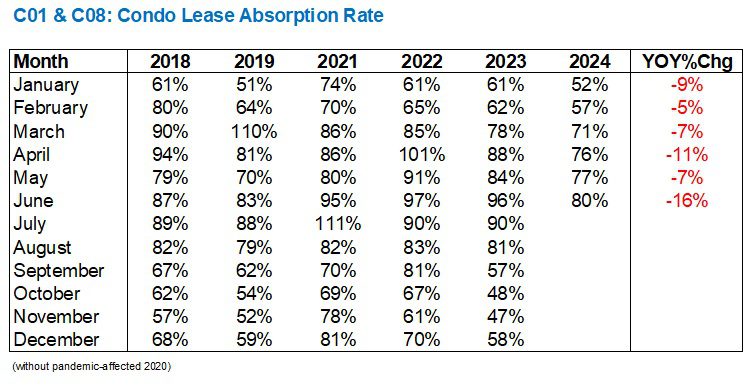
June absorption rates from 2018 through 2024:
87%
83%
95%
97%
96%
80%
It’s hardly a catastrophic decline; moving from 96% to 80%, but it should be enough to be felt by the market.
And when you look at the “year-over-year” data, all you see is red.
So is the rental market weak?
Perhaps not with an absorption rate between 76% – 80% in Q2, but it’s definitely weaker than it was in the previous two years – on paper.
Again, the green line tells a story:

Whether or not this translates to lower prices, negotiability, and leverage for tenants remains to be seen.
I heard a lot about a weak rental market leading up to last week when we somewhat randomly and coincidentally put out three lease listings, but my experience did not jive with what the above data shows.
To be fair, we’re looking backwards at Q2, and our three lease listings were put on the market in mid-July.
But to see a $2,450/month unit lease for $2,600/month, whereby we could have probably solicited 10-12 offers, tells me that, at least for now, the rental market has been revived.
If anybody has a rental story they can share from the past three months, I would love to hear it!


lawrence
at 12:40 pm
David,
did you ever think the positive rental results are a function of you & team rather than a representation of market conditions and how other agents are fairing?
David Fleming
at 9:12 pm
@ lawrence
That is very kind.
Surprisingly, no, I hadn’t thought of that. 🙂
Real people
at 8:13 am
Parasites
divya dangi
at 6:51 am
Thank you for giving this rental market idea