
Hang on a second – I’m getting an email.
And a text message.
Two text messages, in fact. Now three. Now four. Now another email. And another.
What just happened? Is the world on fire?
Nope.
We just saw the first interest rate cut by the Bank of Canada in four years.
And while I, like many others, was waiting to see what the Bank of Canada would do, I surely underestimated the response that an interest rate cut would illicit!
Starting at 9:45am (and a few seconds) on Wednesday morning, my phone began to light up. Phone calls, text messages, emails, and even a carrier pigeon with a note flew up to my window. Sadly, he flew into the glass and perished, but the note read, “What sayeth as to thou lender?”
But seriously, we will have lots of time to talk about interest rates. In fact, that might be a post for next week.
Today, I want to go over the May TRREB stats, which ironically were released the same morning that the Bank of Canada made their announcement.
Coincidence?
Or proof that God exists and she has a wicked sense of irony?
The interesting thing is: these stats are not “good.”
As you undoubtedly concluded after reading this feature in April, most of the real estate indicators would lead us to be bearish.
But as I concluded at the end of April’s post: maybe it doesn’t matter anymore?
For the last couple of months, I have been asking this question:
Will the average home price in May top the mark of $1,196,101 set in May of 2023?
That was the 2023 peak, and with upward momentum on price so far in 2024, it wasn’t impossible.
We saw the average home price increase from January to February, February to March, and March to April.
We also saw year-over-year increased in average home price in February, March, and April.
So then, did we see the average home price increase in May?
No.
It declined by 2.5%.
But month-over-month, it rose a modest 0.8%:
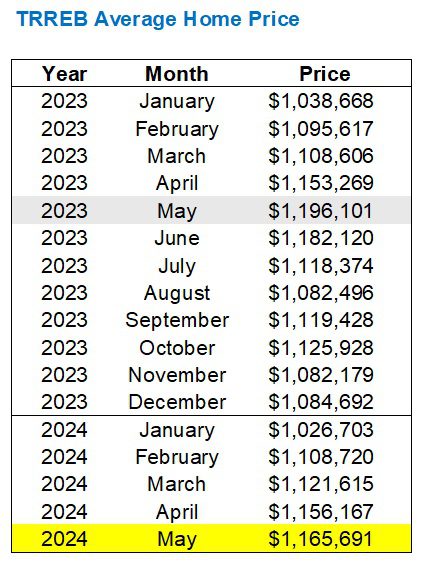
From $1,156,167 to $1,165,691 on a month-over-month basis, indicating a rising market.
But down from $1,196,101 year-over-year.
Personally, I expected to see that figure near the 2023 mark. I would have said, “Okay, sure, I guess,” if the mark was over $1,180,000, but to see it only top $1,165,000 was surprising.
May was very busy.
Prices did rise in May.
I had some absolutely outrageous “offer nights” on my listings, and to see an increase of 0.8% from last month doesn’t make any sense.
However, as I’ll show you shortly, there are different averages within that average. Stay tuned…
First, I want to answer the question, “Should we expect to see an increase in average home price from April to May?”
Yes.
According to this:
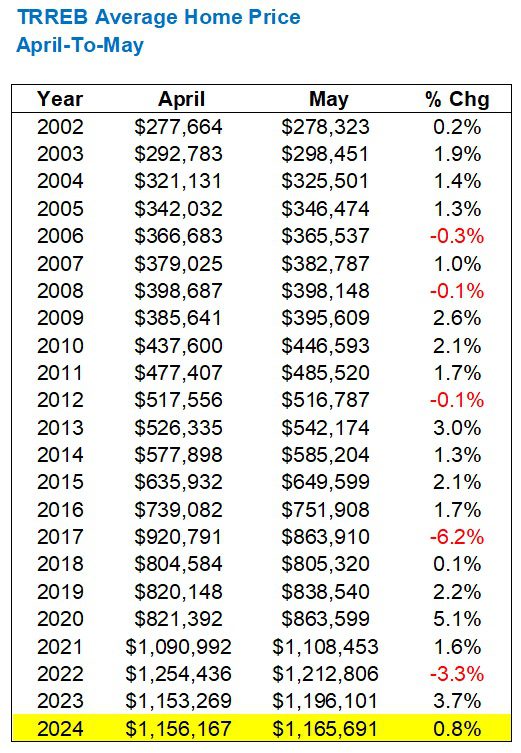
Only five times in the previous twenty-two years did we see a decline from April to May, and three were in periods of major decline: 2008, 2017, and 2022.
This, as the kids say, “tracks.”
Now, back to this idea that the 0.8% increase, month-over-month, felt “light.”
Since I generally work in the 416, my stories and my feelings are based within.
So what happens when we split that 0.8% TRREB average into five different averages in the five major TRREB districts?
Well, it looks like this:
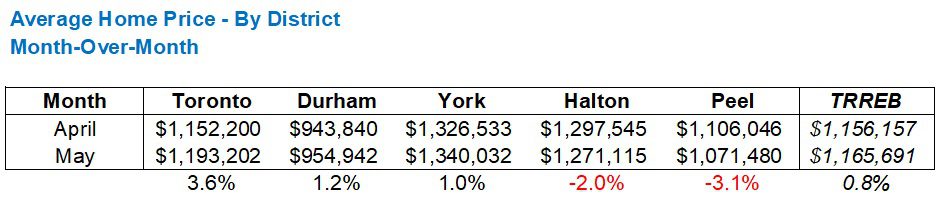
Toronto was up 3.6% from April to May, which “feels” more in line with the market than the 0.8% TRREB average.
In fact, the decline in average home price in Halton and Peel are what’s dragging that 0.8% increase down.
The TRREB average home price needed to increase by 3.5% from April in order to surpass the peak of $1,196,101 from May of 2023, and while the Toronto(416) average met the measure, none of the other four TRREB districts did.
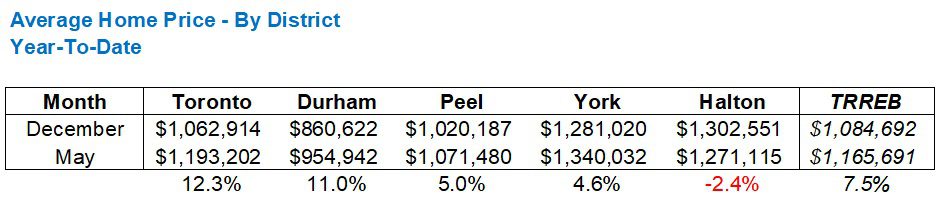
Just to play catch-up, here’s the year-to-date data for the five major TRREB regions:
Now let’s talk about sales.
Yikes.
Recall that in the month of April, we saw the fewest sales in any month of April this millennium, outside of the 2020-pandemic.
Well, the May sales weren’t a whole lot better…

Alright, so this is pretty bad, right?
Awful market metrics and indicative of a declining market?
Theoretically, yes. But then how come prices aren’t plummeting?
And consider something else:
We saw the fewest sales in 2023 that we’ve seen since the 1990’s.
Recall this chart from previous blogs:
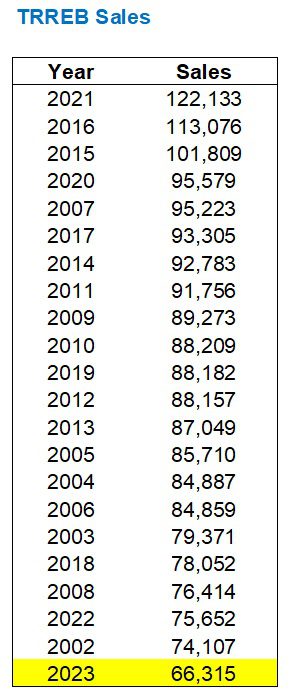
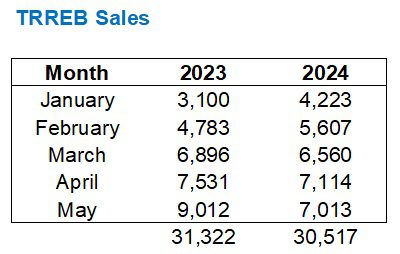
Well, guess what?
Through five months in 2024, we’re actually behind last year’s pace:
Again, I will ask: aren’t these bearish indicators?
Sure!
But the market hasn’t declined. It’s continuing to go up.
When it comes to new listings, we’re not seeing anything too crazy when we compare against previous years:
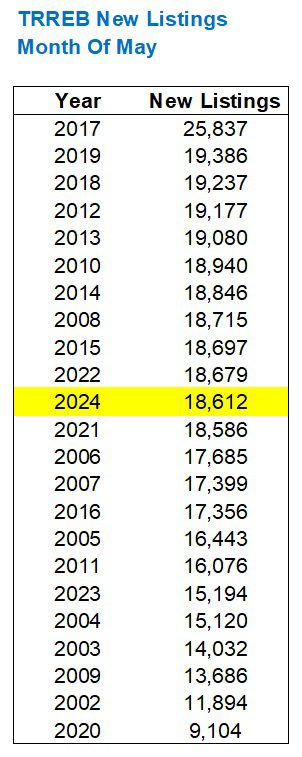
Middle of the pack. Right?
But…….but….
Oh boy, here’s the thing!
The number of listings may or may not matter; it depends on perspective. And in my mind, there could be one million listings and I wouldn’t think that’s a problem so long as there are 500,000 or more sales.
Do you catch my drift?
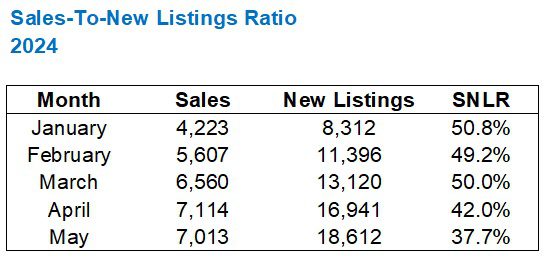
Seeing 18,612 new listings in the month of May doesn’t look like that many, given it’s middle of the pack in the chart above, but consider that we just saw the fewest sales in any month of April.
Simple math here:
7,013 Sales
18,612 New Listings
= 37.7% absorption rate
That’s quite poor.
In fact, it’s the poorest ever in the month of May:
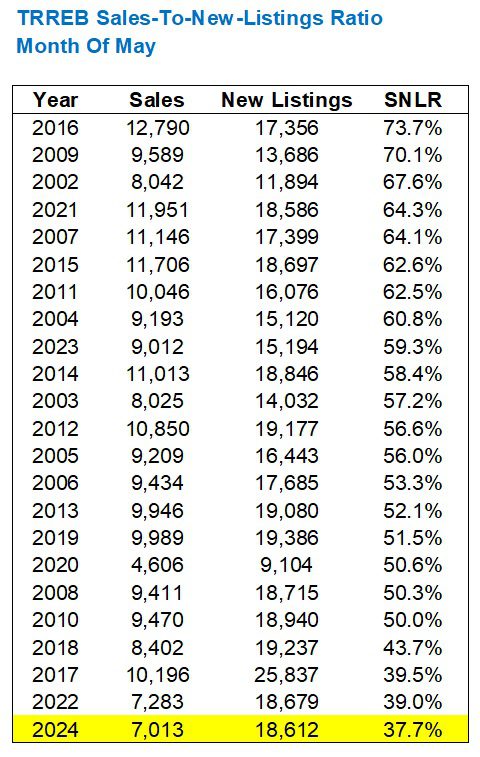
It’s worse than during the pandemic in 2020.
It’s worse than the manufactured-decline in 2022.
An absorption rate of 37.7% screams “buyer’s market,” and yet prices increased.
Year-to-date, the SNLR has been steadily dropping:
What started as a balanced market (in theory) has now led to a buyer’s market (in theory).
Only in practice, we’re still seeing a seller’s market.
I’m still pricing my freehold listings for multiple offers and getting them.
And while prices aren’t as high as in February of 2022 (they are in some areas), they’re certainly higher than this time last year.
It’s just that the TRREB average home price doesn’t show it.
Am I projecting a wee too bit here?
I mean, I’m being honest. I’m showing you negative market data, or at least data that seems negative.
But this feels like a case of something walking like a duck and quacking like a duck, but not actually being a duck.
Sales are at all-time low levels. But prices aren’t just holding; they’re increasing.
That does not conform with the laws of supply and demand that we great up studying, and yet there’s no other conclusion to draw except this: the Toronto market is resilient.
Okay, fine, now maybe I’m projecting too much.
But if any of you have another conclusion, explanation, or view, please share.
Just don’t forget to mention how you think a 75-basis-point cut by the end of 2024 is going to affect the market in June, into the fall, and beyond…


Oscar Lutgardis
at 8:26 am
TRREB market stats went up?
David: “Look, it’s a hot market!”
TRREB market stats went down?
David: “Those are wrong, it’s a hot market!”
Always a great time to buy or sell, right? So much for the last honest realtor lmao
Anwar
at 12:51 pm
I’m not hearing an explanation of why prices are rising despite poor indicators. Just rollin and trollin.
OSCAR LUTGARDIS
at 1:10 pm
Maybe try reading, champ…..
So then, did we see the average home price increase in May?
No.
It declined by 2.5%.
If you’re askin why average price went up from April to May, it’s called seasonality plus the fact that condos aren’t moving
XoXo
Dave
at 8:08 pm
Obviously it’s because sales of condos are at multi decades low. Condos are cheaper than other housing, therefore if more % of sales are houses the aver add e price will be higher. It would be more interesting to segment the stats into condos vs other and see how sales and prices look.
Rick Michalski P.App ACCI
at 12:41 pm
You dont have a clue what you’re talking about. Demand is red hot and now that rates are plummeting it will be only getting hotter!!
Almost all inventory is sellers testing the waters to see if they can get top top top dollar. Not real inventory
Make adjustments for these listings and SNLR is very very high.
Nobody
at 10:25 am
I’m seeing product sit and sit.
Houses coming back to market after 6 months and still sit.
Lots of condos sitting and price cuts not helping. Mid tier and higher houses getting price cuts.
But very specific. Some things sell quickly that I thought would sit.
But hey there’s a great free coffee bar that claims to be selling condos.
Vancouver Keith
at 1:16 pm
Prices aren’t rising, net of the real inflation rate
JF007
at 5:04 pm
Listings up sales down but prices still not coming down..could it be that people have been able to absorb the financial stress and with rentals remaining stable at the much elevated levels that they rose to..properties are not as cash flow negative as would have been as had been the case if the rentals went back to pre-pandemic levels…so people can chose to hold on to the properties longer rather than selling at a lower level??? i have a semi listed under a million in my locality for over 5 months now but the seller wont accept anything less than 1.25 mill and is no hurry to sell and all the while it is rented for 3500…so where is the incentive to reduce prices…lot of people wish for prices to come down and they probably will for the condos bought at the peak but for single family homes think we will yo-yo in a restricted price band for another few years till rates fall under 3.5%
Appraiser
at 8:56 am
“They” say rates are headed down 200 basis points before the BoC is finished.
The new neutral interest rate (~3%) will be quite manageable by historical standards.
Variable mortgages make sense again.
I believe we will start to see more buyers jump in to the market now that their has finally been a bend in the road.
Kyle
at 10:26 am
It feels like the market is in a stand-off until rates come down. For 416 freeholds, it feels like a lot of the listings out there are unrealistic Sellers relisting their homes for the 4th, 5th or 6th time, which inflates the number.
In my area, if you remove the relisted properties it seems like there are actually very few serious sellers and very few serious buyers. On the buyer side, the Investors have disappeared due to the higher cost of financing and on the seller side, no one wants to break their mortgage and refinance at these rates.
Zoidberg
at 12:45 pm
Did you see this article, David? Would love to hear your thoughts. It’s from Nova Scotia but in my view it’s indicative of the way things are going across the country: there is a concerted (and increasingly successful) campaign being waged by certain activists, lawyers, etc. against what little remains of property rights.
From the legal aid workers who are citing this as a victory for tenants and the court decision that de facto mandates landlords to provide housing to their tenants due to a “shortage of housing alternatives”, because they have been tenants for 13 years, and because “six people in a three bedroom unit makes greater use of the space than a couple and a regular visitor”, I fear we have finally and truly gone off the deep end in Canada! Property rights eroded at record speed…
“Court ruling prevents Dartmouth landlords from moving family out to move daughter in” https://www.cbc.ca/news/canada/nova-scotia/dartmouth-landlord-tenant-duplex-tenancy-renters-1.7227776
Pragma
at 1:18 pm
I don’t think people fully appreciate the state of Canada. On the margins sure a 25bps/100bps/200 bps of cuts can help, but the vast majority of debt carried by Canadians has yet to reset. The bulk of these resets run through 2025/2026. People talk about houses as though they are disconnected from everything else. Our economy is shrinking, we have weak wage growth, even weaker productivity growth. We were able to wallpaper over all of that over the last 10 years by boosting RE. You’ve used up your monetary tools, now you’re trying to use immigration – which is not working since the class of immigrants that are coming are no longer the ones who come with $2m dollars to buy a house.
We have a debt bubble by any and every measure. I’m fairly certain that RE will feel an impact from a rationalization of that bubble. Debt bubbles don’t unwind in an orderly fashion. And debt bubbles are always bigger than initial estimates.
Alternatively, yes the BoC could cut more than required on the hopes that we inflate our way out of this mess. But historically, real estate doesn’t do so well in inflationary periods, especially in real terms. Also it’s easier said than done. The world is losing confidence in DM currency. Look at yield curves, they continue to tick higher despite accepting that central banks will cut rates. What would happen to the Canadian yield curve if we have no fiscal or monetary discipline. It is easily possible to for us to slide into a higher inflation, higher rates, but low growth world.
Appraiser
at 5:39 am
https://www150.statcan.gc.ca/n1/daily-quotidien/240607/dq240607a-eng.htm?HPA=1
Ontario creates 50,000 jobs in May!!
Ace Goodheart
at 2:31 pm
The empty bedroom tax taking shape:
https://www.blogto.com/real-estate-toronto/2024/06/five-million-empty-bedrooms-ontario/
It’s just so unfair that people are allowed to have rooms in their houses, that no one sleeps in.
Why just the other day I visited an open house, where it was clear that the family of three living there, was using the fourth bedroom as a TV room and library.
The nerve of them!
They should be forced to offer it to an unhoused person.