It snowed on Wednesday morning.
In fact, depending on where you are, if you’re in the GTA, it might still be snowing as you read this.
Be honest: you had mixed feelings about it, didn’t you?
On the one hand, you’re starting to feel the warmth, joy, and nostalgia that often accompanies the month of December in Toronto, but on the other hand, you’re thinking about everything else that comes with snowfall in the city of Toronto.
Salting your walkway, shoveling heavy snow, chipping ice off your windshield, trading your fall shoes for winter boots, finally putting winter tires on your car, and of course: increased commute times in the city that already has among the worst traffic in North America.
My daughter told me this morning, “I love the snow! I get to make snow angels, catch snowflakes on my tongue, make footprints in the snow, and when there’s ‘packing snow,’ we can make a snowman!”
She learned about “packing snow” from her daddy; that much is true. And while the goal was to teach her how best to facilitate making a snowman, it was also to alleviate me of the burden and built-in failure associated with trying to roll a snowman’s torso in light, flakey snow.
But despite my daughter’s love of the snow, I can’t say I share the exact same sentiments. My daughter isn’t driving. She isn’t shoveling. She isn’t pre-heating the car in the morning. She isn’t worried about the furnace conking out in -10 degree weather on Christmas Eve, as it did last year, and she isn’t putting her outdoor running schedule on pause until the brutal cold and icy sidewalks are behind us, come February.
Oh, to be young again!
But at least we get to live it with them in the here-and-now, right?
Last weekend, we ventured out to Prestonvale Tree Farms in Courtice to cut down a Christmas tree and lug it 55-minutes back to the house to decorate, rather than simply buying a tree from the Loblaws located three-hundred meters away.
This weekend, we’ll install the outdoor lawn decorations, consisting of blue string lights, white candle lights, and a host of inflatables that seems to grow in number every year (and every week at this rate…) as my son has become obsessed with the novelty of gigantic air-blown lawn ornaments.
But then comes the relaxation, right?
As we settle into the first week of December, the Toronto real estate market is slowly drawing to a close.
For many, it’s already over. Buyers have bought. Sellers have sold. And many would-be sellers have taken their properties off the market, with plans to list in 2025, while similarly, the would-be buyers are focusing more on social gatherings and office Christmas parties than crossing their fingers and hoping a quality listing hits the market in mid-December.
Amazingly, I sold a house to buyers on November 30th – the last day of what I consider to be within the definition of “prime fall market,” which runs from Labour Day through the end of November. These clients were plagued by the same affliction that affected many other buyers this fall: lack of quality listings.
Their tale is a microcosm of what the fall market represented to me: lots of on-paper listings, but not a heck of a lot actually worth looking at.
At the end of August, I told these buyers, “You’ll likely have two or three houses to look at in each of September, October, and November, so I have no doubt that you will find your home this fall.”
But by November 29th, we had seen only one house in their geographic location and price range that met their criteria, and of course, that house received four offers, and we lost in competition.
Imagine our surprise, as we mentally prepared to pack in the housing search for the year, when we were presented with an early Christmas present on the second-last day of November! But that was the fall market to me; few quality options, competition for high-quality product, and absolutely zero predictability.
The real estate Gods gifted me the TRREB stats on Wednesday with just enough time to put this post together, as scheduled, for Thursday.
I met a would-be, 2025-seller this week who told me, “I don’t read your stats posts. Too many numbers.”
Well, for the rest of you, why don’t we catch up on the November TRREB stats?
The average home price declined on a month-over-month basis by 2.6%:
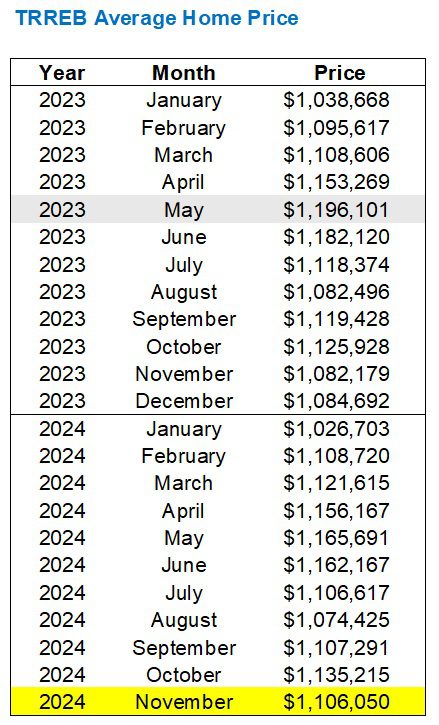
Was this expected?
Theoretically, yes.
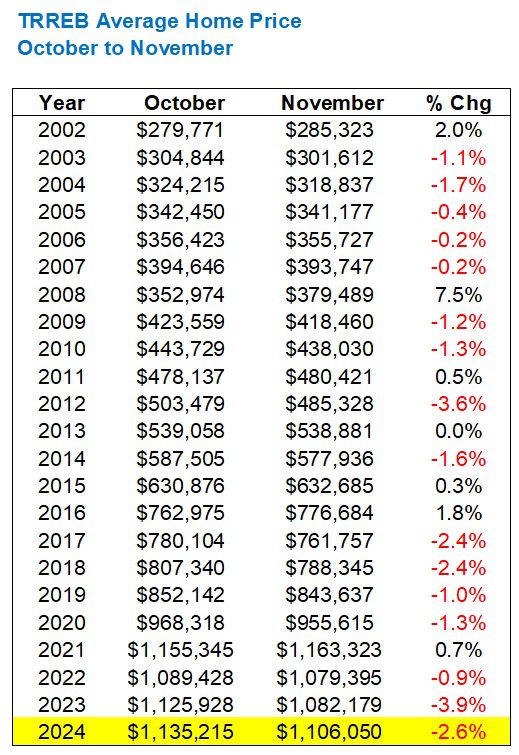
If you look back at the previous two-plus decades, you’ll see that the average home price declined from October to November sixteen times in twenty-two years:
But from my perspective, I saw strength in November.
I expected the average home price to remain flat, but then again, my mental mindset is located here in the central core, and I’m not really thinking about what’s happening with infill subdivisions in Ajax…
The 2.6% decline, month-over-month, is less than we saw in the same period in 2023, and if you recall, the fall of 2023 was a really, really tough market.
With respect to sales, here’s where you could look at this one of two ways…
First, let me show you the month-over-month sales figures comparing 2023 and 2024:
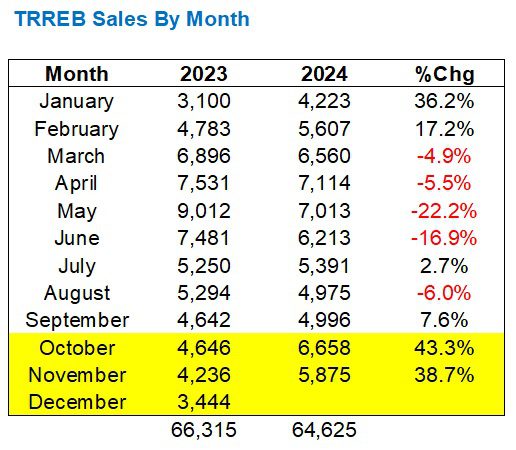
If you’re looking at these year-over-year figures, you might be inclined to conclude, “Wow, the fall was really busy!”
Perhaps.
And since TRREB revises the sales figures every year after they’re published, they have the November year-over-year at 40.1%.
Just ask me what that does to my obsessive-compulsive disorder each and every month…
In any event, the year-over-year sales figures in October and November speak volumes about the change in the market, but there’s always another perspective.
For example, if you were to look at all months of November and where those 5,875 sales rank, it might lead you to think that last month was somewhat weak:
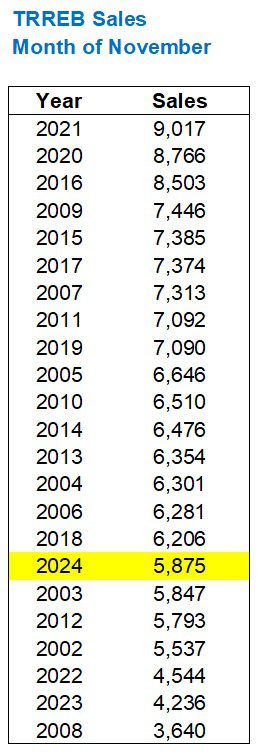
Sure, sales were up by 38.7% from last year, but last year was the second-lowest sales figure in the month of November, ever!
Another way to look at this is to see the expected decline in sales from October to November.
Amazingly, on only one occasion in the last twenty-two years did we see sales increase from October to November:
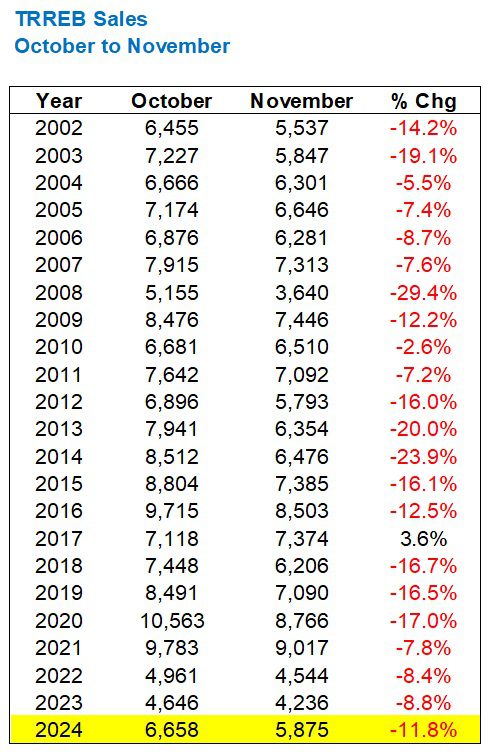
The average decline from 2002 through 2023 was 12.4%, so that 11.8% decline last month was in line with the trend.
That’s the seasonal trend, however.
I would still argue that seeing 40% year-over-year increases in sales in October and November does, in fact, speak volumes.
Despite all my talk about “quality listings” over the past couple of months, the November inventory level remained near all-time highs:
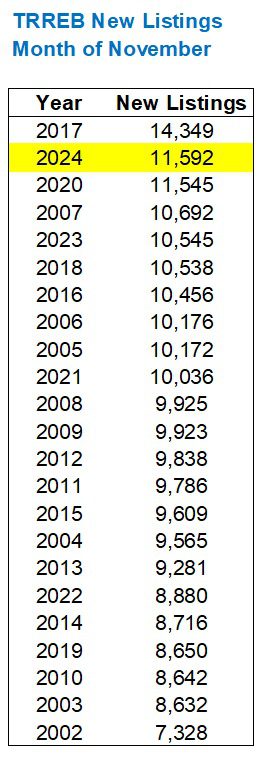
Sales were the seventh-lowest of all time and yet new listings were the second-highest of all time.
As for those new listings and the expected movement, well, unlike sales, which saw a decline in 21/22 years, new listings is showing red figures from top to bottom:
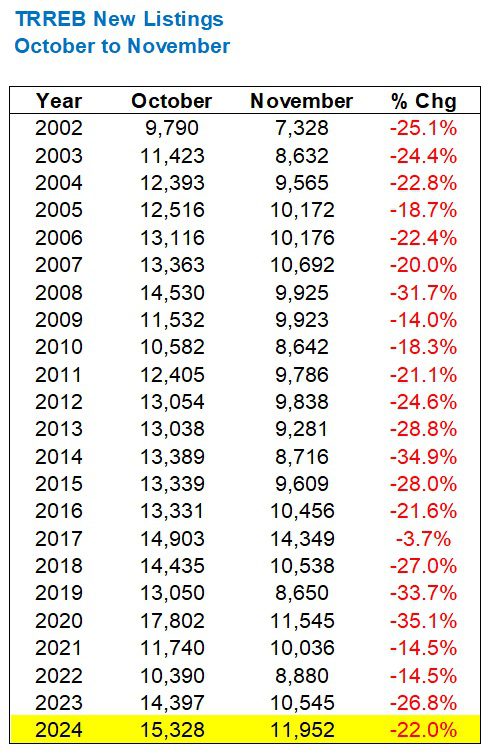
That’s right: new listings have declined every October to November from 2002 through 2024.
And the average decline preceding this year, from 2002 through 2023, was 23.3%, so once again, our 22.0% figure is completely in line with the historical trend.
Now, what does this say about the rate at which listings are being absorbed by the market?
Last month, we saw a sharp uptick in the GTA absorption rate from a feverishly low 27.6% in September to a more normalized 43.4% in October.
In November, that figure rose to 50.7% and pulled just about even with the 2024-high of 50.8% set in January:
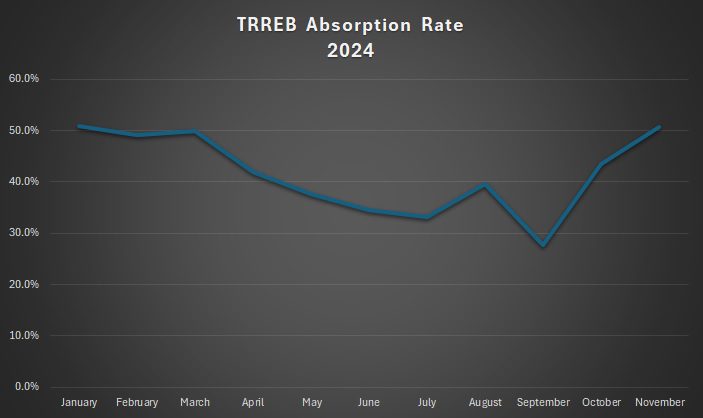
That’s a positive sign, right?
Except that, once again, there’s always data that can be used to frame the market in a different context.
Looking historically at the SNLR, we see that this 50.7% figure, while representing a virtual-tie for the 2024-high, is exceptionally low relative to other months of November:
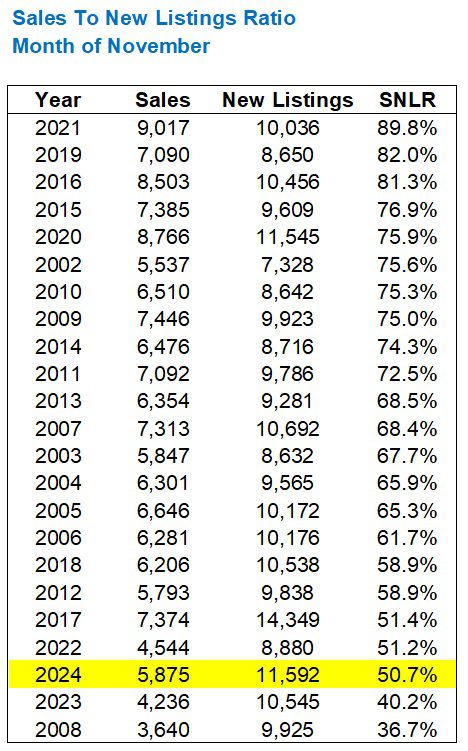
Well, at least it’s up from last year……right?
Again, if we want to frame this data point in a questionable light, we could note that the SNLR usually increases dramatically in November and December:
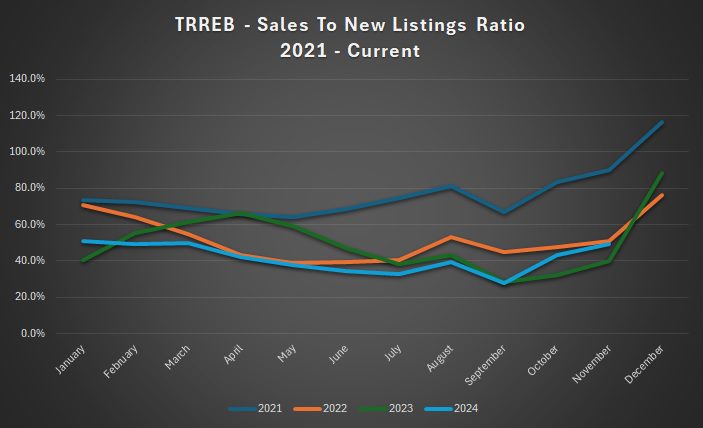
So once again, it looks to me like a market that’s “doing what it should be.”
One final note as we approach the end of the year…
Last year, we noted the dramatic decline in overall sales volume.
I provided you with this jaw-dropping chart:
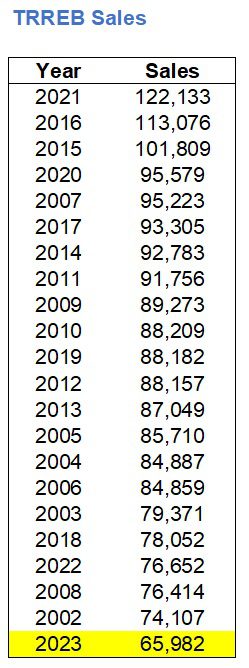
As we noted at the time:
Those 65,982 sales were only 54.0% of the record 122,133 sales recorded in 2021, or another way of saying this is that sales dropped by almost half: 46.0%.
Those 65,982 sales are over 8,000 lower than the next-lowest figure of 74,107 which was recorded twenty-one years prior.
Those 65,982 sales are 26.6% lower than the average of 89,837 sales recorded each year between 2002 and 2022.
Now, here we are approaching the end of 2024, looking at somewhere between 67,000 – 68,000 sales for 2024.
Coming into 2024, I never thought that was possible. In fact, I think that somewhere I predicted we’d see between 80,000 – 90,000 sales, but maybe I dreamt that up…
I suppose the conclusion that I would draw is this: despite two years of record-low sales, the market and home prices have held steady. They’re down from the peak in February of 2022, but on the whole, the underwhelming demand and relative over-supply has not had the effect on home prices that many expected.
Over the next couple of weeks, I’ll be regaling you with my traditional year-end content.
If anybody wants to nominate a “top blog post” or suggest a “top real estate story” for 2024, I’m all ears!


Appraiser
at 6:54 am
Excellent data once again David.
Indeed. The GTA real estate market and the 416 in particular have displayed a level of price stickiness that continues to defy every economic theory known to the dismal science.
My hot take on the market is that pent up demand is considerable. As rates continue to decline we may very well see the full fury of that constrained demand unleashed this spring.
Anwar
at 7:07 am
I have to agree, I think the market is going to explode next year!
Serge
at 9:35 am
What is missing in MLS stats, it is the percentage of first-time buyers.
Without this number, it is not clear, what is “demand”.
Different David
at 9:36 am
Sorry, the first part of the post gave me a flashback to the Griswolds going out into the forest to cut their own tree in National Lampoon’s Christmas Vacation. 🙂
David Fleming
at 12:36 pm
@ Different David
Funny story – we experienced a blackout on Halloween.
I texted a colleague who lives up at Yonge & Lawrence and said, “Are the lights out in your area?”
She wrote back and said, “No, but I’m not taking up the entire power-grid with my air-blown lawn ornaments, Clark Griswold!”
She blamed me for the blackout.
In a related story: we have more Christmas blow-ups than Halloween blow-ups…
Gale
at 10:24 am
David what do you mean when you say that TREB revises their sales figures? I’m not sure I follow.
QUIETBARD
at 12:19 pm
The TRREB stats are released early in the month and presumably compiled right at the end of the previous month. Maybe in the first week of the new month a sale fails to close, or a buyer walks away or maybe the intern made a mistake with a calculation or all of the information didn’t make it in time etc. A revision is just that. After some time when the “complete” information reveals itself they update or “revise” the numbers. Can’t imagine it being anything sinister. This sort of stuff happens in all kind of industries and institutions
David Fleming
at 2:32 pm
@ Gale
Let’s use November as an example.
The November, 2023 Market Watch shows 4,236 sales that month:
https://trreb.ca/wp-content/files/market-stats/market-watch/mw2311.pdf
The November, 2024 Market Watch shows a revised figure, for November of 2023, of 4,194 sales:
https://trreb.ca/wp-content/files/market-stats/market-watch/mw2411.pdf
I compile this data every month after the initial Market Watch is released, and this data remains in a spreadsheet. So when I pull the data next month or next year, I’m using the ‘original’ data. But TRREB makes year-over-year comparisons to their ‘updated’ data.
As QUIETBARD said, it’s nothing sinister. It just bothers me, as a stats nerd and a perfectionist.
Derek
at 12:40 pm
TRREB MLS System Average Price
2022: $1,190,742
2023: $1,126,266
2024: $???
Will 2024 end up having a higher or lower annual average price than 2023?
Appraiser
at 1:36 pm
Year to date is $1,120,300.
Looks like it will be a lower average than last year.
It also appears that it will mark the last year of this correction.
Derek
at 1:46 pm
I’m imagining the following questions are important: Are current prices low relative to where interest rates will bottom? Are current prices not yet low enough relative to where interest rate will bottom? Are current prices just right, relative to where interest rates will bottom?
David Fleming
at 12:34 pm
@ Derek
I can admit when I’m (very?) wrong: I did not have, “TRREB average home price declines from 2023 to 2024” on my bingo card. 🙁
Derek
at 1:38 pm
Royal LePage is absolutely nailing these predictions:
Royal LePage April 12, 2024:
“In the first quarter of 2024, GTA aggregate home prices rose 5.2 per cent, to $1,177,700. They are forecast to rise to $1,235,630 by the end of 2024. Royal LePage calculates the aggregate price using a weighted average of the median values of all housing types collected.”
Royal LePage December 5, 2024:
“By the fourth quarter of 2025, the aggregate home price in the GTA will be $1.22 million, up from the current $1.16 million, Royal LePage predicted in its 2025 market survey forecast.”
[Seems to be predicting a lower price at the end of 2025 than they had predicted for the end of 2024???]
Appraiser
at 1:51 pm
“Montreal-area home sales rose 47 per cent in November…the median price for all housing types was up year-over-year, led by an 11.2 per cent increase in the price of a single-family home to $600,000, followed by a 7.6 per cent rise for condominiums to $425,000…” https://montreal.ctvnews.ca/montreal-posts-big-home-sales-gains-in-november-as-median-prices-continue-to-rise-1.7135017
OSCAR LUTGARDIS
at 8:23 am
Lmao nobody cares about Montreal dude
Appraiser
at 1:17 pm
“Vancouver home sales surged 28% in November” https://www.canadianmortgagetrends.com/2024/12/vancouver-home-sales-surged-28-in-november/
OSCAR LUTGARDIS
at 2:49 pm
Awesome now do Saskatoon! Lmfao
🤡
🫵🤣
Derek
at 11:47 pm
Lol