If you’re like me, you’re 5’11 and named Dave.
No, wait, that’s not right.
If you’re like me, you’re many things, some cool, most not.
If you’re like me, you get giddy over statistics, you live for data, charts, graphs, numbers, and any facts and evidence that you can use to answer questions that you, yourself, have asked!
Some people watch Netflix before bed. Others read.
Me?
Well, I like to peruse www.baseball-reference.com on my iPhone and look at voting history for American League MVP awards in the 1940’s and consider just how different the voting would be today.
For example, did you know that Ted Williams won two MVP awards during his career but was 2nd place in voting four times, and 3rd place another two times?
Just look at how the voting went down in 1947:

What an absolute travesty!
I know Joe DiMaggio was a fan favourite, dated Marilyn Monroe, and had the “Yankee Clipper” tag, but Ted Williams doubled Joe’s Wins Above Replacement (WAR) in 1947 and thrashed Joey-Jo-Jo in every category.
How would voting go down today? Hmm…
While we’re here, we should also look at the most egregious example of “old stats” versus “new stats” in baseball history, according to yours truly:

This is the American League Cy Young vote in 1990.
The Oakland Athletics were incredible that year and Bob Welch benefitted from their historic offense to the tune of twenty-seven wins!
But his WAR was a paltry 2.9 compared to Roger Clemens (pre-steroids) who put up a 10.4 WAR on an inferior Boston Red Sox squad.
I was 10-years-old in 1990 and I thought that Bob Welch’s record of 27-6 was the coolest thing I had ever seen and that he was the best player in the league! But what did I know? I was ten!
The other night, I found myself awake at 1:00am with no hope of falling asleep.
You know the feeling, right?
It’s like you finally give up and want to do something productive, other than tossing, turning, and accidentally kicking the dog.
So I found myself reading the “Greater Toronto Area Municipal Benchmarking Study” that a friend of mine in commercial real estate had emailed me that afternoon, with the subject line: great blog fodder!
The study was commissioned by the Building Industry and Land Development Association (BILD) and conducted by Altus Group Economic Consulting, and you can read it by clicking the link above.
The findings are incredible, in my opinion, and not just because the data confirms many of the “theories” that I, and others, have shared over the last little while.
However, all statistics are open to interpretation, and one person can draw a completely different conclusion than the next.
You might think that a surge in immigration coupled with a decline in housing completions is bad for the housing market, but you might also have voted for Bob Welch over Roger Clemens for the AL Cy Young in 1990, and been happy to have defended your choice.
The BILD report is a girthy 103-pages and I’m sure every reader will have their own favourite parts.
So today, I want to use this report to test and/or confirm some of the thoughts or, for lack of a better description, “theories” that I’ve shared over the last couple of years.
Fair warning: there’s not much positivity in this report. Many of the findings conclusions and takeaways are likely to be disappointing, and disheartening, and suggest that the future of housing in Ontario is somewhat grim.
But if you’ve been paying close attention to the Toronto real estate market over the last decade, then none of this should come as a surprise.
So without further adieu, allow to share my thoughts and pull from the BILD report to shed some light on them…
–
Theory #1: “Immigration Levels Are Too High Relative To Housing Supply!”
We talked a lot about this in 2023, didn’t we?
As I wrote in a year-end blog, we went from everybody being quiet on the subject, afraid to be labeled as racist or xenophobic, to the topic sitting at the forefront of major Canadian newspapers.
But where’s the data to support this theory?
In the BILD report, that’s where!
Bolded in the report for our benefit is the following statement: “Put another way, Ontario is building fewer homes to accommodate population growth than it has in over 50 years.”
Go on, I’m listening…
From the report:
New home construction has not kept pace with overall population growth in Ontario. The number of new units started for every new person added to the population is the lowest it’s been since the data began in 1972.
In 2023, this idea surfaced that “immigration levels should be tied to housing starts.”
Then the ball just kept rolling…
“To Address Housing Crisis, Canada Needs To Lower Annual Immigration Intake”
The Toronto Star
April 11th, 2024
And that’s in the Star, of all places!
Here’s a headline for ya:
“Government Was Warned Two Years Ago High Immigration Could Affect Housing Costs”
CTV News
January 11th, 2024
Yeah, well, teflon-Trudeau has dodged far worse scandals (seriously – Google it, there are some great compilations!) so I can’t that him being warned about an economic crisis and not acting will hardly rank.
There are certainly proponents of tying immigration to housing, but there are also those who oppose it:
“Linking Immigration To The Housing Shortage May Be Missing The Problem, Experts Say”
CBC News
January 21st, 2024
But biased and unbiased newspaper articles aside, what does the data say?
Does it say that Bob Welch should have won the AL Cy Young Award in 1990 with a putrid wins-above-replacement of 2.9?
Not really.
The situation is dire and I don’t know that anybody can argue otherwise.
This chart paints a pretty clear picture:

Alright, let’s create an argument to the contrary.
Try this on for size: “What housing crisis? Huh? Housing starts are up! There were almost 45,000 home starts per year between 2020 and 2024, per the BILD report, compared to only 38,000 in the prior five-year period!”
That statement is true, but it ignores the relative immigration figures, which are noted in the chart above.
What good is an 18.4% increase in housing starts when there’s an 86.7% increase in the population?
And here’s another crucial finding in the BILD report:
The municipalities struggling the most to keep up with population growth are the fastest growing ones, namely Brampton, Bradford West Gwillimbury and Whitby.
According to the report, Bradford West Gwillimbury has seen a 2.7% increase in the population from 2021 to 2023, and Brampton has seen the same 2.7% increase as well. But these are also the most affordable real estate markets in Ontario (from those studied in the report), so if housing growth doesn’t keep pace with population growth, then affordability will decline rapidly.
A classic case of irony, dare I say?
Those municipalities lease able to create housing are the most in need of housing.
As I said at the onset: I didn’t promise that these findings would be positive…
–
Theory #2: “It Takes Way Too Long To Get Anything Built!”
We talk about this all the time, right?
Why does it take so long to get a shovel in the ground for new developments?
Where’s the bottleneck?
Is it NIMBY’s? Is it environmentalists?
Is it developers looking to shamelessly build something that’s completely incongruent with the area?
Or is it government red tape?
How long does it take to build, and why?
The findings of the BILD report were fascinating to me.
From the report:
When looking at the time elapsed from application to approval, the average timeline per application in Ontario is 20.3 months.
That’s excessive, is it not?
But the time it takes to get to approval isn’t only problematic because we’re in a housing crisis and we need homes built now but also because of the associated cost.
Another fascinating finding from the BILD report:
Accounting for annual property taxes paid on vacant land, cost escalation and opportunity cost of holding land vacant can add between $2,673 and $5,576 per month, per unit, to the cost of producing housing and the total length of a single application can add cost of between $43,000 to $90,000 per unit, per application submission.
Perhaps to nobody’s surprise, the cost is the highest in the City of Toronto:
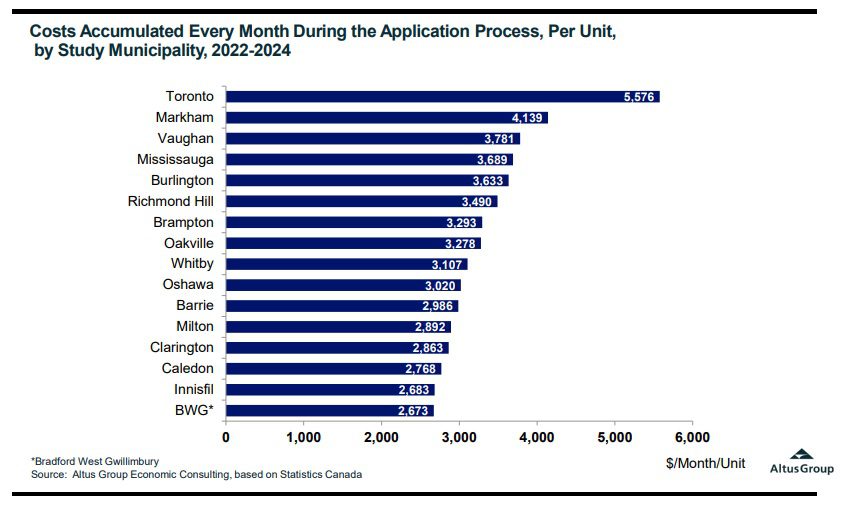
One might argue, “The developer passing along the ‘opportunity cost of holding vacant land’ to the end-user is ridiculous,” but what else are they supposed to do?
This goes back to the core of my argument over the last few years: developers are private-sector firms and they can not be expected to produce units of housing without profit.
So while I’m not exactly looking to “blame” municipalities for the added cost to construct new units of housing, via the excessive amount of time it takes to go from application to approval, we can’t deny that this cost exists.
These delays “cost” end-users upwards of $90,000 per unit in the City of Toronto!
The BILD report notes that the 20.3 month average waiting time from application to approval is down by 2.4 months, from the previous report, which points to an “improvement.”
However, if we consider how many projects were fast-tracked via Bill 109, More Homes For Everyone Act, then perhaps the improvement didn’t have anything to do with creating efficiencies within the municipalities.
In fact, we could argue that the timelines are worse when you analyze the next theory that I want to discuss…
–
Theory #3: “Nobody Is Building Anymore!”
Is this actually a theory, or have we discussed this enough through 2024 for it to be fact?
There are headlines on this topic almost daily:
“CMHC Says Annual Pace Of Housing Starts In Canada Slowed In August”
Toronto Star
Septembe 17th, 2024
Not only that, we’ve seen and heard eye-popping numbers about the decline in pre-construction sales as well:
“Sales Of New And Presale Condso Plummet In The GTHA”
CBC News
July 18th, 2024
The irony is: when it comes to building homes in Ontario, the cart does come before the horse! We only build once we’ve sold, and I’ve long argued that we’ve taken this as given, even though the concept is utterly insane when you step back and look at it objectively.
Nevertheless, the BILD report offered some fantastic insight on the theory that “nobody is building anymore,” and more or less confirmed this theory as accurate.
Applications in 2023 absolutely plummeted:
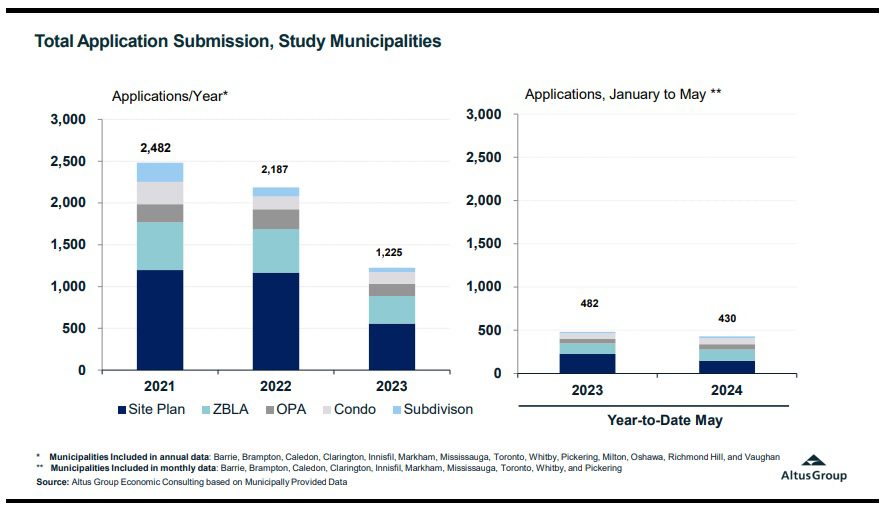
The number of applications was almost cut in half last year.
And when comparing 2023 to 2021, the number of applications were more than cut in half!
So again, let’s return for a brief moment to the second theory – that new housing takes too long to get built.
We saw a decline in the average number of months it takes to go from application to approval, from 22.7 in the 2022 BILD study to 20.3 months in the latest study.
However, and this is a huge ‘however,’ if applications were cut in HALF, then shouldn’t the decline in approval time been reduced even more?
Think about it.
It took an average of 22.7 months to sort through 2,187 applications in 2022.
It took an average of 20.3 months to sort through 1,225 applications in 2023.
Doesn’t this seem like things are getting worse and not better?
Here’s a story for you…
In early September, I met a builder who had completed an absolutely breathtaking home down in Etobicoke. As wonderful as this home was, he told me that it took him five years to get it built.
Why?
Because one neighbour held him up. One.
This neighbour worked for the City of Toronto, of course, and knew the ins and outs of the system, and combining that with having way too much time on his hands, he continuously offered 200-page reports with each objection, including hundreds of photographs – that he took himself, of newly-built houses in the GTA.
So on the one hand, we need checks and balances so a developer doesn’t build a 6-storey multiplex in between two 2-storey homes on a typical residential street, but on the other hand, it takes way too long to get housing built in Ontario, and it doesn’t seem to be getting any better.
–
Theory #4: “The Municipalities Are Driving Up The Price Of New Construction!”
How many times have I offered this to you on Toronto Realty Blog over the last few years?
In fact, I spent my Friday night preparing notes for next week’s podcast where I plan to talk, yet again, about taxation in the world of real estate, and the two biggest taxes that I have an issue with are land transfer tax and, you guessed it – development charges.
“But David, development charges and land transfer tax keep the lights on at City Hall! Without them, the city would be broke!”
And?
This is hardly “cause and effect.” Why does one thing have anything to do with the other?
Earlier this month, I wrote the following:
September 9th, 2024: “‘Tax Breaks For Developers’ Are Not Going To Be Popular Words”
In the blog post, I noted:
In 2009, taxes accounted for about 12 per cent of the cost of an average condominium in Toronto. Now, taxes account for about 29 per cent for the same home.
That’s a fantastic statistic!
But the recent BILD report shines an even brighter light on just how much of the cost of a new home in Ontario is made up of development charges that are charged by the municipality.
According to the report:
Municipal Fees Rose by $42,000 Per Unit on a Low-Rise Development, and $32,000 on a Unit in a High-Rise Development Since the 2022 Study.
That is one year.
One year!
Am I the only who seems upset about this?
I’m tired of hearing the argument that the municipalities “need” this money in order to survive.
Have the municipalities ever considered spending less?
Imagine the City of Mississauga charging $225,627 per unit of new low-rise development.
We’re in a “housing crisis,” right?
So how does this help:
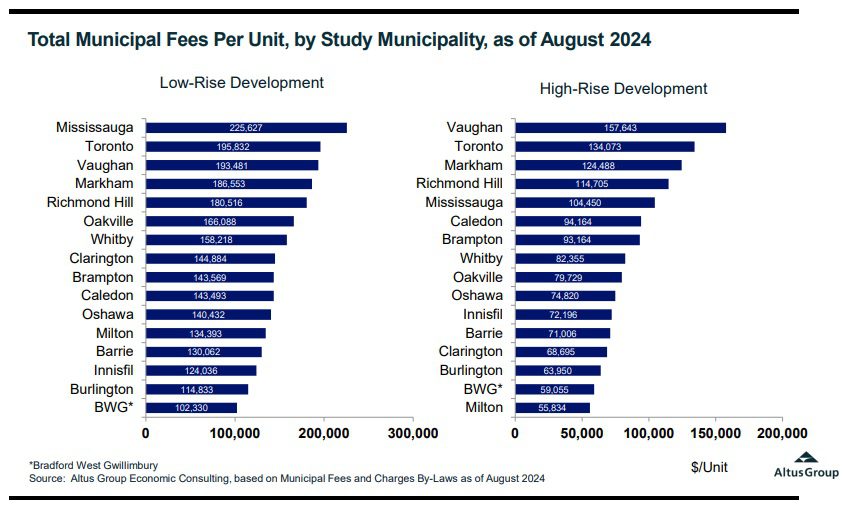
It’s absurd.
And thanks to this BILD report, we have some fantastic data to show us just how absurd it is.
For those who argue, “Everything is more expensive and everything is going up,” would offer yet another piece of data from the BILD report.
How about we compare the increase in development charges to the increase in construction costs? Maybe then we’d see just how much the increase in development charges is impacting the cost of construction, which impacts the cost to build, which impacts the sales – or lack thereof?
Check this out:
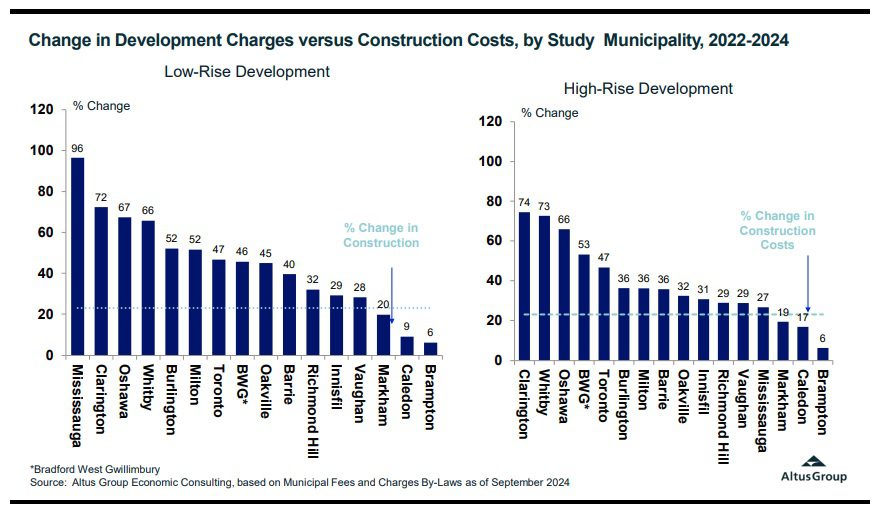
How in the world is this justified?
In summary:
- The average total fee on a low-rise unit is currently roughly $165,000, up almost $42,000 from 2022.
- Total fees on a unit in a low-rise development range from $102,000 to $195,000.
- The average total fee on a high-rise unit is currently roughly $122,000, up almost $42,000 from 2022
- Total fees on a unit in a high-rise development range from roughly $56,000 to $158,000.
–
If you’re interested in real estate, economics, politics, city planning, and taxation, read the report – it’s worth it.
Sure, 103 pages sounds like a lot, but skip past the definitions and gloss over some of the charts, and it’ll take the same amount of time that you spend watching an episode of Yellowstone.
Now, and most importantly, please go ahead and support or disagree with my theories, thoughts, and opinions above. And if you have any solutions to the “housing crisis,” then now is the time to share them.
Have a great week, everybody!





Ace Goodheart
at 1:01 pm
Interesting that there is finally a report that agrees with those of us who actually want to understand why the housing shortage exists.
Immigration is always a sore spot and a difficult topic to discuss. I have noted that Liberal governments seem to want more immigration, for the simple reason that recent immigrants are thought to be more likely to vote to the left of the political spectrum. Ie, they don’t vote conservative. I do not know whether this is true or not, but Liberal governments seem to rely on it as a method of boosting their polling numbers.
Development charges: Having lived in Toronto for a long time, I have gotten used to seeing what the local politicians actually do with the money they get from these fees. One example of this can be found up near Eglinton and Weston roads, at the end of a little one way street called Dennis Avenue. Go up there at night and you will see a bunch of multi coloured light standards, blinking away in random patterns, on the North side corner of Dennis and Weston.
What is this? It is an art project, paid for with development fee money. It cost quite a lot (I believe over a million dollars – those concrete light posts are not cheap).
For anyone to argue that it was necessary to build this, and therefore the development fee money was necessary (and the people who paid the development fees, ie the end users of the condo complex) were properly billed for this urgently needed piece of municipal infastructure….well you know what I mean I think. It is pretty to watch the blinking lights, but when you think that condo owners paid for this by an increase to the sale price of their units…..
All over Toronto you can find these oddities….all paid for by development fees, which in turn were paid for by condo purchasers. Are any of them necessary? Downtown is full of them, walk around and you will see.
The problem with politics is that it is work that politicians do. Anyone else would be like “why in the world are we doing this? This makes no sense at all?” Politicians don’t ask that question.
Anyway great article. I plan to read the entire report.
JF007
at 1:04 pm
I am an immigrant and have no qualms in saying that when I came to Canada 12 years back to now immigration is running super hot, it has been super easy to get in Canada last 3-4 years and the express entry PR program has been a disaster when looked at via a housing lens. It took me 3 years of working before I could apply for a PR and all that time I saved to come up with a down payment on a condo and then you had ppl getting a PR in 3 months without ever landing a foot in Canada and as soon as they landed they were looking to buy…so straight correlation to housing shortages..and less I talk about city spending/budget the better…services are going down property taxes are through the roof and still cities keep saying they have no money. So wish that they do audit of all major municipalities and see which pit the money is flowing into that needs taxes and charges to keep going up indefinitely
QUIETBARD
at 1:21 pm
No commentary on scrapping the primary residence exemption on the sale of a home? Seems to be the only asset class that isn’t taxed when gains are made. Maybe if people didn’t believe it was the only way to secure financial security into the future there would be less demand.
Or how about we level the playing field and offer those who rent a lifetime capital gain exemption of lets say $250K for example. We need to change the paradigm that renting makes a person a second class citizen. Or that their future is in jeopardy.
Jeremy
at 3:00 pm
Bob Welch CY Young award makes sense, looking at it through a historical lens. 10 year old David would have voted for him, as would 14 year old me.
The Joe DiMaggio MVP is a bit of a headscratcher (this was not the year he got a hit in 56 games in a row) Williams has him dominated in every category. Yankees won the pennant that year, I guess that was a heavily weighted factor back then.
Serge
at 9:13 pm
Thanks, David! “Incredible” it is…
While all data marked as produced by consultants (not links to credible sources), I found valuable population change for Toronto proper (p.10) for 2021-2023 – around 50K left, 112K international arrivals, 7K natural. That, at least, conforms to some other reports. So the growth is about 70K people in 3 years. Even if all those 50K that left lived in parents’ basements, still, in three years around 60K units was added (they never bothered about added units, only about “starts”). I still think that some units were released to the market. All this could easily house 110 K people. And we have 25K units available on the market. (Should I say – that is why we have 25K units on the market? Units to rent in almost every purpose-built rental?) The international arrivals come to the end, and Toronto has another 75K units in starts. May be this is “overhousing”, not crisis? In general, matching new arrivals and new starts seems to be oranges and apples.
Mississauga Resident
at 11:10 pm
Great article loaded with relevant facts. Canada’s affordable housing crisis is devastating. Incompetence on all 3 government tiers leave young people, newcomers and students with no place to live.
FEDERAL interest-rate games horribly hurt homeowners and propelled people into rentals. PROVINCIAL rent controls caused super-low rents that tenants BASK in and they removed apartments from the market supply for decades. Rent controls generated incredible rent disparity and terminated purpose-built apartments. MUNICIPAL incompetent programs ADD to the affordable housing debacle.
In Ontario, Mississauga Ward 7 city councillor Dipika Damerla brags it was “her idea” for MARC mandatory proactive inspections of apartment buildings, however, Dipika Damerla’s mandatory inspections could cause RENT INCREASES from landlord capital-cost AGI’s.
Councillor Dipika Damerla’s MARC mandatory inspections could ALSO dissuade purpose-built apartment construction. This limits the supply which hikes up market rents and contributes to the affordable housing crisis.
Mississauga councillor Brad Butt stated that MARC could result in “above the guideline rent increases at a time when affordability of rent is paramount.” Daryl Chong (GTAA) explained landlord capital costs are “eligible for AGI’s.” Brad Butt and Daryl Chong agreed that onerous MARC inspections and regulations could DISCOURAGE developers from purpose-built apartments. City Council Meeting Mar 27/2024 (Public Information)
On February 2nd/2024, Canadian Justice Joyce DeWitt-Van Oosten wrote that a city is “PROHIBITED from using its delegated authority” to interfere with existing statutes.
If the Residential Tenancies Act (RTA) enabled city intervention of landlord and tenant matters or building management policies then the act would implicitly grant such power. Municipalities should not interfere with landlord and tenant matters as the RTA prevails.
Canadian city councils must focus on encouraging purpose-built apartments for low-income living and not adverse MARC programs that could RAISE rents from AGI’s. Affordable apartments are key to turning this housing crisis around.