I wrote a blog in August of 2016 that looked at the catastrophic demise of “Active Listings” in Toronto, and I think it really highlighted the fundamental issue in our market.
A healthy discussion ensued in the comments section below, and then I wrote a follow-up post that looked at the reasons for low supply in Toronto.
A reader asked me to update this blog at the end of 2016, and take a second look at the numbers. I’m more than happy to oblige…

Who says the summer is slow?
I don’t know know if there were more than three or four other blog posts that solicited such a great response as this topic of “Supply & Demand” from last August!
Read the original blog post HERE, and you might learn a thing or two from reading the sixty-some-odd comments below.
Recall that the conversation centred around supply and demand, and the effects this had on the market, specifically price, but also looking at how quickly properties are selling.
We looked at five things: active listings, new listings, average days on market, total sales, and average sale price.
We looked at January through July.
So let’s expand those numbers through to the end of the year, and before we look at 2016, let’s first look at 2014 and 2015:
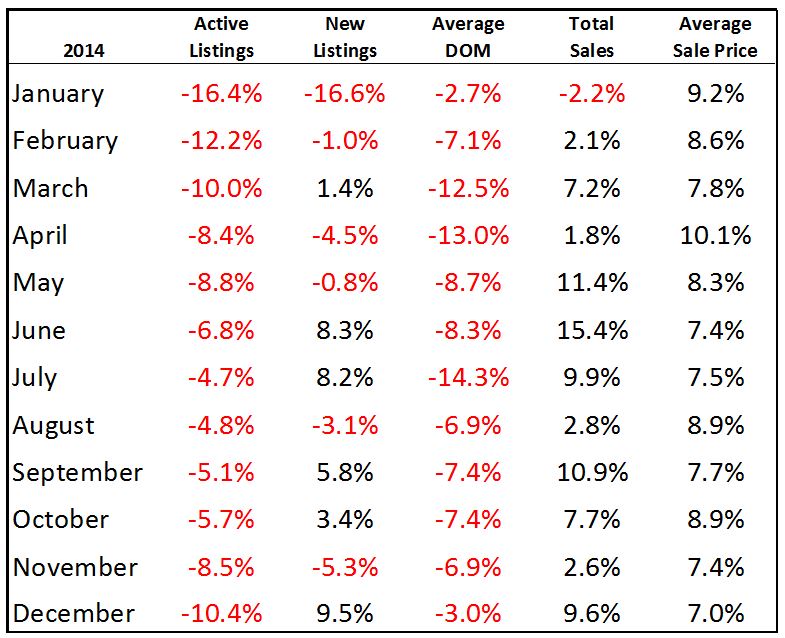
Interesting that in 2014, the decrease in active listings were the highest to start and end the year, and the fall wasn’t as bad as the spring.
The increase in average sale price seemed to have peaked in the spring, and then remained somewhat flat, between 7-9% from May through the end of the year.
I assure you that both of the above were not what we saw in 2016.
As for 2015:
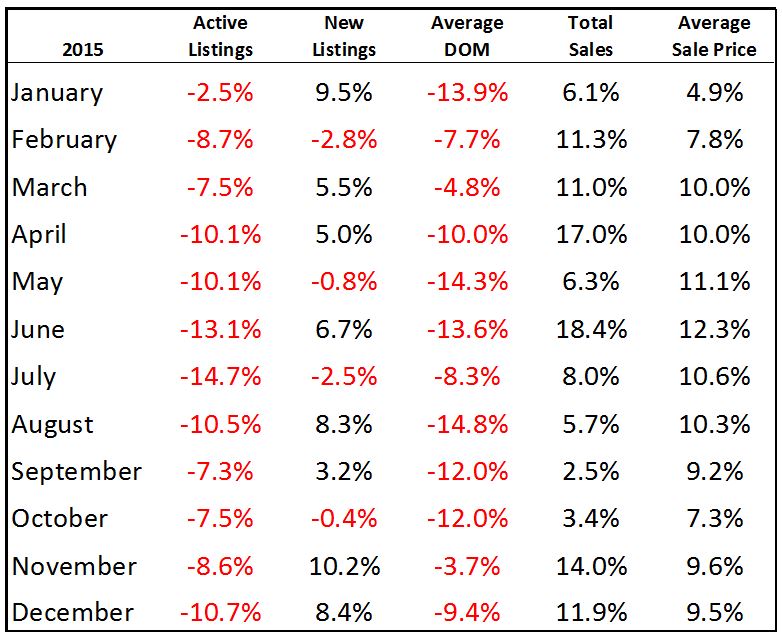
We actually saw a smaller decline in active listings in the fall market – only 7-8% in Sept/Oct/Nov, which is the busy fall market, compared to 10-13% in April/May/June, which I’d say is the equivalent busy period in the spring.
But 2016 was just a different animal all together, take a look:
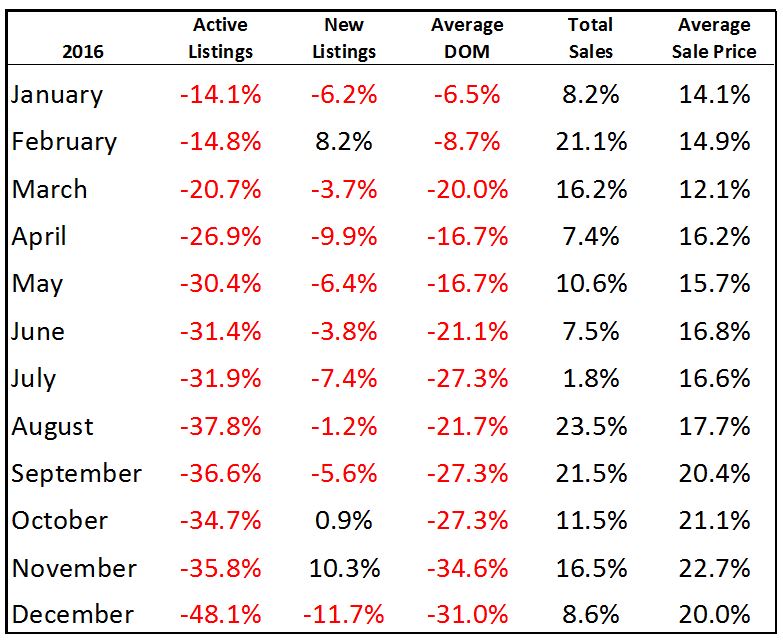
When I wrote the blog in August, we were looking at the July numbers – which peaked with an insane 31.9% drop in active listings.
We didn’t really predict what was going to happen in the fall, but you might have thought that with the “slow summer” market, the active listings would return to a level around that -25% mark in the early spring.
I, for one, did not expect the decline to continue, culminating with an absolutely ridiculous 48.1% year-over-year decline in active listings in December!
As for average home price, most people did think the 16-something-percent increase in year-over-year home price that we saw from April through July would be the high water mark.
In the end, we saw a 20% floor in the fall, with the monthly average peaking at a 22.7% increase in November.
It was just nuts.
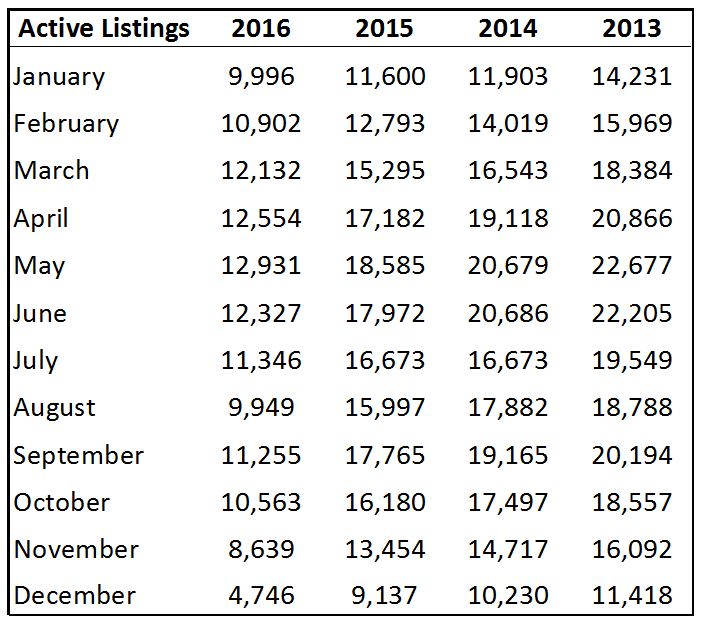
Here’s how the active listings look over the past four years:
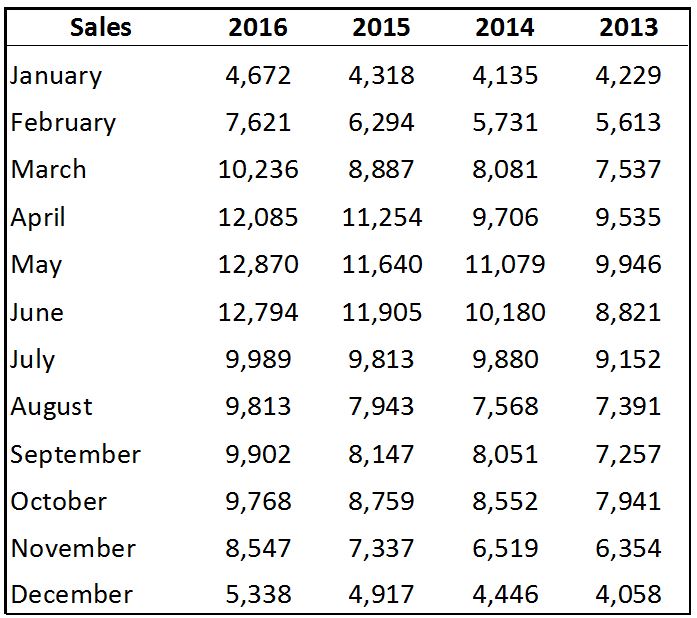
And sales, which of course, went the complete opposite direction:
Now here is the most impressive (or most depressing) graphic of all.
Call it what you want, but it’s certainly the most eye-opening; it tells the largest tale.
Looking at the decrease in active listings from 2013 to 2016, each month of the year:
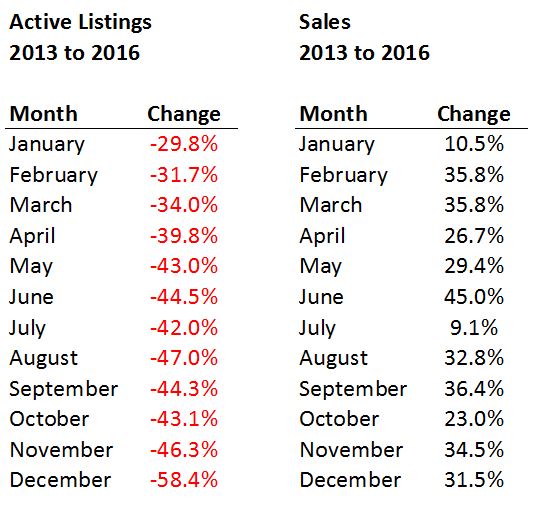
Look at December!
There were 11,418 active listings in December of 2013.
There were 4,746 active listings in December of 2016.
Isn’t that crazy?
The decline is staggering.
And sales are up each and every month, with a midpoint of around 30%. I don’t know what’s going on in July – if that’s not the very definition of an “outlier,” then I don’t know what is.
But I look at the list of “active listings” above, reading from January to December, and I see 20%’s, 30%’s, 40%’s, and 50%’s. It just gets worse, and worse, and worse.
Fewer people are selling in Toronto.
But more people are buying.
The math doesn’t add up, and if I said “something has to give,” I’d be too late.
What’s given, is the average home price, as “the levy has already broke,” and the flood happened last year.
Will it continue?
That is the question as we try to get an early feel for the 2017 market.
Sales are trickling through so far, and thus it would be premature to give you any indication whatsoever.
Give me another 7-10 days, and I’ll let you know what kind of market we’re in.


Appraiser
at 8:59 am
The first 3 charts clearly indicate a significant shift in the Days On Market data from 2014 to 2016, especially the latter half of 2016.
Decreased new listings are a factor propping up prices, but new listing were only down about 10% last year, while active listing shrunk by 48%.
Incidentally, December had an unheard of sales to new listings ratio of almost 130%!
It is the sharp decline in marketing time that I believe defines this incredible market. This is a function of demand which unlike supply, is very difficult to quantify. For now lets just call it yuuge!
Ed
at 2:28 pm
You would have to think that DOM stats are being swayed by ever more popular way of marketing which is of course to price it under market and having a bidding war one week later on offer date.
Appraiser
at 7:56 am
You are probably right @ Ed, except that the days on market would be even lower without offer dates. Properties that could have easily sold in one day now show up in the stats as on the market for one week.
Kyle
at 9:25 am
These numbers appear to be based on GTA-wide data. My gut tells me that in the 416 the trends are even more pronounced. In the West side neighbourhoods that i follow, it feels like the music has stopped in a game of musical chairs. Those that own their home are sitting and staying and not going anywhere, those that don’t have been caught out and are now out of the game.
On the West side, i’ve noticed in the last 5 years a steady increase in renovation company signs and a steady decrease in real estate Agent signs on the lawn. People have been opting to do major renovations instead of move. This decreases the supply of homes, and when a home does finally come on the market, it has been substantially upgraded, so prices have no where to go but further up.
Will the shrinking inventory rising sales continue? No. I think the # of active listings will continue to shrink, until it effectively hits 0 (i.e. only remaining inventory left are the truly unsellables or houses just waiting for their offer presentation date to come) at which point it won’t be able to shrink any further. And the # of sales will continue to rise, until it becomes constrained by the supply of new listings, at which point it won’t be able to rise anymore. That’s when scarcity pricing kicks in, think Hatichimals at Christmas. And i know there are those that will call me a cheerleader or bull or pollyanna, but i am seeing this already in certain neighbourhoods.
Joel
at 12:02 pm
I think that these are good points about the renovation of homes. I see it more and more often as well.Now when people buy the older, run down homes they are fixing them up before moving in.
This is driving the sales price up as many homes that are bought have seen major renovations in the last few years and are of a better quality. This pushes prices of homes up and creates an even bigger gap.
We are going to need to see more condos and townhome spread all across the city and grow density in each neighbourhood. There needs to be a more reasonable option for many people in the city. The cheaper land from outside of the core combined with denisty is about all I can think of to help.
Nick
at 12:52 pm
I think your posts are bang on with more people opting to stay in their current homes and renovate we really need to start seeing a lot more new builds. It can’t just be condos though it needs to be a mix and it needs to be on any space available within the 416. All the brownfield sites are where I think we need to go .
Condodweller
at 1:38 pm
David, is the Total Sales number the percent increase of homes sold or is it of the $ value?
I imagine the large decline of active listing vs. new listings is due to shorter time on the market mostly and some existing inventory being chewed up. Wouldn’t it be better to compare new listings vs. total sales to draw conclusions on the state of the market?
I have a hard time wrapping my mind around new listings and sales going in opposite direction. I would expect a 1 to 1 relationship between new listings and sales, assuming sales are # of units sold, with some coming from inventory though I imagine inventory is a vanishing commodity and therefore less significant.
Sam
at 3:23 pm
This looks similar to what we had in Vancouver. Low supply and high demand before the 15% foreign tax and the vacancy 1% tax took place. I don’t see anything that will result in stopping this momentum unless you have more taxes implemented by municipal and provincial government on real estate. Even if 2017 may not be as hot as 2016, all trends point toward higher prices by end of 2017.
Libertarian
at 5:51 pm
Well, we know that the provincial gov’t isn’t going to impose taxes. Wynne is desperate to get re-elected, so she’s giving money back (land transfer rebate). She’ll probably also implement Hudak’s idea of copying BC’s loan plan. Wynne and Clark are both so desperate to get re-elected that they are going undo the federal gov’ts moves to reduce mortgage debt.
This is slightly off topic, but it scares me how little our 3 levels of government co-operate on anything. Here we have the federal government saying that mortgage debt is a threat to the economy, so they are going to reduce it, but BC, and likely Ontario, simply figure out a way to undo that. Ridiculous! Then of course, the city wants money, and since the feds and the province won’t give them any, the city raises taxes. I can’t believe that this still happens in 2017!! It’s not 1867 anymore. Can we give ourselves a birthday present for 150 years and modernize ourselves a bit.
Kramer
at 4:37 pm
I think we are missing the mark on Supply & Demand… assuming the goal is to figure out why things are happening so that we are able to make educated forecasts and not just wild guesses while talking over beers and pigs-in-blankies at parties.
First of all, while I applaud David’s resourcefulness in getting actual data (and I have applauded this in the past)… we are not focused on the right metrics. Inventory, days of inventory are a RESULT of the current state of Supply & Demand combined with other factors…
It makes me think of a Jack Nicholson line: “I’m drowning here! And you’re describing the water!”
I thought of an analogy to help make things more clear and move us forward.
Imagine the SkyDome, and every seat is a house.
1. Every seat is currently owned. THIS CURRENT OWNERSHIP IS PART OF TOTAL DEMAND FOR SEATS.
2. There is a mob of people outside the stadium who are actively trying to buy a seat. THIS GROUP IS ALSO PART OF TOTAL DEMAND
3. Every once in a while, someone wants OUT OF THE STADIUM completely… THIS IS PART OF SUPPLY
4. Every once in a while, the stadium builds a few more seats… THIS IS PART OF SUPPLY
5. Whether an owner decides to renovate their seat OR sell their seat and buy a different seat DOES NOT IMPACT SUPPLY OR DEMAND – we must assume that if the owner is intends to stay in the stadium but move to a different seat, then they will buy it from source 3) or 4) above before selling their current seat – in other words, they will always own a seat, and their exchange has NEITHER increased supply nor eased demand. The whole renovating vs moving thing has no place in a conversation about SUPPLY… If it explains something about INVENTORY, then this is proof that INVENTORY is NOT a pure metric of SUPPLY, but rather a metric that also depends on other factors, such as high transaction costs. Inventory is a RESULT of Supply and other factors… Inventory is not the same thing as Supply.
CONCLUSIONS:
1. The true state of SUPPLY is strictly dependent on:
A) people wanting out of the stadium completely
B) new seats being built
2. The true state of DEMAND is strictly dependent on:
A) The number of people who have no intention of leaving the stadium completely
B) The size of the mob outside that is actively trying to buy a seat
Hence, to describe/forecast SUPPLY, we need to describe/forecast/explore/compare/analyze:
– Housing Starts
– Employment
– Certain Demographics (ages, etc, death rates… someone hire an actuary for the blog).
– Interest Rates
– Prices – in other words, should investors cash out.
When I picture Supply, I picture an equation where each of these are independent variables. One day I’m going to build it and become rich. I won’t forget my blog friends.
Kramer
at 4:40 pm
To be clear…
CONCLUSIONS:
1. The true state of SUPPLY is strictly dependent on:
A) people wanting out of the stadium completely – because they are moving cities, or they die, or they lose their job or rates go up and they can’t afford their seat anymore, etc…
B) new seats being built
Kyle
at 5:08 pm
I’m guilty of misusing the word Supply. I use it to refer to what’s available for sale at a given point in time (i.e. Inventory or active listings). Under this interpretation the number of people renovating vs moving or how long people stay in their homes makes a huge difference to what’s available for sale at a point in time.
Kyle
at 5:23 pm
I’m also guilty of misusing Demand as well. I use it to refer to active buyers who are out house hunting. When i talk about Supply and Demand in real estate, rightly or wrongly i view of it more like liquidity for a stock, where Bids = demand and Asks = supply.
Kramer
at 6:00 pm
I shouldn’t have said demand includes current owners, if that’s the case then current houses owned are also part of supply… in any case they wash eachother out.
But yah, I feel like we are cheating ourselves dwelling on inventory. If we want proof that there is inadequate supply we only need look at the prices.
In my analogy, it’s so interesting that the government tackles the “problem” by trying to shrink the size of the mob out front of the sky dome… I guess because it is all they can do! They can’t build enough new supply and they can’t make people sell, otherwise too many people will sell and it collapses the market… so how can you gradually impact things? Shrink the mob outside.
Kramer
at 6:06 pm
There is a supply function out there waiting to be solved…
Condodweller
at 9:17 am
I think it’s safe to say the supply problem is not going to be solved anytime soon. This is why everybody, including the CMHC, is focusing on the demand side.
Kramer
at 9:53 am
Indeed… probably impossible… those supply functions are probably only used in textbooks to teach Economics 101… probably rarely used in the real world for the reasons you stated… at least for anything more complicated than widgets or commodity products. Real Estate could be impossible to build one.
It would be interesting though taking this approach and looking back… my old man who refuses to count real estate gains as investment gains (unless you own investment properties) showed me the Toronto home prices graph, looking at the run up in prices to something like 1996 and how it then dropped and took 10 years to get back to 1996 levels… if you could identify what changed in that period (guessing driven by rates, market crashes, new housing developments in 905, milton, or whatever was being built, etc all adding up to more of a drag than population growth)… you could envision what could POSSIBLY impact the market in the future… but it’s a different world now.
Kramer
at 9:40 pm
Last thing… sorry for redundancy.
At the end of the day David’s conclusion is correct when he says simply: “Fewer people are selling in Toronto.”
But my points are really just trying to say that this is for many fundamental reasons, generally speaking:
1. People are not leaving Toronto
2. People are not forced to sell (by increasing rates or unemployment)
3. People are living longer (this reason gradually impacts number of sellers over time and has been for a while and will continue to)
4. Investors are not cashing out, generally speaking.
These factors and newly built supply directly determine Supply. For the rate of Supply to change, these factors have to change.
People who simply move within the GTA are both a seller and a buyer, so it’s a wash… so if people renovate instead of move, then it’s no impact on net Supply & Demand… so whatever impact this phenomenon has on “listings” is not an impact on Supply & Demand.
I want something like:
Supply = Price(x) – Average Income(y) + Interest Rates(x) + Unemployment(p) + Ratio of Investment Properties to Primary Residences(q) – Population(w) + Death Rate(f) + Newly Built Supply … etc…
Wishful thinking I know… but if we had that… and did the same for Demand… then… well then we’d probably just have proof that the market is going to keep going up forever 😉
Will
at 11:27 am
Once in a while someone will buy 3 or 4 seats, remove them, and replace with 12 seats in the same space.
Or they might buy about 10 seats or so, and replace it them with a big couch where 200 people share, even if it means having to sit on each others’ laps (condo).
Ralph Cramdown
at 1:08 pm
One thing: In hot markets people who are moving within the market tend to buy their new home first and list their old home after, as they’re fairly sure it will sell quickly. In cooler markets, they often list first and buy only after their old home is sold. It seems fairly insignificant, but in a market where only a small percentage of homes are for sale at a given time, the difference between movers briefly owning two homes, or briefly owning zero homes makes a difference.
Kyle
at 3:59 pm
I agree with Ralph’s assessment. In a sellers market, those moving will usually look to buy first (i.e. become part of demand) then sell after (i.e. become part of supply), unless they buy and sell same day they will impact both sides of the market but at different times.
Another example: If you are a buyer waiting for a house that suits your needs to come along, and suddenly 500 people decide to move and list their homes, you suddenly have 500 more active listings to choose from. I agree with Kramer’s point that you will also likely have 500 more households to compete against, but i don’t necessarily think you can wash demand (in the active buyer sense) against supply (in the active listings sense) until they actually transact and truly remove themselves from that side of the market.
Kramer
at 5:13 pm
I think we are all correct and are just looking at things from slightly different perspectives. All good points.
My perspective is that the only important thing should be true net supply in a category, ie detached homes for example. If someone moves from one to another, demand has not been eased. Demand is only eased if someone in a detached home sells theirs and leaves the detached market completely, (or if a new detached house is built somewhere). If everyone owning a detached home currently just plays musical chairs, no one waiting to get in the market will ever get in (theoretically).
Condodweller
at 9:13 am
Your idea of using a formula to gauge the market is a good scientific approach. The trouble is, as you said, you would need an actuary to come up with the data, and not only that, he/she would need reliable numbers for each of your factors for the results to be meaningful. Call me a cynic but I have a hard time seeing that happen when for instance we can’t even agree on, what I think should be a simple data point to nail down, foreign buyers. I’m not saying it’s impossible but it would be extremely difficult to come up with a formula that works reasonably accurately. If you did, I agree you would be a very rich man!
Assuming you manage to crack the nut and you do come up with a working formula based on the data, you would also have to add an x-factor or two, to account for human emotion and black swan events.
It’s a great idea though and be sure to let us know your progress.
Kramer
at 9:54 am
Indeed… probably impossible… those supply functions are probably only used in textbooks to teach Economics 101… probably rarely used in the real world for the reasons you stated… at least for anything more complicated than widgets or commodity products. Real Estate could be impossible to build one.
It would be interesting though taking this approach and looking back… my old man who refuses to count real estate gains as investment gains (unless you own investment properties) showed me the Toronto home prices graph, looking at the run up in prices to something like 1996 and how it then dropped and took 10 years to get back to 1996 levels… if you could identify what changed in that period (guessing driven by rates, market crashes, new housing developments in 905, milton, or whatever was being built, etc all adding up to more of a drag than population growth)… you could envision what could POSSIBLY impact the market in the future… but it’s a different world now.
heating and cooling tronnto
at 9:48 am
I really like that post.