
At the risk of working backwards here, I think that before you can define a market “recovery,” I think it would be prudent to first define a market “correction” and a market “crash,” no?
What would you call a market crash?
The Internet is littered with definitions, and it’s scary how well Google’s AI function describes it:
How It Happens:
1) Bubble Formation (Run-Up): Low interest rates, loose lending, and speculation drive demand, causing prices to rise rapidly, creating a bubble.2) Unsustainable Growth: Prices become inflated far beyond what people can afford, often with risky mortgages.
3) The Burst (The Crash):
-Economic Shift: Interest rates rise, the economy slows, or jobs are lost, reducing affordability and demand.
-Oversupply: Builders continue construction, adding to inventory while demand falls.
-Loss of Confidence: Buyers disappear, sellers panic, and prices plummet.
That’s a pretty solid definition, and most market crashes follow these points precisely.
Of course, this definition, like almost every definition out there, is missing one important piece.
Do you know where I’m going with this?
Prices or percentages.
Most definitions won’t put numbers to the concept of a “crash,” and I think there’s a good reason for that.
Without using actual numbers, it’s much easier to label something a “crash.” From the definition above, we could apply these descriptions and events to all kinds of market cycles in the past, even when prices were flat, or even accelerating.
I’ve been hearing about the market “crash” since before I started in this business.
I have two stories that serve as my favourites, both of which I’ve told on TRB a dozen times over the years.
The first involves a very successful businessman for whom I did landscaping and construction in 2003, as I was completing my real estate license. He had been successful in many industries throughout his years, and I trusted his advice, opinions, and guidance emphatically. When I told him that I was going into real estate in 2003, “This is a terrible time to go into real estate. The market is about to crash.”
The GTA average home price declined from 1996 to 1997, and then increased every year thereafter, to the point where I had this discussion with one of my early mentors in 2003.
Historically, most “market cycles” average seven years. By the time 2004 rolled around, and I was licensed to sell real estate, it had been seven years of year-over-year price increases in Toronto.
I don’t know if my mentor was basing his prediction of a “crash” on this seven-year theory, or whether I’m applying this economic principle in hindsight, but I understand where he was coming from.
As we all know, the average home price increased in 2004, and increased every single year thereafter until 2018.
My second story involves a childhood friend who had always been a “know-it-all.”
You know the type? Surely you had this friend when you were growing up.
Every word out of his mouth was regurgitated and could be sourced back to something that somebody else said, and much of the time, his comments started with, “My Dad says…”
In 2006, my parents still owned our childhood home in Leaside, and I was in my third year of real estate.
My friend told me one day, “I’m really surprised that you don’t have it on the market right now.”
That was all he said, however. He was begging me to follow up with, “Really? Why?”
Eventually, he offered, “You could sell it today, then in twelve months, buy it back for half as much.”
Uh-huh.
Sure.
He said, “The market is about to crash. It’s going to be really bad out there. You should really consider telling your parents to sell the house, because they clearly don’t know what most people know out there.”
Yeah.
The GTA average home price increased 6.9% that year, and continued to increase, as we all know.
My point is this:
It’s nearly impossible to predict a crash, as we’ve all seen over the last thirty years. But to simply define a crash is no easy task either.
Not only that, we need to define a correction as well, while attempting to differentiate between a crash and a correction.
I know that many of the regular readers on TRB work in banking, finance, economics, public policy, and the like, so I’m sure that many of you will have your thoughts on this as well. I welcome your own definitions in the comments section below.
I believe that in order to define either a “crash” or a “correction,” two important elements must be present:
1) The amount of the decline, as a percentage.
2) The elapsed time period.
Just as an exercise, go to a search engine and look for “crash” or “correction,” and most will not have either of these elements. They define the characteristics of the crash, the reasons, or the origin, but don’t really “put their money where their mouth is,” so to speak.
Here’s what I believe.
A market correction is in the neighbourhood of 10%.
A market crash is in the neighbourhood of 30%.
Oh, great. Thanks, David.
So what do we make of a 20% decline that falls right in between those definitions?
Well, that’s exactly the point! There are always going to be grey areas, and nothing is ever cut-and-dry.
That’s why you need to throw in the second element: time period.
I would offer that a 10% decline in 24 months is a correction, but then what about a 10% decline in 12 months? Or 6 months? Or 2 months?
A 10% decline in two months could be considered a crash, right?
But that’s why we need to include a third element: recovery.
For example, the DOW Jones dropped at the onset of the pandemic from around 29,000 in February of 2020 to as low as 18,000 in April, but was back above 29,000 again in September.
Does that represent a crash?
In a vacuum, absolutely. The market “crashed” as the DOW Jones dropped around 38% in a period of weeks.
That’s a crash!
But after we saw it recover in September, could we go back and revise our definition of a “crash?”
Because if the DOW Jones stayed at 18,000 or thereabouts, we’d call it a crash. But after regaining that ground only seven months later, we’d have no choice but to label those events a “fluctuation,” right?
All this is to say that defining a crash, correction, or fluctuation is completely subjective, and the definitions will differ before, during, and after the events. Revisionist history is real.
So let me revise my definitions to include the time period:
A market correction is in the neighbourhood of 10%, inside of 12 months.
A market crash is in the neighbourhood of 30%, inside of 12 months.
Following this logic, I would offer the following:
A decline of 30% that takes place over 36 months is a correction.
Do you see where I’m going with this?
A “crash” has to make a “bang.”
A 30% decline, which is substantial, can’t be spread over three years. That’s a gradual decline and thus would be considered a “correction.”
Let’s test that theory, shall we?
Our market “peak” was in February of 2022.
Using figures from November of 2025 (I prefer not to use December as it’s seasonally depressed), let’s look at how the five major TRREB districts have moved since then:
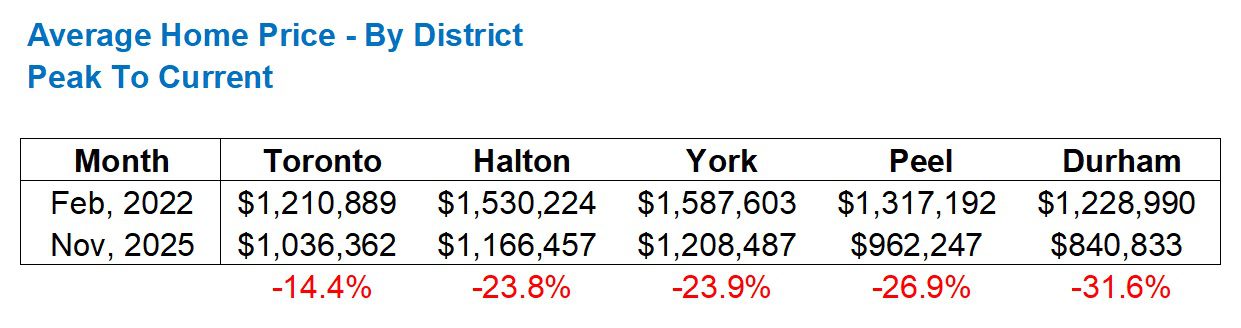
This is a period of 45 months.
Is the City of Toronto’s 14.4% decline over 45 months considered a “crash?”
No. I would call this a “correction” at best, but I might call it a “fluctuation” if we’re looking long-term, since it took place over almost five years.
But how about Durham’s 31.6% decline? Is that a “crash?”
Well, gee, I don’t want to contradict what I said earlier with respect to the elapsed time period, but I might suggest that this falls between a “crash” and a “correction.”
A 31.6% decline in 12 months?
Crash.
A 31.6% decline in 24 months?
Crash’ish.
But a 31.6% decline in 45 months?
I’m not sold.
Then again, if we consider where the market was before this happened, it might add some perspective.
Let’s look back two years, which takes us to right before the onset of the pandemic. We’ll then compare that to where prices went at the peak in February of 2022:
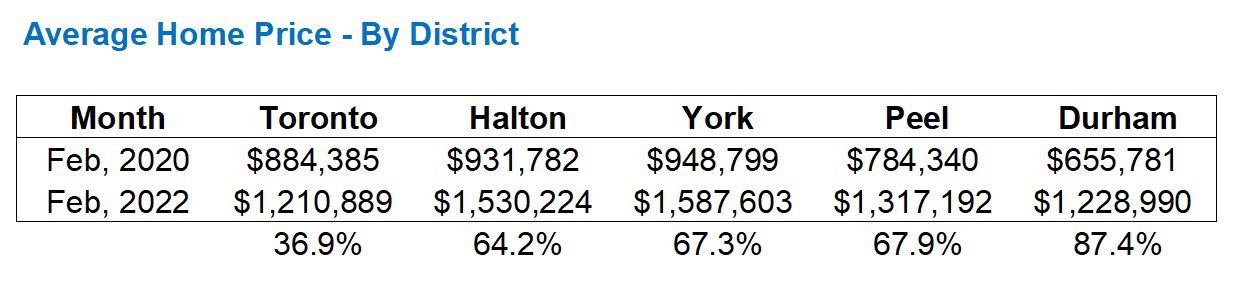
Doesn’t this all make sense?
These figures are like mirror images. The five districts are in the same order as they were in the previous chart.
The area that went up the most (Durham) has since come down the most, and vice versa, across the board.
So let me ask the million-dollar question here, and I would love an answer:
Does a decline of 31.6% in 45 months after an increase of 87.4% in 24 months represent a “crash”?
I think this is rhetorical, isn’t it?
One thing this is not would be called is a “market fluctuation.”
There’s nothing normal about an 87.4% increase in 24 months, and while you might want to argue that this was entirely due to “low interest rates,” I think the pandemic had a lot to do with it. We saw more people moving, and thus buying and selling, during the pandemic than ever before. The buying frenzy (due to low interest rates and a desire to move) drove people to the suburbs, where we saw ridiculous price growth in that two year period. I would also offer that the “keeping up with the Joneses” had a lot to do with it, as society has fallen into a herd mentality, especially when it comes to real estate.
Regardless, I don’t feel as though any of the data presented above speaks to an undeniable “crash.”
Then again, there’s one more aspect of the market, especially as it pertains to a crash or a correction, that we have yet to discuss:
Prices versus sales.
I’ve long lamented that the media seek to create their argument or narrative by choosing whichever statistic suits them. Prices might be flat, but if they want to create a narrative that “The market is in decline,” then they can report on sales. The reporting often lacks consistency from month-to-month.
But this does highlight the possibility of a moving target as it pertains to our definitions of correction, crash, and recovery, or at the very least, different ways of defining these events.
When we look at overall sales in the market, we could use this to describe a “crash.”
There were over 122,000 sales in 2021, which stands as a record.
But by 2025, we saw only 62,433.
Is that a crash?
Perhaps. I think you could easily argue that it is.
Then again, can you really start with an all-time high as your basis of comparison?
And wouldn’t you have to consider prices along with the sales data to really understand whether the market crashed or not?
If sales declined by 50% and prices only declined by 15%, this wouldn’t be considered a crash, right?
You don’t need to answer or even give the question thought. This is merely for illustrative purposes as I lead into what I do believe, unequivocally, represents a crash in our market.
In the world of new home sales, there’s no way of denying that a crash took place.
Specifically for new condo sales, irrespective of prices in the market, I think the following data fits the definition of a “crash” to a T:
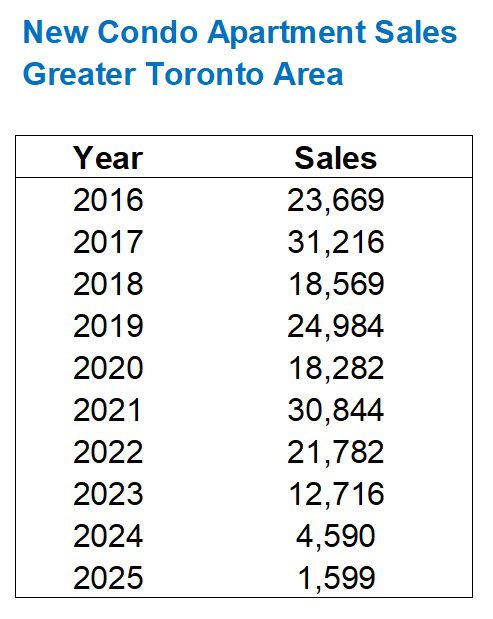
The pre-construction condominium market has “crashed.”
I don’t know that you can conclude any differently.
Now, let’s say, by some miracle, sales dropped to 1,599 in 2025, but prices were identical to those of 2021 and 2022, then we could, in this absurd hypothetical scenario, deny that the market “crashed.”
But that obviously didn’t happen.
In fact, pre-construction condominium prices in 2021-2022 were already 50% higher than comparable resale, so the crash in sales and prices has been spectacular.
But all this is to say that, when defining a market “correction” or “crash,” you might choose to look at prices, sales, or both.
I feel that to look only at prices is fair.
I feel that to look only at sales is not the same thing, unless the crash in sales completely obliterates the market, as it did with new condo sales. That market is non-existent right now, and conversations about how the market recovers are far more important than when. The crash was so spectacular that the underlying principles of the pre-construction condo market are being examined, notably the way in which condos were pre-sold at 50% premiums, with developers needing to meet sales thresholds before banks finance the actual development itself.
Maybe we’ve now honed in on a fourth little nugget as it pertains to corrections and crashes: legacy.
If and when the pre-construction condo market comes back to life, it might not resemble what we saw in the 2000’s.
That’s a topic for another day.
In fact, “market recoveries” is a topic for another day, as I’d like to tide the rest of this discussion over to Thursday.
See you then!


Anwar
at 11:21 am
The most famous market crash in history was the 1929 US stock market crash.
The DOW dropped 89% in three years.
That’s a crash!
And it took 25 years to recover.
Peter
at 3:02 pm
A crash in the stock market could be a smaller amount in shorter time period, ie. 10% in a single day.
A crash in the real estate market is a larger amount, but allowed over a longer time period, ie. 30% in two years.
How long the market takes to recover the lost ground also factors. The longer it takes to recover, the steeper and harder the crash in hindsight.
Derek
at 6:32 pm
Correction? Crash? It’s not even a blip when there are no more “quality listings” which went away in 2022 😝
Derek
at 2:07 pm
Is it really this complicated as to what we call it? What was the worst historical decline in Cdn. RE history from peak to trough? If “crash” is the best descriptor of such worst historical decline, then what was the decline and how long did it take to bottom and how long did it take to recover? How do we presently compare? Not as bad as the worst “crash” ever? Awesome blossom.
Marina
at 9:13 am
I think “crash”, “correction” and “dip” are a combination of magnitude, time, and what else is happening with the economy.
I’ve always differentiated between a crash and a correction based on feeling.
If you regret not selling in the last 6 months, but otherwise you are mostly ok, it’s a dip (short-term like 1-6 months), or a correction.
If you have to rearrange life plans and wish you still drank to cope, then it’s a crash.
Different David
at 12:09 pm
The difference between a market crash and a real estate crash is that with AI and automatic investment bots, a market crash can happen in a day or two as one event can cause a cascading chain reaction.
Bots are programmed “if X happens, do Y”…so if one sees a trend, they all jump on board. Stocks are immensely more liquid than real estate. There are natural speed bumps that allow rational thought to prevail.
So, short of a massive migration to a new planet, I don’t see demand for real estate crashing; more like a sustained slow decline where people who are holding out for a price finally have to accept a lower value (either due to downsizing, divorce, or financial need).