
I’ve been in the same fantasy football pool since 2002.
Almost a quarter-century, it’s crazy! And while most football pools see guys come and go, ours has been with the same guys since we started.
Actually, that’s not exactly true.
The first guy left in 2016 after he moved overseas and couldn’t keep up with football in a different time zone.
The second and third guys left in 2021 after a bit of internal discourse, which is natural after nineteen years!
Then a fourth guy left in 2022. Actually, he was the first replacement in 2016, but despite himself being a replacement, he decided to have somebody replace him…
When we started the league in 2002, the entrance fee was $50.00. That made sense at the time. Most of us were in university and some of the older guys were just starting their careers.
In 2005, we determined that $50.00 wasn’t enough, considering we spent hundreds of hours per week on this past time, so we raised the fee to $100.00.
Fast forward two decades.
Do you know what the pool fee is now?
$100.00.
Still.
And despite my clamouring to raise the fee to $500 or $1,000 many, many years ago, some of the guys just won’t agree.
My point?
Well, although I “founded” our football pool in 2002 and serve as the League Commissioner, it’s still a democracy. I can’t just unilaterally raise the pool fees.
However, when it comes to the TRG Prediction Game, I can do whatever I want!
Last year, I offered a $200 gift card to Tim Horton’s or Starbucks to the winner of our contest, which was posted on this blog on January 13th, 2024.
It was a blast!
I thoroughly enjoyed checking the ongoing tally and providing updates as the year went along, and I was delighted to see TRB reader and frequent commenter, Marina, win the prize in the end.
This year, I want to up the ante.
This year’s TRB Prediction Game will have a grand prize of $500.
That would be a lot of coffee. So why don’t we say it’s a $500 gift card to LCBO this year?
Ready to enter?
I love predictions.
As a child, I was always obsessed with the future, and then looking back at the past. So much so, in fact, that I used to write myself notes and leave them around the house to find.
“Hey Dave, it’s Dave. How many goals did you end up scoring by the end of the 1994-95 house league season? More than 20, I hope! -Dave”
Seriously.
I never said I wasn’t weird, and if you’re just figuring this out by now, then who’s the weird one?
I love the idea of a TRB Prediction Game! I only wish I had posted it sooner.
Nevertheless, I’m going to assume that January was just as busy for you as it was for me, so there’s no time like the present!
This year’s game is going to be very different, however.
Last year, the game was simple. It was only about interest rates, and there were only three questions:
1) What is the date of the first Bank of Canada interest rate cut?
2) How many basis points will that first cut be?
3) How many cumulative basis points will be cut by the end of 2025?
The first two questions were answered by June, but we had to consistently monitor the Bank of Canada through the end of 2025 and add up all the basis points, with each and every cut.
This year, the game needs to change. It can’t only be about interest rates.
Not only that, if we’re going to up the ante for the prize, we need to up the ante for the contest itself.
So this year, let’s do ten questions.
And let’s touch as many data points as we can:
-Prices
-Sales
-Inventory
-Absorption
-Bank of Canada
Shall we?
Any questions, let me know!
1) What will be the average home price for 2025? (point scored if guess is +/- 2%)
Very simple: are you bullish or bearish, and more importantly, by how much?
If the average home price is $1,200,000 in 2025, then you get a point so long as your guess is between $1,176,000 and $1,224,000.
I think a 2% range is reasonable, right?
If you’re smart, you’re not going to pick the price but rather think about the range, and then find the midpoint for your guess…
Here’s a brief refresher on the average home price over the last five years:
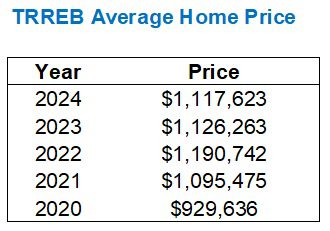
If these figures do not look familiar to you, it’s because I typically offer a breakdown by month. These yearly figures are part of TRREB’s Market Watch and are updated every January. You can find them HERE.
–
2) Which month of the year will represent the highest average home price? (point scored for correct month)
Also a simple enough question, right?
Pick a month. Any month.
I’m a big fan of this question, but that’s because I loved coming up with my “peak price” matrix, which I’ll show you here as a cheat sheet:
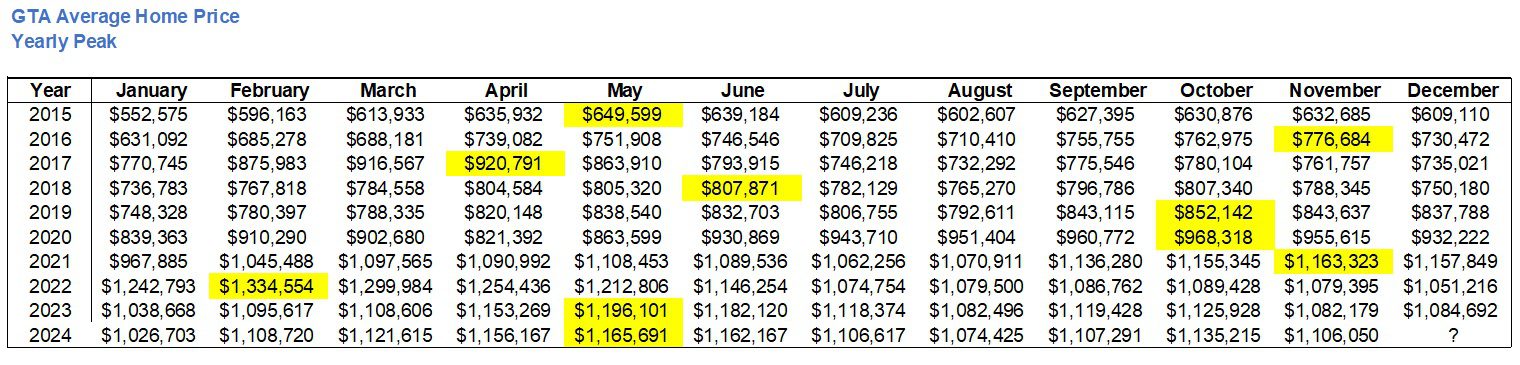
Ignore the question mark for December of 2024. Knowing that price wouldn’t help us at all.
Pick a month. Any month.
–
3) Will any individual month’s average home price top $1,200,000? (point scored for correct Y/N)
This is also simple. I mean, duh, it’s a yes/no.
Just consider how long it’s been since we saw an average home price over that figure.
Do you remember?
May of 2022.
In fact, I’ve basically been chasing the $1.2 Million figure ever since, asking the question of when we’ll top it once again.
A refresher:
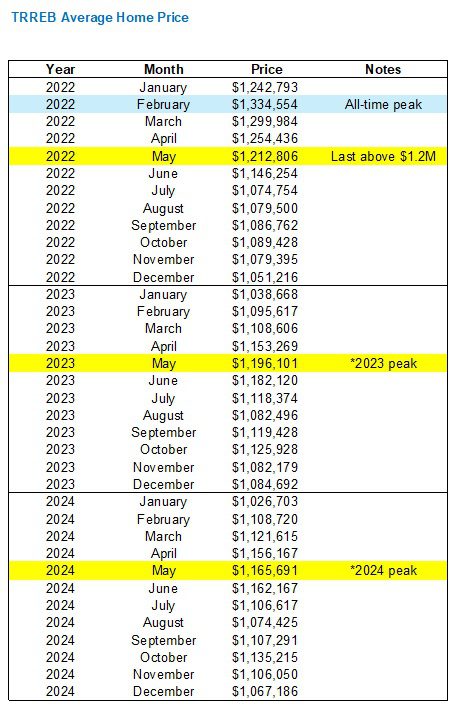
A simple “yes” or “no” is all that’s needed for Question #3.
–
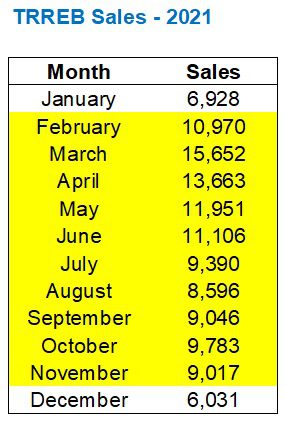
4) How many total sales will there be in 2025? (point scored if guess is +/- 4%)
We’re going to use a 5% band for this one since the volatility on sales has been significant over the last few years.
A refresher:
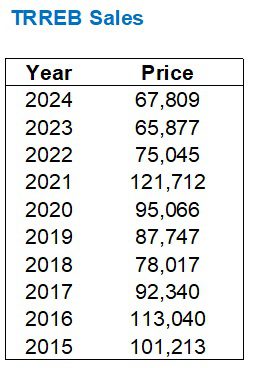
So if there are 80,000 sales in 2025, you get a point so long as your guess is between 76,800 and 83,200.
–
5) Which month of the year will represent the highest number of total sales? (point scored for correct month)
I’m not offering you a matrix for this one.
You’ll have to put your thinking cap on.
Are sales usually highest in the spring? Summer? Fall?
You decide…
–
6) Will any individual month of the year see more than 8,000 sales? (point scored for correct Y/N)
How many sales is 8,000 sales?
Is it a lot? A little?
Well, just consider the year 2001 for a moment…
In 2001, every month outside of those “bookends” in January and December saw over 8,000 sales.
So it’s common, right?
Um, maybe it was.
Consider the year 2024 for a moment…

Last year, not a single month saw over 8,000 sales.
In fact, we haven’t seen 8,000+ sales in a month since May of 2023, and in 2022, we only saw 8,000+ sales in February and March.
So will we see 8,000 sales in any month in 2025?
Y/N
–
7) How many total new listings will there be in 2025? (point scored if guess is +/- 5%).
If you have any idea how to answer this one, you’re a total nerd.
This question is the largest “shot in the dark” in our contest, but I wanted to include something about inventory levels.
Here’s a refresher form the past ten years:
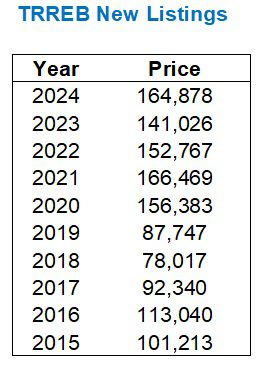
I’m keeping the range low at 5.0% because I feel that this is actually an easy one. But I won’t say why…
–
8) How many individual months will see more than 20,000 active listings (point scored for correct number)
A second question about inventory, if you please.
20,000 is the number, in my mind, that refers to a “lot” of active listings.
“New listings” are an important measure of the market. They refer to the overall inventory levels. But “active listings” refer to the number of properties on the market at month’s end, which speaks to the absorption rate. So rather than bore you with a question about the absorption rate, I’ll provide you with the following…
In 2024, May through November saw 20,000+ active listings. That’s seven straight months.
This used to be very common!
In 2004, there were eight straight months with 20,000+ active listings.
There were 9 straight months in 2005, 2006, and 2008.
But that changed significantly in recent years.
In fact, in 2023 there were zero months with 20,000+ active listings, let alone consecutive months.
Zero in 2022.
Zero in 2021.
Zero in 2020.
In fact, before we saw seven months in 2024 with 20,000+ active listings, you have to go all the way back to May of 2019.
So how many months in 2025 will see 20,000+ active listings?
Place your bets!
–
9) Will any individual month of the year see an average GTA condo price higher than the ‘peak’ price of $767,064 recorded in May of 2024? (point scored for correct Y/N)
Quite simple.
Do you have faith in the GTA condo market?
The ‘peak’ all-time price was $831,531 in March of 2022. Last year’s peak came in May at $767,064. The peak in 2022 was also in May and that was $784,914.
Will we see any individual month in 2025 with an average condo price above $767,064?
Y/N
–
10) What will the Bank of Canada policy rate be after the last announcement on December 10th, 2025?) (point scored for correct number)
Our trough was 0.25% during COVID.
Our peak was 5.00% into mid-2024.
We currently sit at 3.00% after the rate cut on January 29th.
What will the rate be at the end of 2025?
1.75%
2.00%
2.25%
2.50%
2.75%
3.00%
3.25%
Or if you’re really crazy, a figure that’s lower/higher than one posted above…
–
Alright, folks!
That’s a wrap.
While maybe some of you might find this overwhelming, I think many of you will prefer this to the simplicity of last year’s game.
Please post your answers in the comments section below and I’ll download and keep track throughout the year.
To avoid scrolling up/down when compiling, here’s something you can copy-and-paste to print or save to your desktop:
1) What will be the average home price for 2025? (point scored if guess is +/- 2%)
2) Which month of the year will represent the highest average home price? (point scored for correct month)
3) Will any individual month’s average home price top $1,200,000? (point scored for correct Y/N)
4) How many total sales will there be in 2025? (point scored if guess is +/- 5%)
5) Which month of the year will represent the highest number of total sales? (point scored for correct month)
6) Will any individual month of the year see more than 8,000 sales? (point scored for correct Y/N)
7) How many total new listings will there be in 2025? (point stored if guess is +/- 10%).
8) How many individual months will see more than 20,000 new listings (point scored for correct number)
9) Will any individual month of the year see an average GTA condo price higher than the ‘peak’ price of $767,064 recorded in May of 2024? (point scored for correct Y/N)
10) What will the Bank of Canada policy rate be after the last announcement on December 10th, 2025?) (point scored for correct number)
Happy Monday, folks! And an early ‘thanks’ for playing…


Different David
at 7:41 am
1) 1,141,000
2) October
3) Yes
4) 78,000
5) May
6) Yes
7) 155,000 (New listings including relists?)
8) 4
9) No
10) 2.25%
London Agent
at 8:48 am
Hey David, when are entries due?
Serge
at 9:02 am
Typo in the table in #7… should be “listings”, not “price”?
QUIETBARD
at 9:43 am
With the tariffs and counter-tariffs hitting some types of booze the net effect isn’t as pronounced as one may think. Also, what about the good folks who have been sober for many a years and those that just don’t drink. Should they not play?
Andrew
at 10:39 am
Wow what a kick in the nuts!
Kyle
at 9:50 am
1. $1,1500,00
2. October
3. Y
4. 75,000
5. October
6. N
7. 130,000
8. 2
9. N
10. 1.5%
Derek
at 10:50 am
1) $1,117,000
2) May
3) No
4) 67,000
5) May
6) No
7) 165,000
8) 7
9) No
10) 2.00
Anwar
at 11:40 am
Love this, thanks David!
1. $1,151,000
2. October
3. Yes
4. 80,000
5. October
6. Yes
7. 151,000
8. 6
9. No
10. 2.00%