

Were you a child of the 1980’s?
Did you take swimming lessons?
Does your heart skip a beat when you see………….
…………..THIS!

Yup, there it is, in all its glory.
Many of you have no idea what I’m talking about, and others are already calling your parents.
Starting in 1981, the Canadian Red Cross introduced a graduated program for water safety among youth, and we were awarded different colour badges for each level.
You all know how far you got in the program, don’t deny it.
I distinctly remember vying for my maroon badge (pictured above), and having failed the test, instead of giving me nothing – they gave met yet another red.
In 2019, of course, none of this would be possible. Every child is equal, they’re all winners, and to actually inform them of their successes and failures, even if it could save their life, wouldn’t meet the social agenda de jour. But I digress, as many of you do not welcome my old-man fist-shaking…
I’m proud to say that I got as high as maroon, which is the fourth rung on the ladder, and I think it basically meant I could jump in the pool and not drown. I never did get my blue, although it wasn’t for lack of effort.
Just because I know you’re all trying to picture the badge hierarchy in your mind, take a look at this:

Yellow, Orange, Red, Maroon, Blue, Green, Grey, White. Then came “Life Saving I,” and “Life Saving II,” and God knows what else, since I surely wasn’t a part of it.
So what does this have to do with Toronto real estate inventory levels?
Nothing.
I just took my “deep dive” analogy way, way too far…
Before the January TREB numbers came out, I predicted that sales would be down, and that the media would have a field day with that statistic. I also suggested that the true cause of a decline in sales would end up being much lower inventory.
As the readers pointed out last week, I was wrong.
And yet I can’t make sense of these numbers, because what I felt in the market was simply not reflected in the TREB stats.
January was one of the slowest months I have ever seen for new listings, plain and simple. I had the same conversation with every buyer-client, every couple of days, ending with something to the effect of, “I hope we see more new listings next week!”
I currently have over twenty active buyers, all of whom would buy tomorrow if the “right” property came onto the market. And yet having sold only two properties to buyers in January as a result of the lack of inventory, I’m trying to figure out why my clients and I saw such a lack of inventory, but the TREB numbers showed we were on par with last year.
So I decided to go back and look at the last eight years of data for January and see how this past January compared.
Have a look:
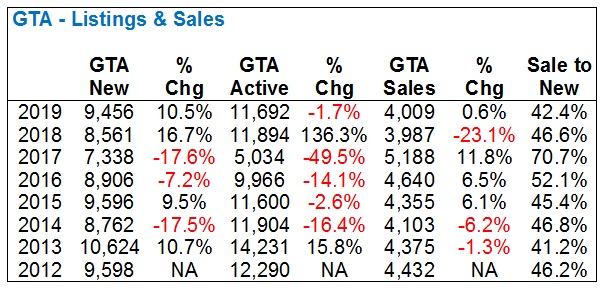
The first thing I notice here, as I’m sure all of you did, was that whopping 136.3% number in 2018. Well, that tells the entire story of the crazy spring-2017 real estate market, since listings were so scare. Just look at the active listings in January of 2017: 5,034, sandwiched between nearly 10,000 in 2016, and nearly 12,000 in 2018.
But that’s an aside, although one you’ll see more of as we go through the rest of the charts. Yes, there will be more charts.
Looking at how January compared to 2018, we see at 10.5% increase in new listings, and a 1.7% decrease in active listings. Since active listings are merely the listings left at the end of month, and new listings are truly the relevant real estate for most eager buyers, I tend to think that January of 2019, based on the numbers, gave us far more options than January of 2018.
But then we need to look at the ratio of sales-to-new-listings to see how quickly the market is gobbling up inventory, and even then, we see a decline from 46.6% in 2018 to 42.4% in 2019.
This simply doesn’t match what my buyers and I felt in the market.
So I decided to break things down even further.
Let’s look specifically at the 416, aka “City of Toronto” in TREB language, to see if the numbers tell us anything different:

So here we see an even higher proportion of new listings than in 2018, and an even higher proportion of active listings. Sales are down modestly, and the “sale-to-new-listings” ratio declined from 54.6% in 2018 to 45.2% in 2019.
That ratio is, however, slightly higher than the GTA-wide figure above; 45.2% to 42.4%. But is that enough to really suggest that the 416 is way hotter than the GTA, and/or the 905?
I’m not sure.
For that, we have to look at the 905 data:

The sale-to-new-listings ratio is only 41.0%, and in Toronto-416 it’s 45.2%, but that’s still not enough to suggest that the core is “way hotter” than the outskirts.
In the end, I’m left scratching my head, because it’s starting to look like the numbers do not match up with what my buyers and I felt in the market during January.
But let’s continue this look at the 905, just because we’re already here and it’s an informative exercise.
Shall we?
Breaking down the 905 and looking at regions (ignoring the smaller ones), we’ll see how things look in Halton, Peel, York, and Durham:

From what I can tell, this is somewhat consistent with the other areas.
The increase in new listings so far this year is proportionately higher, but comparing the modest drops in sale-to-new-listing ratios to the GTA and 905, we see the same trend. If anything, now the drop in 416-Toronto sale-to-new-listings looks like the outlier.
How about Peel?

Same story here. The sale-to-new-listings ratio drops 2%, which is in line with the 3% in Halton, and 1.7% in the 905.
And now I’m seeing another trend that shows Toronto-416 as the outlier: all these other areas saw an INCREASE in sales.
That’s right, Toronto-416 saw sales drop by 6.3%, and yet Halton saw sales increase 8.7%, Peel by 0.8%, and the overall 905 by 4.7%.
The trend continues in Durham:

The 8.1% increase in sales is in line with everything outside of Toronto-416, although the 6.3% drop in sales-to-new-listings ratio is closer to Toronto-416.
If you’re like me, you’re seeing that 235.3% number jump out at you. I know, it’s nuts. But that’s how tight inventory was in the spring of 2017, and thus why we saw such a run up in prices.
Last but not least, York Region, and there’s one stat here that really tells a different story. See if you can pick it out:

Do you see?
Yes, sales are down 1.0%, but that’s not what I’m talking about.
It’s the sales-to-new-listings ratio. It’s only 29.5%.
Now that is in line with the 29.9% from 2018, but it’s out of whack with the rest of our stats:
GTA – 42.4%
416 – 45.2%
905 – 41.0%
Halton – 43.4%
Peel – 52.2%
Durham – 43.0%
And then we have York Region at 29.5%
Conclusion: York Region has fallen off a cliff since 2017.
Sure, the 67.3% sale-to-new-listing ratio in 2017 was already much lower than Halton, Peel, and Durham (72.7%, 77.9%, 81.0%), so to see it drop down to 29.5% has to be taken in context. But having said that, Toronto-416 in 2017 was lower than York – 66.0%, and it’s only dropped to 45.2%.
So yes, York Region has fallen off a cliff.
It’s no surprise that the average sale and median sale prices are down 16.6% and 14.5% respectively since then, albeit on small sample sizes that can never be taken as entirely accurate. For reference, the Toronto-416 average sale and median sale prices are up 6.8% and 20.0% respectively in the same time period, so the median is off, the average is pretty close, and I think the bottom line is that York Region has been absolutely hammered in two years.
But going back to my original point, what do these numbers say about my “feel” for the market in January?
It says my feel was wrong.
At least according to the market statistics, it was wrong.
What I felt wasn’t wrong, and while that sounds like the introduction to a conversation about emotions, because I felt what I felt, dammit, it means that I can’t suggest that the rest of the buyer pool, and buyer agents, suffered from the same affliction.
I can give you examples galore.
Renovated 3-bed, 4-bath in Riverdale? No options.
$2.5M new-build in Leaside? Not happening.
$1M brick-and-beam hard-loft conversion in King West? Nope.
$1.3M semi-detached, 3-bed with parking and finished basement in Leslieville? Didn’t see it.
1-bed, 1-bath, $500K with low fees for an investor in King West? Nothing we liked, despite there being “tons” of inventory.
And on, and on, and on.
Every buyer, every price point, every location, every property type – we suffered from a lack of suitable options.
But you know what? This has been the story of our real estate market for as long as I can remember. Time-permitting, maybe we could divide all the new listings into categories for “quality” listings and “other.” Or with even more time, maybe I could lay down on the couch and talk to a bearded-man holding a clipboard and explain how picky I am with regards to Toronto real estate. But either way, January was slow for my buyers, but this was not reflected in the TREB stats.
So the market bears win.
January was busier than last year, and there’s more on the market.
The sale-to-list ratio has declined, and that means more inventory is “building up.”
I’m going to revisit the above charts at the end of February to see if the trend continues, but for now I’m still crossing my fingers for more inventory at the start of every week…


Francesca
at 8:54 am
David, the memories you brought back. As someone born in 1974 I can totally remember the swim badges and I too remember trying to collect them all. For the life of me though I can’t remember how many or far I got. BTW they do not pass every kid in swimming lessons nowadays as my daughter did fail a few times and had to repeat the same level twice before progressing but now all you get is some kind of report card. These swim badges remind of the brownie badges of the 80s too everyone I knew tried to collect.
As for your real estate analysis. Very interesting stats comparing the 416 to other areas in the 905. As someone who lives in York Region but follows the 416 closely I can totally confirm that what you said is true. Listings are totally down as nobody can sell! There have been too many terminated listings to count where I live and only people who absolutely have to sell are attempting to sell. Despite fewer listings to compete with each other, buyers still have the upper hand now in negotiating. To your point about not seeing the properties your clients are looking for in the 416, I guess this explains why the few that come on the market are still snatched quickly and often for over asking. Could it be that the stats you found combine both the more desirable properties but an increase in less desirable housing types or areas?
Jenny
at 10:00 am
There was always that one girl who’s mother sewed all of her swimming badges to her swimsuit. It was like sewing your Brownie or Girl Scout patches to your uniform. Except likely uncomfortable. And itchy.And you has to wear the same suit every time.
Jennifer
at 1:19 pm
I would agree on inventory despite the statistics. East of the DVP, there is just NOTHING out there, or at least nothing of quality. A lot of high priced junk/flips are, though, sitting around and for the life of me I cant figure out why, after a certain point in time, they dont realize that they are not getting what they “want”.
I question why though. Why the lack of inventory? Is it because there is nothing to buy so everyone stays put (see your post ‘do you buy before you sell’)? If so, how do you get out of the stalemate? Is the cost of moving too high (LTT, commission, other fees), so then better off renovating etc. or simply dealing with what you have? Are people not downsizing sooner because kids are living with them longer? What is it (I’m sure it’s many reasons) but more importantly what can get the market moving….
Professional Shanker
at 1:37 pm
Flippers (amateur ones) will try and hold out for as long as possible, selling at a loss will force them to come up with the cash to settle the mortgage, better off in their eyes currently to keep paying the monthly finance charge and hope for a turnaround – this is what is going on in York Region as evidenced by the stats.
Cost of moving in Toronto is ridiculous (including double land transfer) someone is in for roughly 9% of the properties cost.
Appraiser
at 3:37 pm
Your first paragraph is pure conjecture.
Any data to back up yet another empty theory?
Professional Shanker
at 6:44 pm
My 1st paragraph is one of the many reasons as to why sales are slow in the north. It obviously isn’t the primary reason but it does factor in.
Literally go on House Sigma or another public app and look through detached houses sales and listings in the 905, the evidence is there for one to see if you want to spend the time. If you don’t believe me, spend 1 hour doing it. Alternatively, talk to relator who does business in the North 905.
Over the past 1.5 years I have come across 100s of flips gone wrong in the north which have either sold or are still sitting, there are literally too many to list.
If you choose to bury your head in the sand as to what is going on north of Toronto you can.
Toronto core is alive and well from what I can deduce right now.
Appraiser
at 6:57 pm
100’s of flips???
So no data. Just pretend anecdotes. Got it.
Amateur.
Chris
at 7:50 pm
Some recent examples of flips gone bad/homes that failed to close/lost value/etc. in York Region:
https://pbs.twimg.com/media/DxPQJ2tU8AAWr15.jpg:large
https://pbs.twimg.com/media/DxYJ_CnV4AAjhJq.jpg:large
https://pbs.twimg.com/media/Dxkm2YJX4AAZX97.jpg:large
https://pbs.twimg.com/media/DyWeAP6UcAAUNWF.jpg:large
https://pbs.twimg.com/media/DyveR5sVAAMeoaU.jpg:large
https://pbs.twimg.com/media/DzKI4SkUwAAhs6t.jpg:large
https://pbs.twimg.com/media/DyvejP8VYAAgOSR.jpg:large
As Shanker said, peruse Housesigma and you’ll come across more examples fairly quickly.
Professional Shanker
at 8:32 pm
As much as I would love to list the 100s flips, I just don’t have the time right now.
Now if I actually thought you would look at any one of them I would compile them for you when I have time, but we both know you are too stubborn to look at them and don’t actually want to look at something which doesn’t support your opinion.
Quick search of Aurora – new listing in the past 6 days
6 Wilkinson – Purchased in Dec 2016, never was lived in, no reno’s, tried to resell in 2017 and has been sitting since. Carrying charges on a $1.8m purchase can’t be cheap!
47 Timpson – Purchased Apr 2016, never was lived in, no reno’s, trying to resell since late 2018. They will hopefully break even, probably not.
46 Tyler – Purchased in Nov 2016, never was lived in, no reno’s, tried to lease it, been trying to sell ever since, still on the market, loss being deferred, similar to 6 Wilkinson.
51 Lensmith – Purchased in May 2016, some reno’s, back on the market early 2019 – under 3 years ownership, Won’t break even after transactions costs.
So within 5 minutes of searching 1 community in the north GTA and I can find 4 homes which weren’t purchased to live in and have been re-listed/listed within the past 5 days! Usually R Hill and Markham are more bang for your buck entertainment. Lately non-prime 416 has been surprisingly interesting.
Chris
at 7:47 pm
Appraiser, I don’t really understand what data you’re asking Shanker for here.
David already included relevant stats in this blog post, explaining that the Sales to New Listing ratio in York has declined to 29.5%; in his words “York Region has fallen off a cliff.” 12-month trend MOI in the region is 4.7 as of January, from TREB’s latest market watch.
Was there some other data you were hoping to see?
As to flipper’s holding out, well yes, obviously Shanker is hypothesizing as to what has caused York region’s market to cool so dramatically. No stats are going to be able to tell you definitively why that area is experiencing its current predicament.
As we’ve discussed before, John Pasalis’ research identified more investor activity in York region than other areas. While this didn’t measure flipping activity (he measured homes purchased and then listed for rent on MLS), it’s not exactly a stretch to think the two would occur in similar areas.
I’ll dig up some examples such as those Shanker was alluding to. There will be a few links, so David will likely need to approve the post, so forgive the delay.
Appraiser
at 11:48 am
Pretending to know what you don’t know, is pure conjecture. Which bears seem to feast on; besides old memes, tropes, and empty theories…lots and lots of theories.
Professional Shanker
at 12:37 pm
Of course it is conjecture – the question becomes how far fetched it is.
It is not pretending when you can provide concrete examples to support a theory. The theory above is based on a specific location (North GTA) I am very familiar with. I am most certainly not proclaiming that amateur flippers are holding 100s of properties in Toronto core with an under water mortgage because anyone who would follow this blog/GTA RE knows that isn’t true. North GTA – different story!
Further, David attempts to support his case for the bull side based on conjecture. He is using incomplete information to form an opinion on where the market is going. Are his theories empty and is his opinion pure conjecture? Is your opinion pure conjecture, if not, why?
Christopher
at 12:55 pm
North York is also full of examples for properties bought In early 2017 that were attempted to be sold unsuccessfully in 2018. There are also countless examples of detached homes being listed multiple times at peak 2017ish prices with no buyers.
Chris
at 12:58 pm
Appraiser, we’ve already discussed this. Shanker is providing their hypothesis as to what is causing the decline in York region. The data has already been provided to show the cooling of that market. At this point, it is a debate of opinions as to the “why”.
And as Shanker correctly points out, lots of people here, including David, share their theories, anecdotes, and conjecture.
I fail to see what point you’re trying to make in your posts. The relevant data is in the blog post and TREB’s Market Watch, yet you ask for more. An opinion is presented, with supporting anecdotes, as is often the case on this blog, yet you deride its sharing. Do you actually have anything of substance to add? Or are you simply trolling this forum yet again, in an effort to scorn anyone with a pessimistic outlook on Toronto real estate?
Clifford
at 11:43 pm
I will never understand how people are OK paying double land transfer tax. It was OK I guess when prices were lower, but prices are sky high now which makes LTT even higher. It is robbery IMO.
Jennifer
at 12:12 pm
Completely. I dont think people are ok, they are just complacent. Even the City is complaining that they are short on LTT revenues! Serves them right for relying on such a silly tax (completely untied to someone using more city services) to line their coffers.
Plus 5% commission. That should come down as prices go up. It’s astronomical.
Condodweller
at 1:01 pm
I don’t think people are ok with it and I don’t think they are complacent either. I think it’s just that people can’t really do anything about it and since they don’t transact frequently they just grumble about it and move on.
Unfortunately, both LTT and commissions are a fixed percentage, which means the higher the price the higher the fees.
To be fair, when the government implemented the graduated LTT, house prices were much lower, and I don’t know if even they projected prices to get this high. Houses over $400k were considered luxury. Who would have predicted that one couldn’t buy a one bedroom condo for that price down the road?
Of course, once the government secures a source of income, they are not likely to give it up once they become dependent on it.
Chris
at 1:17 pm
LTT/Stamp Duties are notoriously inefficient.
“The problem is that a wedge between what buyers pay and what sellers receive slows the pace at which properties change hands. By one estimate for cheaper houses, a 1% increase in stamp duty reduces annual churn in property ownership by 3.5%. When fewer moves mean fewer job switches, the labour market becomes less efficient. Productivity growth may slow. Thankfully, transaction taxes tend to bite hardest only for expensive homes. But gumming up the top of the housing market has knock-on effects. Those who would occupy mansions stay in cheaper homes instead.
The taxes also discourage downsizing, a particularly unwelcome effect in ageing societies. More than two-fifths of British housing equity is owned by over-65s, many of whom are sitting on large, empty nests. More than a third of Britain’s owner-occupied houses have two or more spare bedrooms. People are entitled to hold on to their houses if they wish. But the tax system should not encourage them to do so—especially when high prices have left many families wanting more space.”
– The Case for Scrapping Stamp Duty, The Economist, Nov. 2018
Condodweller
at 2:16 pm
@Chris. I’m sure all that is true. See my other comment about governments giving up a reliable source of income. Unfortunately, if they were to give us a break on LTT they would find a replacement somewhere else where we would have no choice but to pay the higher tax.
At least with RE we have some control, i.e. not move.
Chris
at 1:24 pm
David, good analysis. I give you a lot of credit for the thorough examination of your claim, and admitting that it may have missed the mark.
However, I do think you’re being a bit hard on yourself here. You said there was a lack of inventory. And while active listings and MOI may be up when compared to 2017 and 2018, in the City of Toronto, they remain quite low.
So I don’t think you were completely wrong.
Professional Shanker
at 8:43 pm
I second that, inventory is still relatively low in Toronto, not surprising if your clients couldn’t find what they are looking for, spring market is right around the corner.
Clifford
at 11:46 pm
I’ve been looking to buy myself and frankly don’t see too many quality properties out there for the money. Too many sellers looking for 2017 pricing and not budging. They need a reality check. So I sit and I wait for something good to come up. I imagine I’m not the only one doing this.
Jennifer
at 12:07 pm
100% agree. You are not.
Alexander
at 7:42 pm
Why would they is there is no inventory? I sold mine with discount in Aurora because of the high existing inventory and painfully slow moving one as well. Buyers were circling but not pulling the trigger, which is annoying as those prices were way below 2017. Everyone wants a bargain.
Condodweller
at 12:52 pm
It’s normal for sellers to be wanting 2017 prices and perfectly normal for buyers to be expecting lower prices given the break in price increases as FOMO impetus stalls. Now it’s a waiting game and prices will depend on who can wait longer.
Unless higher rates force people to sell they are not likely to sell given the high transactional costs. It looks like you may be waiting for a while and even if the right house does come up, it will probably attract multiple offers which means you are not likely to get the discount you are hoping for.
It seems to me the only way to get a bargain in this market is to pick up something undesirable for reasonably cheap and fix it, and hope the cost of the fix is less than the discount.
Chris
at 1:12 pm
I agree with you, to an extent; it does seem to be a waiting game, but I don’t necessarily believe that only higher rates will force people to sell.
Lets say there are a number of comparable homes for sale in a region. Many sellers may be able and willing to hold out, hoping for a return of Spring 2017 prices. However, if even a few sellers are compelled to sell (death, divorce, illness, debt-burden, etc. etc.), and thus forced to accept a lower price in order to secure a buyer, this drags down the comparable price.
Thus, prices can decline, even as many sellers refuse to budge. Higher rates would exacerbate this, but aren’t the only route to this outcome.
Condodweller
at 1:57 pm
I didn’t say rates were the only reason. I just used it as an example since I feel it’s one of the most likely one. My point wasn’t to identify possible reasons for a price decline so feel free to substitute one of your reasons into my sentence to replace rising rates.
Chris
at 3:22 pm
Ah, fair enough.
I’ve heard the argument put forward by others, that sellers don’t need to sell, so they won’t, and prices won’t decline. I don’t think that’s entirely true, and thought that’s what you were alluding to.
My mistake!
Clifford
at 1:22 pm
“Unless higher rates force people to sell they are not likely to sell given the high transactional costs. It looks like you may be waiting for a while and even if the right house does come up, it will probably attract multiple offers which means you are not likely to get the discount you are hoping for.”
And that is the key reason why prices continue to rise. I’m not even waiting for a bargain. Just waiting for a reasonable price.
Condodweller
at 2:12 pm
Reasonable price is a matter of perspective and personal opinion. Even though prices are taking a breather I still don’t find them reasonable.
Drivers for higher prices has been debated ad nauseam, but for me, the current prices are still too high for what you get for it.
I was recently in the car market and when I considered all vehicles on my short list, there was one I really like but had never driven. After test driving it and comparing it to the others I was very disappointed by the price/value ratio and ended up going with something else.
I feel the same way about house prices. If I were a first-time buyer I would look at alternative strategies that would sway the price/value ratio in my favour. This is just my personal opinion of course and I am not looking to change anyone’s mind.
I think I have exceeded my quota for comments on a single blogpost….
Condodweller
at 12:40 pm
I know someone who bought first and sold after in the 905 area in 2017. They literally sold during the last days of the peak. I can’t believe how lucky they were.
Given how people went further out of the city to stretch their buck which caused the increases, it is only logical for the reverse to be happening. I do wonder if this is foreshadowing prices in the 416 and eventually in the core.
Clifford
at 2:41 pm
It’s not just the one LTT, it’s LTTx2 which is ridiculous however yo slice it.
Appraiser
at 6:45 pm
“Reminder TORONTO Census Metropolitan Area (CMA) population more than DOUBLED during the 45 years between 1971 and 2016…and our pace-of-growth is INCREASING.”
1971 = 2,699,927
2016 = 5,928,040
https://twitter.com/HousingNowTO
Chris
at 7:48 pm
Reminder PHOENIX Metropolitan Area population more than QUADRUPLED during the 47 years between 1970 and 2017…and it is one of the FASTEST growing metropolitan areas in the UNITED STATES OF AMERICA.
1970 = 1,039,807
2017 = 4,737,270
Anyone else have some interesting demography tidbits they’d like to randomly share?
Jimbo
at 10:03 pm
I blame air conditioning…..
Jimbo
at 7:58 pm
I would read the note on how they came to their 1971 population…..
Kyle
at 5:04 pm
The weather, so far this year has been absolutely terrible. This affects both number of new listings and number of sales. I suspect better weather will improve both.