

Maybe my fingers just go so much exercise from the data collected in Monday and Wednesday’s blog post that I figured I’d sit down and do it all over.
Or maybe I think the readers are tired of “stories from the trenches,” and want more concrete data.
Either way, I got a kick out of the data in this post, and I hope you do as well.
I’ve heard equal amounts of “The market is cooling” this month, as well as, “The market is still hot.” They can’t both be correct, can they?
Newspaper columns this week have been about the “sputtering market,” and some of my clients are starting to wonder if the market is changing.
I could argue it both ways.
On Tuesday night, I sold a house to a buyer 20% over the list price, among six offers, and then lost with another buyer when we saw a competing bid go to 14% over the list price, among only three offers.
And yet I’ve received two email blasts from listing agents today alone detailing price reductions.
I don’t believe we’re in a “balanced market” to be honest, but the market for freehold homes, in my opinion, has slowed down over the past month.
What I wanted to know was: are we still holding back offers on freehold?
So I went into MLS on Thursday night, and pulled all the sales in E01, E02, and E03 in November.
Would you believe there are exactly 100? That saves us from having to calculate percentages, right?
So let’s go through a series of questions to lay out the data.
1) What percentage of sales were for houses with a “holdback” on offers?
Exactly 50%.
Of the 100 homes, fifty of them had a “holdback” on offers, although to be fair, a few of them could have had an offer date initially, and that offer date passed without a sale. Then the listing agent removes the “Offers Reviewed On…” verbiage in the listing, and it sits, then sells, and isn’t counted.
But how many sales could that represent?
We go with the data we have.
2) Of the 50 sales, how many were via bully offer?
12%.
Six out of fifty.
And to gather this data, and make sure it was accurate, I went through every listing either looking for “PLEASE NOTE OFFER DATE CHANGED” or “PRE EMPTIVE OFFER REGISTERED,” and, I cross-referenced the noted “offer dates” in the listings with the sale dates posted.
One of these bully offers was a well-known listing agent submitting a bully offer on her own listing. Imagine that? There are people out there that don’t believe in “multiple representation,” either in competition, or at all, and yet one agent out there has the gall to bully her own listing.
3) How did the bully offer prices compare to the rest?
The average sale-to-list ratio for the 6 bully offer sales was 115%.
The average sale-to-list ratio for the other 44 sales was 114%.
4) Was there a pattern among the houses bullied?
Not really. But perhaps we could try to find one.
Five of the six properties sold via bully were priced under $1,000,000: $729,000, $739,000, $799,900, $889,900, $948,000, and $1,079,000.
That’s an average list price of $864,133. The overall average list price for the fifty properties that sold with a “holdback” on offers was $930,180.
I don’t think there’s any pattern here, and let’s not forget, many sellers get bully offers and decide not to sell.
5) What was the average sale price for the houses with no offer date?
99%.
Does that make any sense to you? 99%?
Something seems off there, so that leads to my next question…
6) Did any of the houses without offer dates sell over list?
Yes!
Wild, right?
24%.
12/50 houses that did not have an “Offer Date” specified on the listing ended up selling over the list price.
Some houses had “offers any time” but sold in over the list price. A couple of properties sold over the list price a week after the property was listed.
One house sold for 127% of list, without a specified offer date.
So consider that a couple of these listings might have been strategic in nature, ie. list the property with “offers any time” but create a mad dash in the first 12 hours and still expect multiple offers.
7) What was the difference in timing for those listings with/without holdbacks?
The average days on market for properties with a holdback was 6.8 days.
The average days on market for properties without a holdback was 18.9 days.
8) What was the difference in average list price? Any inferences to be drawn with regards to strategy?
Absolutely!
The average list price for houses with a holdback on offers was $930,180.
The average list price for houses without a holdback was $1,202,276.
On the whole, the more expensive houses aren’t holding back offers.
The top seven houses in terms of list price all did not have offer dates.
There were two expensive houses with offer dates: $1,895,000 and $1,829,000, which sold for $2,220,000 and $1,950,000 respectively.
65 houses were listed under $1,000,00, and 46 of those had a holdback on offers – 70.1%.
35 houses were listed over $1,000,000, and 8 of those had a holdback on offers – 22.9%.
Only 2 of the 12 houses listed for over $1,500,000 had a holdback on offers, and those are the two mentioned above.
9) Was there any difference in listing strategy by house type?
55 houses were detached, and 18 had offer dates – 32.7%.
45 houses were semi-detached, or row, and 32 had offer dates – 71.1%.
There might be some redundancy here with point #8, since a lot of cheaper houses are semi-detached or row-houses, and a lot of expensive houses are detached, but combine the two points, and you really see how the market is moving right now.
10 Any difference between E01, E02, and E03 themselves?
There were 28 sales in E01, and 19 had holdbacks on offers – 67.9%.
There were 34 sales in E02, and 18 had holdbacks on offers – 52.9%.
There were 38 sales in E03, and 13 had holdbacks on offers – 34.2%.
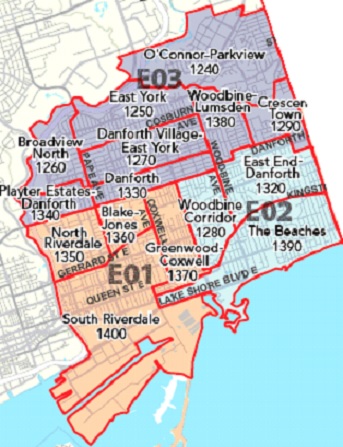
Here’s a refresher of the locations, for those that haven’t memorized this yet:
The average list price in these three areas is as follows:
E01 – $934,681
E02 – $1,244,209
E03 – $1,003,911
So unlike in points #8 and #9, which would lead us to believe that list price has the greatest effect on whether or not a seller and/or listing agent undertake the “holdback on offers” strategy, this shows us that a lot of the decision rests on location.
But could the specific location within E03 tell us something else?
Let’s look at E03 in whole, and the number of properties with holdbacks on offers, versus the number of total sales:
Broadview North: 1/1
Crescent Town: 1/2
Danforth: 3/4
Danforth Village-East York: 3/11
East York: 1/6
O’Connor Parkview: 2/7
Playter Estates-Danforth: 2/3
Woodbine-Lumsden: 0/4
There are no real outliers here, save for the 3/4 in Danforth – Pape, Monarch Park, Strathmore, and a second on Strathmore. Those are hot streets, and this remains a hot pocket.
Extend this further west, and join up with Playter Estates-Danforth, and 5/7 of the sales had holdbacks on offers. Here, we’re adding Cambridge, Cruikshank, and Browning.
Now subtract these from the lot, and only 8 out of 31, or 25% had holdbacks on offers.
–
The sample size is low here, so there are no absolutes.
But I think with 50/100 listings in E01, E02, and E03 having holdbacks on offers, you can really hone in on where the hot and cold pockets are.
Take out all of E03, save for those two areas along the Danforth (Playter Estates-Danforth and Danforth), and we’ve got 42 of 69 properties with holdbacks, or 60.9%.
And of the properties that did not hold back offers, a small percentage are likely re-lists at higher prices, from previous listings where a holdback on offers was present. I just don’t have the time to go through them all! 🙂
On the whole, I’d say these numbers are in line with what I’m seeing out there. Specifically the figure showing that 70.1% of houses under $1,000,000 have a holdback on offers.
I won’t make any predictions regarding prices over the next month, but I do expect that the market will continue to be busy.


Jan
at 8:37 am
David, your east-side bias is showing!
Lurker
at 9:49 am
I just want to know who the agent was that bullied her own listing….
Condodweller
at 10:57 am
As long as the buyer is smart there is nothing wrong with this as long as the buyer is controlling the offer amount based on comps supplied by the agent. Having said that I’m sure there have been a few people fleeced by a double ending agent. I can see people going with the listing agent in hopes of (or on a promise of) getting an advantage to supply the highest and winning bid. If you are dealing with an unethical agent who discloses the highest bid so you can beat it I would make that agent show me the highest offer prove it if it’s significantly above actual value. I mean, if he/she is unethical already, actually showing me the offer is not that much of a stretch is it?
Paully
at 11:35 am
Since you often seem to be looking for interesting ways to parse all of the data, how about looking at properties that have sold multiple times in recent history? Sold deals that failed to close and were then resold some time later and places that were sold and then resold relatively quickly possibly indicating a reno/flip. Those might give you some interesting insight, while eliminating sales-mix-variation from pricing.
Katie
at 3:45 pm
A request please and thanks: can you repeat this for the west end? Oh what a fantastic Monday blog this would make! Roncesvalles, High Park, Bloor West. I don’t want to make you work on a weekend but I’m sure you’re working regardless! Early thanks due!
steve
at 9:08 pm
Somebody please help me understand what I am seeing on realtor.ca when I go there and see plenty of properties lingering for literally months. I tried this experiment beginning at the start of the year, mainly focusing on C1 and W1 (west side). Are sales that slow, or is mls slow to update it’s data?