

Slow start to the fall market, eh?
I mean, only 148 new listings in C01 and C08 on Tuesday?
For reference, anything above 80 is what I would call “busy.” Anything over 100 is what I would call “near peak market conditions.”
But 148? And on first day back after summer?
I’d say the market is doing exactly what I had expected it to do!
Every summer, my active buyer clients lament the presence of choice. If you were a buyer on a reality television show who was tasked with moving to Savannah, Georgia and finding a suitable home to purchase, you’d look at exactly three homes, complain about a number of trivial items in each property, then simply choose one and buy it.
But here in Toronto, you’d be naive to think that you’ll routinely be able to head out on a pleasant Saturday afternoon, mocha frappucino’s in hand, and take a stroll through three, four, or five properties that meet your criteria.
During some slower periods of the year, you might get one suitable listing per week. Depending on your desired location, price point, and housing criteria, you might get one suitable listing per year!
I’ve had clients who passively looked for a year or more. “When the right house comes up, we’ll be players,” these clients might tell me.
Whether you’re looking for something insanely specific and ready to wait a year or more, or whether you’re simply looking for a 3-bedroom semi-detached in Bloor West Village, you’re not going to get as many options as you’d like.
One thing that has never been said to me in my entire career: “I’m overwhelmed with the choice we have in this market!”
This past summer seemed to be one of the most barren markets in which I’ve ever worked.
No matter the price point, location, or property type, my clients all lamented, “When are we going to see more inventory?”
The fact that the word “inventory” is used so commonly by laymen and women is a sign of the times. And I’ve honestly lost track of how many times this past summer I was asked about whether inventory generally rises this fall.
It’s like every would-be summer buyer is just waiting for fall. Why? Because it simply must be better, right?
In Tuesday’s blog post, we looked at three burning questions:
1) How will the federal election shape the future of the housing market?
2) What is going to happen with the condo market?
3) What will happen with overall “housing affordability?”
In my mind, those were the questions that I would like answered more than anything else.
But there’s a larger question, and a larger problem, both of which tie into all three of those topics above, and that’s with respect to inventory.
I’m beyond beating a dead horse here; I’m basically about to crawl inside the carcass and take a nap. But everything in our market, good and bad, short-term and long-term, freehold and condo, comes back to inventory. Every problem and every solution has to do with inventory.
So how did August look in this regard?

We saw the fewest new listings in more than a decade.
New listings were down almost 43% since the same period last year.
For a market where every participant and onlooker is crying foul of rising prices, the problem is easy to identify, is it not?
No, the problem isn’t that citizens of this country aren’t taxed enough.
The problem isn’t investors or speculators.
The problem isn’t that foreign buyers are running amuck.
The problem is that not enough people want to sell their homes.
And while the “solution” offered for the last decade has been to reduce demand, the attempts made have been wildly unsuccessful.
How do you get more properties for sale on the open market? Well, golly gee, just ask the candidates for the PMO’s office since they all seem to have solutions!
With an average of 12,186 new listings in August every year, this August saw a figure that checked in 13% below average. You might think that 13% is insignificant, but that’s on a relative basis. If you consider this on an absolute basis, that’s a lot fewer properties for sale and that’s going to be felt by everybody in the market!
When it comes to active listings, the figures are even bleaker. In fact, it makes the 13% reduction in new listings actually feel like a rounding error:

That’s not a typo.
8,201 active listings by the end of August, compared to 16,662 in 2020, or 15,870 in 2019, or even 17,864 in 2018!
As much as we want to say, “The summer of 2020 was an outlier,” that holds no weight if 2017, 2018, and 2019 were all in the same range.
Those 8,201 active listings in August aren’t just the fewest since 2007 according to this chart; they’re the fewest ever in TRREB’s recorded history.
With an average of 16,893 active listings in August over the past fifteen years, I shouldn’t have to tell you how seeing 8,201 this past month speaks volumes about inventory problems in our market.
Now, what of sales?
Let’s take a look:
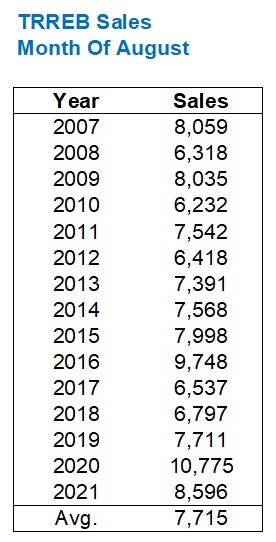
Ah, okay, so sales were only 8,596 this past month?
No big deal, right? A 19.9% drop from 2020?
Sure, but the 10,775 sales recorded in August of 2020 were an all-time record, and the average number of sales in the past fifteen years is 7,715.
So then, sales in August of 2021 were 11.4% above average, and new listings were nearly 13% below average.
What does this do for the absorption rate?
Oh, alas, it does this:
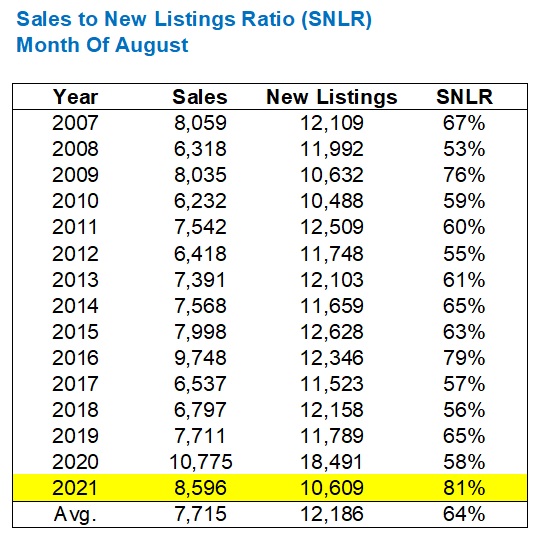
Yeah, that’s just an all-time high SNLR in the month of August, no biggie.
Just 81%.
Just 23% higher than last August.
Just 17% higher than the average over the last fifteen years.
Now, if you want some semblance of good news, it comes with the fact that the SNLR always dips from August to September.
Here’s a look at SNLR in August compared to September and the respective percentage change:
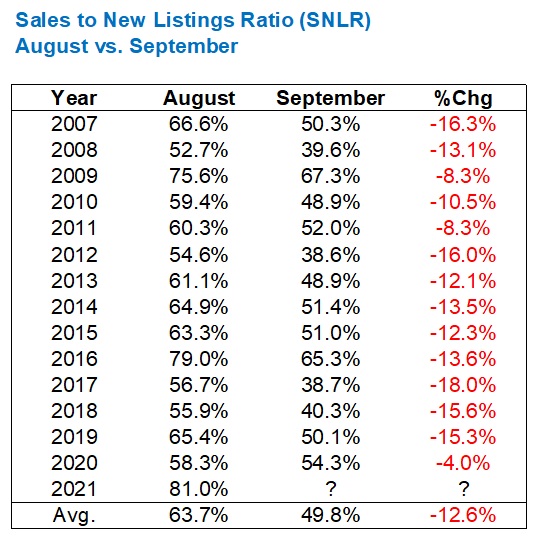
On average, we see a drop of 12.6%.
So if we take the 81% SNLR in August and reduce it by 12.6%, we end up with an SNLR in September of 68.4%, which would still be an all-time high.
Yikes!
But what if we follow 2020 and only see a drop of 4.0%?
Then we’re looking at an SNLR of 77.0%, with the next-highest figure back in 2009 at 67.3%, and after that, the 65.3% recorded in 2016.
Any way you look at this, the summer market was so tight that it’s going to be impossible to avoid similar conditions this fall.
Yes, the market exploded with inventory on Tuesday and Wednesday, but it’s still not enough.
And this is merely following the same path that we’ve been on through the first eight months of 2020.
Just for “fun,” if you can call it that, I want to look at the activity to date.
When it comes to sales, 2021 has been absolutely ridiculous:
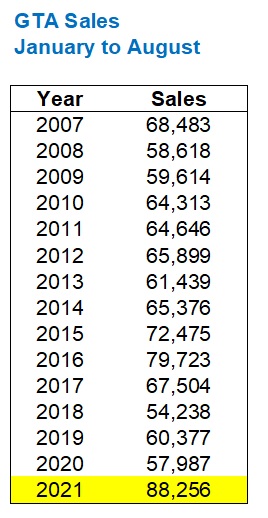
We’ve seen 88,256 sales from January 1st through August 31st, which blows even the red-hot 2016 and 2017 period out of the water.
“88,256” has no business being in that data set above. It’s the answer your child would shout aloud if he or she was playing Sesame Street’s famous game, “one of these things is not like the others.”
When we put together the sales thus far in 2021 with the inventory and look at accumulated SNLR, we find the following:

The 70.0% SNLR thus far is second to 2016, but it’s still leagues ahead of the rest, as well as the paltry 58.1% average.
Last but not least, I just wanted to take the ratio of new listings to active listings.
This isn’t a metric that’s commonly used, if at all. I think I just made this up.
But when looking for outliers, sometimes more data points are helpful:

Right.
I’d say that’s a scary figure if you’re hoping that the market tapers off this fall and you can finally afford your dream home, wouldn’t you say?
It’s almost a bigger blight than that those 88,256 new listings accumulated year-to-date, only that’s a real figure and this 157.8% ratio is somewhat made-up.
But it underscores just how little supply there is in the city compared to the demand!
Inventory is being absorbed at record rates, and even if we see a surge in new listings, it seems as though the surge in demand is higher.
So then, if there are any market bears left out there, I’d love to hear from you today. Specifically, your thoughts, after viewing this data, on how and why the Toronto market will not only stop appreciating but actually decline…


Appraiser
at 9:20 am
Excellent analysis David.
In case anyone is hoping that this cycle will end anytime soon, here’s something else to chew on for the bears (if they exist).
The youngest of the baby-boomers is around 55 years of age. If the average age of “retirement” is 65, we can look forward to at least another decade of the boomers continuing to help their children and grandchildren buy real estate, as the greatest wealth transfer in history gradually concludes.
Ed
at 12:40 pm
It’s strange that C01 and C08 have an abundance of new listings but when I look at Etobicoke ‘houses’ for sale I see almost nothing. Is it because the C01 and C08 listings are mostly condos?
Jennifer
at 12:44 pm
the main problem with “inventory”, to me, is that it is too expensive to move. Double LTT (i.e., 4% if not more on higher end homes) and the commission (5% on just your average Toronto home price is A LOT) is a lot of money to come up with (easily over $100K). So people stay put, spend the money on renovations instead, and contribute to grid lock.
Sean
at 3:06 pm
Moving expenses have increased drastically with housing prices. I moved up from a 750k townhome to 1.1 million detached May 2021. My realtor fees were $30,000, laywer $3,000 and land transfer taxes $18,000. Over $50,000 total out of pocket to move. Realtor commisions and LTTs have become very expensive, where as lawyers have stayed relatively the same like most Canadian wages. Thoughts?
Sirgruper
at 12:18 am
Lawyers can’t agree on anything including pricing so the fees are very competitive in residential real estate.
Appraiser
at 9:15 am
@ Sirgruper. Agreed. Legal fees for residential real estate are almost a joke, they’re so cheap. One of my oldest friends has been primarily a real estate lawyer for over 40 years, he lets me know about the fees and the fierce competition regularly.
Question. Is it legal to close, or mostly close (ie. all but the registration on land titles) a real estate deal without a lawyer?
@Sean: There are also hundreds of discount real estate brokerages to choose from, who will do the job for far less than $30K.
Of course that logic only holds true if all you calculate is the cost to sell, without regard for what you net from the sale of your home.
Plus it’s totally legal to sell your home privately in Ontario too.
Every consumer has the choice.
Sean
at 10:12 am
Thank You David Fleming. Your expert analysis and review of the GTA market has helped transparency far beyond the surface of RE stat headlines. Truly appreciated.
Condodweller
at 11:31 am
Add mortgage insurance to the mix which has also increased in % terms on top of higher prices. I also think between the three (LTT, RF, MI) it’s a small ransom to move which has got to be a major contributing factor to low inventories.
Consider that current moving costs can be higher than the outright price of a home in the 90s.
Appraiser
at 5:11 pm
Don’t know how prevalent it is for real, but there is anecdotal evidence aplenty that some buyers are choosing not to sell their existing home and renting it out instead, further adding to the declining inventory.
Condodweller
at 12:00 pm
Great to see these numbers. I’m not sure how relevant the SNLR number is in extreme situations. With such low inventory I would expect it to be close to 100%. Wouldn’t the fact it’s not 100% speak to the quality of listings?
Interesting comparison on what the various parties are bribing voters with:
https://financialpost.com/personal-finance/taxes/how-the-major-parties-proposed-tax-changes-will-affect-your-wallet
Note NDP wants to increase capital gains inclusion rate from 50 to 75% and also increase the top federal tax by 2% making the highest total tax 55.5%!
Liberals are proposing a new registered savings account for first time home buyers to agree 40 with $40k contribution limit. Tax advisors are going to love the additional complexity.
JL
at 1:24 pm
I certainly don’t see the market declining, but to address David’s invitation to speculate how things may (eventually) stop appreciating I’ll revisit a point I’ve raised previously; at some point you’ll have to hit a cost ceiling, wouldn’t you? Or in other words, where is the money to support higher prices going to come from? Right now real estate prices rise as people access more and more funds to spend on it, either through lower interest rates, rising incomes (not really material), family donations, second incomes, etc but most of these factors are already maxed out or will at some point reach a limit. Perhaps then (with no net new capital being made available) prices will plateau, and the supply/demand curve will reach equilibrium?
Appraiser
at 4:54 pm
Equilibrium is a theory. Almost never a reality and never sustainable.
There is no reason to surmise that home prices can’t continue to rise at the level of inflation at minimum from here on.
Over the long run real estate prices can and will rise. There is no ceiling.
JL
at 2:13 pm
Yes, sorry, I should have clarified my comment above referred to increases at a rate above inflation, with the ceiling potentially capping those non-inflationary increases. Inflation will of course always be present for all asset classes.