
I want to pick up on the theme from last Wednesday’s blog post, where we looked at the percentage of freehold listings with a hold-back on offers.
This fall, I had a lot of buyers asking me if they would still be “bidding” on houses, and after a client sent me a $799,900 listing in Riverdale over the weekend, asking if it will sell for over his max pre-approval of $800,000 (it’s probably a $1.1M house), I think perhaps some statistics are in order.
We’re only through two weeks in the fall market, and I will probably re-run this data at month’s end, but let me show you how freehold properties are selling thus far, and you can use it as a measuring stick moving forward…

I don’t know what it is of late, but I seem to be more interested in crunching numbers than telling stories.
A healthy balance of both is needed, not only to appeal to both sides of the readership, but also to paint a clear picture of the market.
But I held back all of my listings to mid-September from a strategic standpoint, so the stories aren’t quite as plentiful.
Sales are starting to trickle in, and since everybody wants to know where the market is, I figured this post would be helpful.
I’ve read a lot of the comments from September’s blogs thus far too, and it seems that the sentiments are mixed, to say the least. I would probably think it’s fair to say that the bears and bulls are equal, from a comments standpoint. Although one of my colleagues recently reminded me, “The bears are far more likely to comment. Just like you’re five times more likely to post a review online if you had a negative experience at a restaurant, or with a product, than if you had a positive experience.”
My gut would tell me that there are, in fact, more bulls than bears out there. But that could change in an instant too.
I’m still a bit bothered by the media’s portrayal of the Toronto market, since what I’m seeing is completely different from what’s being reported. But one reader commented last week that the media will always overreact, in both up and down markets. They’ll tell stories from the trenches when the market is red-hot, and they’ll paint the sky as falling when things are bleak.
But my issue is: things aren’t bleak.
And yet with this post today, again, I’ll come off as a cheerleader, because I’m saying the same thing, over and over.
For those of you waiting to see if I’ll wear a dunce cap by the end of the month, we’re nearing closer…
This past weekend, a client of mine emailed me a listing for a $799,900 semi-detached house in Riverdale, and asked, “Do you think this will go over $800K?”
My client has a pre-approval for $800,000, and we’ve been looking for 2-bed, 2-bath houses on the east side, wherever we can find them at this price point!
Last week, we had interest in a house that was about an 8-minute walk to the GO Train at Main & Danforth, listed at $699,000, that sold for $806,000.
That will be our sweet spot, this fall. The house also had 2-car parking, a finished basement, and a deep 133-foot lot.
Great value for $800,000, and I think we’ll have options like that again.
But the email – about the $799,900 semi-detached house in Riverdale, confused me a little, as I’m sure the listing confused my buyer.
With what’s being reported in the media about the sky falling in Toronto real estate, I find many of my buyers are unprepared for what’s really going on in the market.
Are $799,900 listings actually selling for $799,900?
Well, not in Riverdale! But yes, I’m sure throughout Toronto, they are.
To what extent, is what I wanted to look at today.
So I’ve gone back and looked at all the sale data so far this fall, and I’d like to examine it below.
Here’s the criteria:
We’re looking at all sales for houses between Tuesday, September 5th (the first day ‘back’ for the real estate market), and Sunday, September 17th.
It’s rare to see an “offer night” on a Sunday, but we are seeing a few listings saying, “Offers will be reviewed after the Sunday open house,” as some sort of aloof, non-committal offer date, plus, a bully offer could have bought a house on a Saturday or a Sunday, hence why I’m tracking up to the 17th.
I want to look at all the sales in the area, but then I want to “clean” the results, and eliminate any houses that were on the market for more than 14 days. Why? Because a property selling after 68 days on the market doesn’t tell you much about the fall market, since that property was listed at the start of July, rotted on the market, and then sold within our “new” fall market.
Sound good?
We’ll start with the east side, which some people say I’m biased toward, but rather I feel it gives a very good representation of what’s going on in the freehold market, and, there’s always inventory.
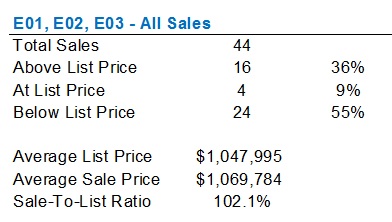
There have only been 44 sales so far through two weeks in the fall market, and believe it or not, that’s the most we’ll see today of all the areas in which we’re looking.
Sales are down, we know that for certain.
Sales were down some 35% in August, but the question is: how will this number look come September?
Topic for another day, for sure.
But looking at the percentage of properties that sold above and below the list price, we’re getting a decent read on the market.
As I mentioned above, however, I want to look at all the sales in these areas, but then to be fair – and to represent what’s truly going on this fall, I want to clean this data.
The data shows all the sales, but a property could have sold last Wednesday, that was listed last July.
To get a true picture of the fall market, let’s eliminate all the properties that were on the market 14 days or longer:
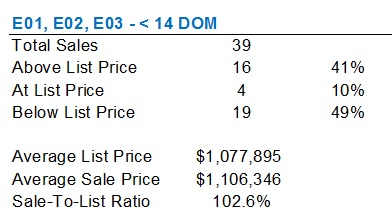
Here’s a decent representation of the market thus far.
41% of sales in E01, E02, E03 were for above the list price, but even more – 49%, sold below the list price.
I don’t have the time (although I kinda do have the desire…) to compare this to last year, as we did in last Wednesday’s blog, but I would assume that number would be higher.
You can all do the math here – add the four sales that sold at the list price, and we’re looking at just more than 50% of homes selling at list, or above.
But nobody really cares what sells at list, do they?
To really understand this market, and know if the same “games” that were being played in the spring – the rampant under-listing, and holding-back offers, we need to know how many properties are selling above list.
41% is a big number, and yet it seems so small to me.
Let’s look at the west side now:
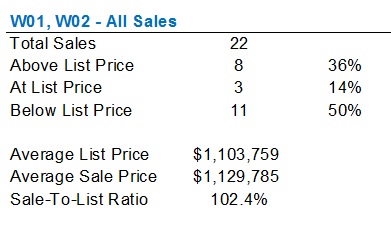
That’s all the sales, but again, I want to clean the data, as we did with the east side:
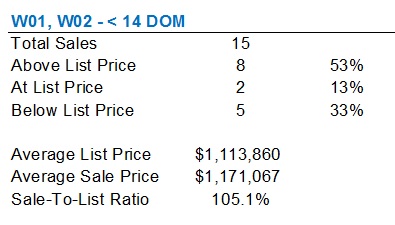
There’s only 15 sales left, so the data integrity isn’t going to be as high as if we did this at the end of the month, but 53% of sales on the west side this fall sold over the list price.
This is more than the east side, but I’d say in the same band.
In the midtown area – Leaside, Davisville, Rosedale, Moore Park, we really don’t have a lot to go on, and as somebody pointed out last week – including $7M Rosedale sales in the same category as $1M Davisville semi’s is a bit silly, so let’s forget the averages this time:
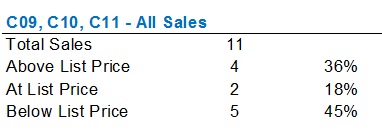
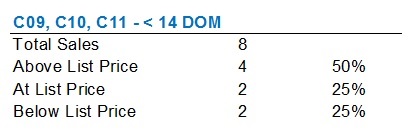
4/8 above list, that’s 50%, still in line with the other two areas, but eight properties isn’t enough to provide a conclusion.
I’m starting to think we’ll have to run this again in two weeks.
Last but not least, I want to look at the condo market.
I know the topic of this blog post has the term “Freehold” in it, but surely you’ve all been wondering about the condo market, no?
In addition, I think many people are perplexed by the reports of condos remaining hot, while the freehold market cools. You can count yours truly in that group.
Here are all the condo sales in the downtown core – C01 and C08:
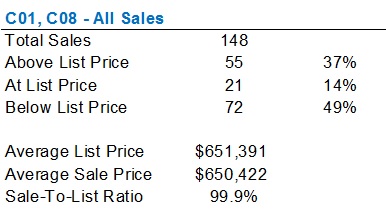
Here’s where you really have to clean the data, since some condos rot on the market for 80 days, or remain conditionally sold for three weeks.
Looking just at the sales for properties on the market two weeks or less:
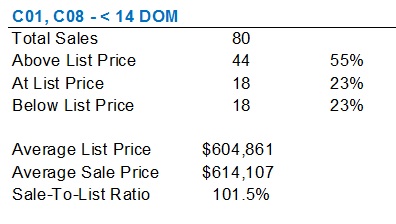
Somewhat shocking that the highest percentage of properties selling above the listing price on our board today is with respect to condos.
55%.
That’s just a crazy number to me.
Or even crazier, perhaps, is the fact that only 23% of condos have sold below the list price.
The same number – 23%, sold at the list price, which usually represents, a buyer swooping in on the very first day of the listing and picking up the unit for “just” the list price, and avoiding any competition.
But you just know things have changed in the market when more condos are selling over the list price than houses.
One final point, and it’s an important one.
In the spring, you knew just about any freehold home was going to sell for 120% of the list price, as every property was drastically under-priced.
In the fall, you can’t make the same assumption.
Two properties, both priced at $899,900, might be listed with completely different strategies.
One might be worth $1.1M, and the listing agent has deliberately set the list price low to solicit multiple bids, just like the spring. And one might be worth $899,900, or not even, as the listing agent has decided to price high, and see if he or she gets any nibbles.
If you’re a buyer in this market, you can’t just blindly throw a 20% premium on the list price, or by the same logic, assume that the house is worth what it’s listed for.
Go back to running comparable sales, and ask your agent why a house is worth what he or she is suggesting.
We’ll come back to this topic again throughout the fall market.


Appraiser
at 8:40 am
Outstanding number-crunching. Great snap shot of the market.
Unfortunately, most of the media and the bears seem to be pushing the narrative that the average sale price back in April is still somehow relevant.
A
at 8:07 pm
… and somehow they conclude that a 20% drop in average price = bear market (necessarily)…
Jack
at 10:22 am
Very informative, thank you. For those planning to sell, another interesting data point would be: For each of those sales, was it listed with an offer date (essentially setting up an auction) or without (so “willing to sell at this price any time”).
Joel
at 12:10 pm
I work on the mortgage side and have seen a large uptick in the amount of people ready to buy in the next month or so. I think that many were waiting to see what the market was doing and now want to buy before the prices start going up again.
Professional Shanker
at 1:18 pm
Agree with the first part of your statement but not necessarily the last part in totality – is their pent up demand from the spring/summer which will drive higher Sept & Oct sales – for sure but do buyer’s really think prices are going to surge upwards again? I would believe the primary driver’s would be 1) recent Sept interest rate increase – pre approval at a lower rate and 2) Potential for mortgage rule changes on uninsured mortgages effective Q4 2017/Q1 2018. That said I am not on the mortgage side – what is your take on the couple driver’s I mentioned?
Joel
at 6:42 pm
Most people are not aware of the upcoming rules, so I don’t see that being too much of a driver. We may see some people looking to buy because of the pre-approvals, but what I have seen is new clients without pre-approval ready to buy now and clients who may have an already expired pre-approval that have returned to the market.
Professional Shanker
at 1:34 pm
Bull/Bear, wherever someone falls, I really enjoy the quantitative nature of your analysis, stories as amusing as they can be are usually more one sided – hence the biased media coverage you eluded to in a rising/falling market. I have just recently started to follow your blog and don’t know if you have ever addressed this – on the condo side what is driving the continued run up – the skeptic in me doesn’t believe this is just an affordability issue, perhaps a topic for a future time.
Seems like based on this analysis you will be correct on your prediction if the mix swings towards more expensive detached homes, which it likely should, September seems to have brought a bit of equilibrium between sellers and buyers.
A
at 8:08 pm
totally enjoy the number crunching, David…
I am not a bear but it would seem like all things equal, a property that sold with LP…
Chris
at 9:05 pm
Little off topic, but John Pasalis posted this earlier:
https://twitter.com/JohnPasalis/status/909881347371622401
Maybe I’m reading too much into it, but I can’t imagine September numbers are looking all that great if TREB has decided to pull the plug on mid-month reports.
Guess we’ll all have to wait a couple more weeks to find out how things are shaping up in the Fall market!
Livy
at 1:39 am
I like a quantitative approach to Toronto housing market. The media does make it sound like the Toronto market home prices are falling to a near crash but that’s not the case and still out of reach for many. The condo numbers look quite interesting though but it’s only a snapshot of the condo market. I’m curious to know what the Toronto condo numbers look like outside of the downtown core (West vs. East) to get better picture of market.
mehul
at 11:51 pm
check out https://www.mehuldesai.ca for more info and deals.