

Raise your hand if you managed to get through the weekend without gaining any weight?
Put your hands down.
I don’t believe you…
What started on Friday night with a healthy meal of salmon and vegetables led to a last-minute decision on Saturday to order Churrasco’s, which was followed by a Thanksgiving turkey feast on Sunday night, and was capped off with an order of Greek food at my mother’s on Monday night.
I’m honestly afraid to step on the scale.
Then again, if fear were a true concern, I wouldn’t have had mashed potatoes and stuffing, smothered with gravy, as a “meal” on Sunday night. I probably would have eaten at least one vegetable and maybe consumed more than a token piece of turkey. It was like carbohydrates were on short supply in the world and I was trying to get whatever I could before we ran out!
Factor in a fair amount of whiskey and an excessive amount of coffee, and my body is screaming at me right now. My fingers are having trouble pressing these keys. Is it possible my fingers are fatter after just one long weekend? Or are my hands shaking from dehydration?
In any event, the show must go on!
The Thanksgiving long weekend is not exactly the “halfway point” in the fall real estate market but it often comes at a time when buyers and sellers need a break! We have nine listings in the queue for next two weeks as the fall market continues to round into form, and the timing for sellers is ideal. We also have buyers who have purchased in September who are now preparing to list their existing homes, and if September was any indication, the market is going to remain busy in October.
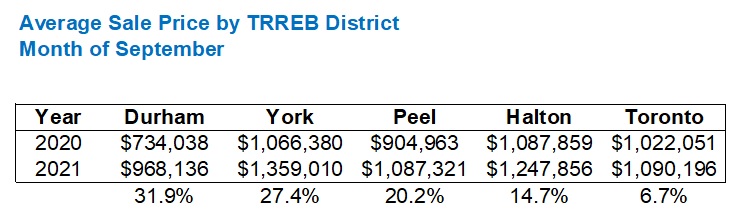
When I wrote about the September TRREB stats last Wednesday, I noted that while the average home price is up 18.3% year-over-year, the 416 area is only up, on paper, 6.7%.
In fact, it’s the areas outside the central core that are pushing home prices higher.
Peel, York, and Durham Region lead the way.
As noted last week, the average sale price in Durham Region in September of 2020 was $734,038, but that rose, in twelve short months, to $968,136.
That’s an increase of 31.9%.
Have a look:
I’ve heard stories about what’s happening in Durham Region this fall, but I haven’t experienced it myself.
The last house I sold to a buyer in Durham Region was in the spring, and my clients beat out 27 other bidders. They paid a big price at the time, but as big as that price was – I think around $800,000, it’s crazy to think that only six months later, that house could be worth $920,000.
I know, you don’t believe me.
How could you?
My clients bought a house in March for $800,000 and in September it was worth $920,000?
You can’t believe me, but more to the point, you don’t want to. It just can’t be possible.
So let’s do this: let me dip into Oshawa, Whitby, and Pickering. Let’s go to Clarington, Courtice, Liverpool, Blue Grass Meadows, and Taunton, and I’ll show you real examples of houses that have sold multiple times in the past three years, and what the annual rates of appreciation look like.
Let’s start in Pickering in a community called Liverpool.
Here’s a property that sold in June of 2019 and then sold a mere 19 months later:

Big price difference, right?
That’s a 45% increase in 19 months!
To keep it consistent with that 31.9% year-over-year increase in the month of September that we noted above, let’s annualize the stats we’re looking at today. Some of you may want to compound semi-annually if you’re playing along, but I’m taking the path of least resistance here and simply looking at the overall return, dividing by 12 months, and coming up with an approximation that’s perfect for today’s example.
In this case, the annualized appreciation is an incredible 28%.
That might be less than the 31.9% noted above, but that’s year-over-year from September of 2020 to September of 2021. We haven’t discussed what took place in 2019 or the first eight months of 2020, which perhaps I’ll do later this week. But for now, back on planet earth a 28% annualized rate of appreciation on a house only owned for 19 months is mind-boggling.
Let’s now move to Courtice which is an area that’s absolutely on fire right now.
This house sold in February of 2019 and then again this past summer:

The exact same house that cost $549,900 in February of 2019 was selling for $922,000 by this past summer.
That’s 2 1/2 years for those of you playing along at home.
In 2 1/2 years, the value of this house rose 67.7%, or about 27% annualized.
So believe what you want about that September figure that I noted last week and again today, but here’s a real-life example of a house that truly has gone up in value in line with the “on paper” figures.
But it’s just one house, right? They can’t all be like this?
Let’s go around the corner in Courtice and check out another.
This house sold in August of 2019 and then again in April of 2021:

From $500,000 in the summer of 2019 to $800,000 in the spring of 2021.
That’s a $300,000 gain in approximately 21 months, or about 34% annualized over that time period.
And it’s not confined to one price segment either.
Here’s a house in the $1M+ range that shows a similar price increase:

Same damn house!
$690,000 in March of 2019
$1,200,000 in September of 2021
A 30% annualized rate of appreciation over that 2 1/2 year period.
Wanna head out to Whitby?
I hear Blue Grass Meadows is really nice this time of year!
Actually, it was really nice in September when this house sold for 70.2% more than the owners paid for it only 26 months earlier:

Once again, we see that these incredible price gains we’re hearing about are not unique to a particular price range. It would be one thing if all the $450,000 houses in 2019 were now selling for $700,000, since we could point to the absolute value of the property as the reason for appreciation. But here we see a $1.4 Million+ house included in our analysis, whereby the values rose at a 32% annualized rate.
You wanna get really crazy?
Ready to feel nauseous from something other than the turkey/whiskey/coffee/antacid combo that your body is currently rejecting?
How about buying a house for $782,000 in February of 2020 and selling it for $1,220,000 in May of 2021?

These guys finished the basement (a lot of newer houses in the suburbs have these basements with 9-foot ceilings, framed, insulated, and like 80% of the way finished but remain “unfinished”), but for $20-$30K worth of work, they didn’t really create this sort of value.
No, this whopping 45% annualized rate of appreciation is mainly due to the market.
But while we’re on the subject of finishing basements and flipping houses, how about another example from Taunton?

Folks, this is literally the same house, just with a finished basement.
They sold a little more than one year later for a 56% improvement on what they paid. How much value did they create by finishing the basement? They added drywall, flooring, and a bathroom. VOILA!
You literally cannot make this stuff up.
A picture paints a thousand words, and if we all had a time machine and a mortgage pre-approval, wouldn’t it be sweet to check out Durham Region in the fall of 2019?
Not that we should cry foul about price increases here in the City of Toronto though. And for those of us with clear heads, attempting to be unbiased, might we suggest that perhaps a 31.9% year-over-year return is unhealthy and not something we should hope for?
I would find it hard to believe that, before the September TRREB stats came out, the average person would have told us, “Price increases in Durham, York, and Peel are what’s driving GTA home prices higher.” But that’s why we look at the stats!
From there, the conversations could go any number of ways. We might want to explore the “exodus” from the City of Toronto and how that’s affected prices in other regions. We might also want to look at supply numbers in these areas to forecast if this level of appreciation will continue.
Of course, having driven through “the country” this weekend, I can personally attest to the fact that behind every 2-year-old grid of 500 new houses lays a massive open field, or farm, or plot of nothingness, where new houses could be built. The same can not be said of the City of Toronto…


Ed
at 8:58 am
Same thing in Niagara region. September prices up 33.8% over the last year.
Appraiser
at 2:46 pm
Flip Side:
Appraising a property today that sold on MLS in 1990 for $367,500.
The next sale on MLS in 1995 was for $250,000.
(EMV today is ~$1.5 Million).
Kate
at 4:58 pm
As we continue to pave over our farmland in Southern Ontario, hope appears lost that politicians and the electorate will heed the cautionary tale of Easter Island.
RPG
at 6:36 pm
Kate, where else can we build houses? Your solution is to NOT build on farmland in a province with a housing shortage and housing crisis?
Kate
at 7:38 pm
My solution would be to lower (not eliminate) immigration, crackdown on short term rentals, and do something meaningful about money laundering and the flood of foreign capital. Tightening up monetary policy instead of the central bank induced asset inflation that has been going on for years. As a start.
In the wake of the Covid induced shortages one might think food security and the consequences of over reliance on foreign markets would be top of mind.
HML
at 10:23 am
Plenty of room to build up…
Libertarian
at 12:36 pm
But there is no demand to build up. People want detached; that’s why Durham and Niagara have gone up so much in value.
So Kate raises a legitimate question – are we going to pave over all our farm land? At what point does the law of diminishing returns kick in and tell us that building subdivision after subdivision affects our standard of living? Urban planners will have their work cut out for them.
Izzy Bedibida
at 1:55 pm
Good point. The current “system” provides a choice of either an expansive suburban home, a tiny condo or a town home that is very unfriendly to seniors or families with small children.
Besides urban planners, developers will have to be forced to use architecturally sound design principles in many of their developments.
Case in point. I brought some stacked town house exemplars for an architectural design project and my students all asked if it was allowed to design/build something like that.
Missing Middle
at 3:38 pm
For the most part, there isn’t a whole lot of feasibly priced housing between shoebox condos and large suburban homes. I imagine that some of the people who moved out from Toronto to Durham or Niagara would have been satisfied with living in a townhouse, threeplex, or low-rise condo.
We can increase density (building up) without resulting to extremes like Liberty Village / Bay Corridor / Queen West.
Appraiser
at 9:46 am
As I’ve said here before. Covid changed our value set.
What really matters is home. Apparently at just about any price.