

Are you a baseball fan?
Probably not. There aren’t a lot left anymore.
I’m what you might call a “purist” in that I don’t like change. I like the game the way it always was, and I hate the notion of making changes to the integrity of baseball in attempts to attract new (read: young) fans.
Baseball is a special sport. It’s been around since the 1880’s and the game itself hasn’t changed much at all. Walks were recorded as hits early on, but that changed in 1887. We now the “count” as 4-balls, 3-strikes today, but that didn’t come into effect until 1889. And the pitcher’s mound that we know today of 60-feet, 6-inches used to be shorter, but it has been set this way since 1893.
As I said: not much has changed.
But to have a sport that’s existed for almost 150 years and the continuity, statistics, and ability to compare one player to another, one season to another, or even one century to another, is a claim that only applies to baseball.
I think baseball is an art. It’s beautiful.
But to most people today, baseball is slow and boring compared to most sports, but compared to life itself, and the lives of younger people who have embraced technology like it’s a part of their body, baseball is borderline unwatchable.
So, we’ve seen measures to speed up the game, such as a signal for the “intentional walk” rather than actually throwing four pitches, we saw pandemic-baseball start a runner on second base in extra innings (which is the dumbest thing I’ve ever seen), batters are apparently not allowed to step out of the box (not enforced in reality) and pitchers are apparently on a secret pitch clock (also not enforced), and the baseball itself has been secretly juiced so there are more homeruns. Who doesn’t love homeruns?
But if baseball really wants to compete for the attention and affection of youngsters and provide a product that they can relate to, then we’ll have to start encouraging players who reach second base to stop, carefully pose for a picture, take eighty-nine shots, choose one, and then upload it to Instagram as a spontaneous, in-the-moment pic. Now that’s relatable!
I know I’m going to lose this battle, but I’d be remiss if I didn’t write the preceding.
Like most sports, baseball has a pre-season.
But baseball’s pre-season is unique in that the games have the least meaning of any major sport, and you can draw the fewest conclusions from the games.
In baseball’s pre-season, you might have a star pitcher enter the game only to try a new pitch, over and over, against live batting. If the pitch gets hammered all over the park, who cares! It’s pre-season.
How many times have we seen a team go 19-4 in the pre-season, only to go 60-102 in the regular season?
The stats are meaningless!
Once upon a time, I argued that the December real estate statistics were equally as meaningless.
Some are, to be fair.
The average price of a detached home in the 416 in November was $1,807,983, and in December it was $1,698,178. Did the value of a detached home drop 6.1%? No, of course not. But that stat is there if you want it!
I’ve come to realize that there are several stats, mainly the larger ones, which can be telling in the context of the overall market.
Of course, if we want to compare apples to apples, and look at December vs. December, we can always draw inferences from the month of December.
I opened the TRREB stats last month to find a figure that was both surprising and unsurprising at the same time.
The average sale price of home in the GTA clocked in at $1,157,849.
This was unsurprising because it’s less than the November figure. There isn’t a single December in the history of TRREB where the average sale price was higher than November.
But this was surprising because it’s only 0.5% less than November’s figure of $1,163,323. I thought the average would drop a lot more than that!
In fact, if we look back at the preceding decade, we’ll put that 0.5% drop in context:
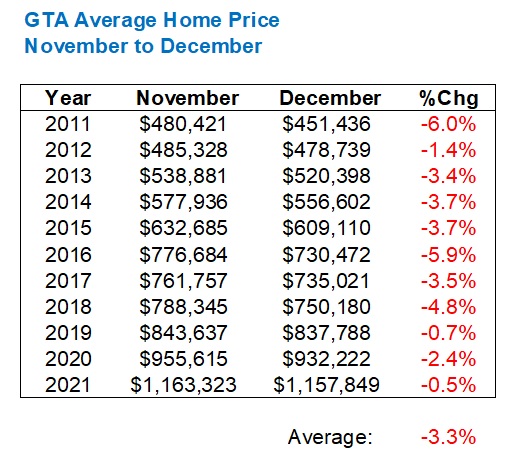
Take 2021 out of this, since we’re using it for comparison, and the average decline from 2011 through 2020 is 3.6%.
Either way, it’s safe to say that the 0.5% decline in average home price we saw from November to December last year is something we’ve never seen before, and it’s less than one-seventh of what we’re used to seeing.
Am I reaching here if I suggest that this is a sign of things to come?
At worst, let’s agree that this shows a market strength that we haven’t seen in previous years.
At best (or worst depending on who you are…) this could be used as an indicator of a January market that’s going to absolutely boom.
Personally, I think the January market is going to boom, but it’s not because of the above data; not entirely.
If there’s one statistic from the December TRREB stats that blew my mind it’s this one:
3,232
The baseball fan in me thinks that that would likely put a hitter in the top-20 for all time “base hits,” or a pitcher in the top-10 all time for “strikeouts.”
But it’s actually the number of Active Listings in December.
Active listings isn’t as sexy a statistic as new listings, but if you want to know what’s happening in the market, reflecting both listings and sales, then look at active listings rather than new listings. Active listings are the number of listings left at the end of the month and that’s important because it tells us the rate at which they’re being absorbed.
Those 3,232 active listings at the end of December are the fewest of any in the month of December, ever.
That’s important.
But more importantly is the fact that the average number of active listings at month’s end, in December, from 2002 through 2020, is 12,033.
So the number of active listings last month is a little more than a quarter of what the previous two decades has shown.
Huh. How about that?
And what was the previous record for futility?
4,746 active listings in December of 2016, which is also well below the 12,033 average, but can also teach us something, if we’re willing to listen.
The sales-to-new-listing ratio in December of 2016 is the all-time high for the month of December at 127.0%. That likely had a hand in the depressed 4,746 active listings, compared to the year before in 2015 when December produced 9,137 active listings, just for context.
Now, what happened after December of 2016?
Well, obviously January of 2017.
And what happened in that month, and the months after? Well, we saw the greatest four-month bull run in the history of Toronto.
If the depressed number of active listings in December is any indication, it might seem that January of this year is going to boom, and that will surely set up for price escalations throughout the spring.
Returning back to the November-to-December comparisons for a moment, I wanted to look at each individual TRREB district, since every average is made up of other averages!
That 0.5% drop from November to December surely has highs and lows among the five TRREB districts, but it might surprise you to see just how high and how low…
We’ll start with the 416-Toronto:
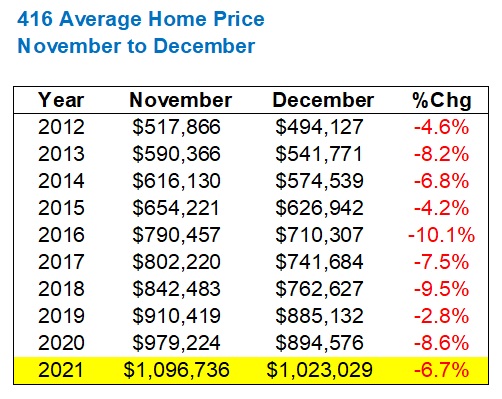
A 6.7% drop is a lot more significant than the overall 0.5% drop, although it’s the second-lowest since 2016.
The average drop from 2012 through 2020 is 6.9%, so we seem to be on pace.
It’s just really, really hard to see “strength” in the 416 when we look at the other four TRREB districts. Don’t get me wrong, I do see strength in the 416. Herculean strength, and a miserable market for buyers in the next few months, it’s just that this figure above might not show it!
The next lowest after that 6.7% drop?
Which area, and how much?
Halton, and not by much at all, in fact…
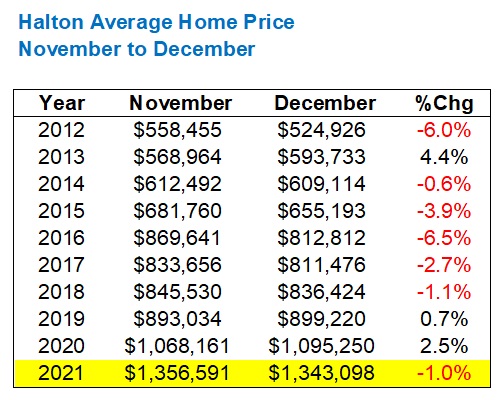
A modest 1.0% drop, which is double the 0.5% average, but a pittance compared to the 416-Toronto figure.
The next three areas defy logic, folks.
All three areas saw higher prices in December than November which I simply cannot explain. I have no idea how this is possible, although while historical data for 416-Toronto shows every price drops from November to December, all of Halton, York, Durham, and Peel saw months where prices increased.
Here’s York Region:
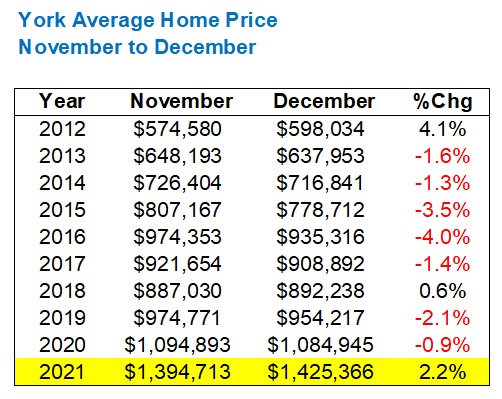
That’s crazy, in my mind.
I honestly don’t see it. This isn’t a factor of a lower price threshold, since York Region’s average home price is actually the highest of all five TRREB districts!
Let’s look at Durham Region, which has been on fire in the past twenty-four months:
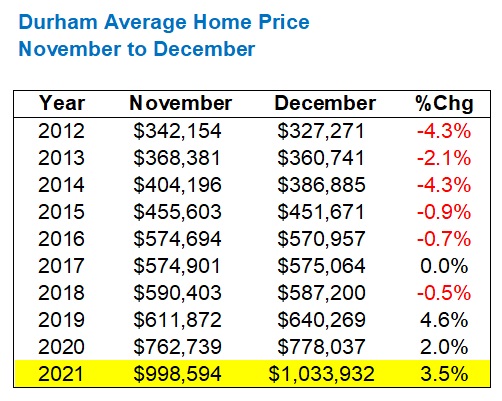
The increase is even more pronounced here, with a 3.5% month-over-month appreciation, although we can note that the average home price had increased from November to December in each of the previous two years.
Isn’t that something?
The saying, “You learn something new every day” doesn’t fit for many of us in the real estate market, but it’s times like this when the saying rings true. I never thought, for a moment, that I’d see this sort of data. Looking at the City of Toronto, where a drop in average home price from November to December is as automatic every year as the Toronto Maple Leafs failing to win the Stanley Cup, I never would have that we’d see an increase in other areas.
Having said that, nothing could have prepared me for what we saw in Peel Region:
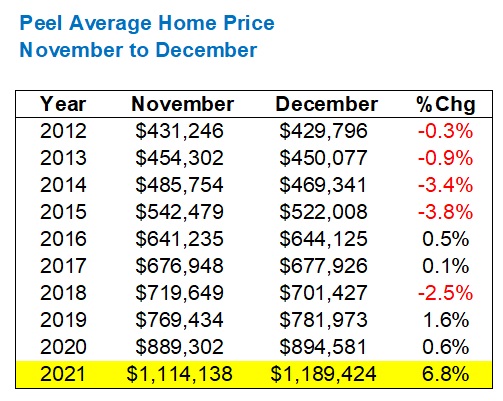
It’s not a typo.
I checked three times.
The average home price skyrocketed in Peel Region in December and that’s not due to a lack of inventory, since new listings were the third-highest in a decade.
More to the point, the 1,236 sales recorded in December was the second-highest in a decade’s worth of sales activity as well.
While I would caution a reader to apply a 6.8% premium on their home after one month, I also could not offer the “low sample size” argument to deter them from doing so.
–
The bottom line is this: December is always an odd month and it’s tough to draw conclusions, much like it’s tough to learn anything about a baseball team’s prospects for the upcoming season based on a meaningless pre-season. However, this sales-to-new-listing ratio madness in December will undoubtedly lead to a similar dearth of inventory in January, and through a mere one week in the 2022 market, I’m already seeing this.
The anecdotes I could share with you already, my goodness. You wouldn’t believe it.
How about a $5M house, on the market for two months leading up to Christmas – unsold, getting five offers on January 10th in the “new” market of 2022?
I’m sure we’ll discuss this more next week and thereafter as the market rounds into form.
But none of us, and I mean not a single one of us, should have been caught off guard by this! I’ve been predicting these early-2022 market conditions for weeks, if not months, and I read my team the riot act all throughout December. Now, they see 28 offers on a bungalow at Eglinton and Victoria Park, and to ask, “What’s this about?” suggests they didn’t take my old-man ramblings about the real estate apocalypse at face value…
January of 2021 saw 9,430 new listings.
January of 2020 saw 7,836 new listings.
January of 2019 saw 9,456 new listings.
I’ll make a prediction that, although 2020 provided a depressed number of new listings in January, we see way fewer than that 7,836 figure.
In fact, I’ll make a prediction that we see new listings in the 6,000’s.
Let’s pick this up again next month.
In the meantime, for those of you in the market right now, good luck and God speed!


Bryan
at 9:15 am
Can you imagine that the “pitcher’s box” (as it was called then) was originally only 50 feet away from the plate?? Can you imagine an Aroldis Chapman fastball coming in at 105 mph from 10(.5) feet closer??? Yeesh….
David Fleming
at 9:45 am
@ Bryan
Did pitchers throw 105 mph in 1880?
This was before radar guns.
However, I suppose if somebody threw a fastball up against, oh, I dunno, say, a MOTORCYCLE, and we knew how fast that motorcycle was going, then we’d know how fast the pitch was.
If only that sort of test were conducted. 🙂
https://www.youtube.com/watch?v=IhZ7t_DNi9w
Bob Feller gave the motorcycle a headstart and with the motorcycle going 86 mph, this pitch was estimated (in 2010) to have gone 104 mph.
FYI – this was filmed in July of 1940. Very cool!
Libertarian
at 10:34 am
David, I don’t remember if you ever wrote anything about this, so feel free to link to it if you did, but where are you on the Shohei Ohtani vs. Babe Ruth debate?
As for listings, my two cents are: of course they’re going down, nobody is selling. Investors are buying more and more of what is coming on the market and they are definitely not selling. This ties in to your prediction about most people will be renting in Toronto in 20 years.
David Fleming
at 11:34 am
@ Libertarian
Babe Ruth is the greatest baseball player of all time, hands down, no debate.
Consider that in 2021, the MLB leader in homeruns was a tie between Salvador Perez and Vladdy Guerrero at 48. The next-highest was Shohei Ohtani with 46, then Marcus Semien with 45, then Fernando Tatis Jr. with 42, and so on.
In 1920, Babe Ruth hit 54 homeruns. The next highest? George Sisler…………with 19!
In 1921, Babe Ruth hit 59 homeruns. The next highest was Bob Meusel with 24.
Babe Ruth was so much better than his peers. This was probably the largest discrepancy between “best” and “next best” until Tiger Woods won the US Open in 2000 with a score of (-12) and second place was (+3).
There were no steroids in 1920 so there’s no argument against Babe Ruth dominating the competition.
Now, as far as a comparison to Shohei Ohtani, consider that Babe Ruth was a dominant pitcher in 1916, going 23-12 with a league-leading 1.75 ERA, but at this time, he wasn’t playing the field every day. He only had 136 at-bats that year, with 3 homeruns. Babe Ruth started 28, 40, and 38 games in 1915, 1916, and 1917. Those were his “full time pitcher” seasons. In 1918, he only started 19 games, and he played 95 games as a position-player. In 1919, he only started 15 games, but played 130 games as a position player. The transition to “full time hitter” took place in 1920, which was his first season with the New York Yankees. The rest is history.
What Shohei Ohtani is doing has never been done before. Not even Babe Ruth can compare. Nobody has ever been as effective as a hitter and a pitcher in the same season. Last season, Ohtani appeared in 155 games in a 162-game schedule, produced 138 hits, led the league with 8 triples and 20 intentional walks, and hit 46 homeruns. He also made 23 starts as a pitcher and threw 130 innings with 156 strikeouts, a 3.18 ERA and 1.09 WHIP. This combination of hitter and pitcher has never been seen before. It’s incredible, through 150 years of baseball, we’re seeing something new.
Imagine if a football player played quarterback and threw 41 TD’s against 8 INT’s, with 4,800 yards, but also played DE and recorded 14.5 sacks. It’s absurd.
Appraiser
at 1:26 pm
Or if Ovechkin was also a goalie.
Bryan
at 10:45 am
Wow. Very cool indeed. Thanks for sharing… I had never seen that clip before. Sort of flies in the face of the “players are better than they have ever been” argument that so many make these days. Bob Feller out there in 1940 throwing 104 mph in a tie….
Appraiser
at 10:10 am
Great number-crunching as usual David.
Spoiler alert for those who care, prices are indeed zooming. Every single day I catch myself shaking my head in partial disbelief after completing an appraisal report.
Biggest change for me as a baseball fan keenly watching the Montreal Expos in the early seventies, was the introduction of the designated hitter rule in 1973. Purists hated it and still do? I love it. Aside from Shohei Ohtani, most pitchers are embarrassing to watch in the batters box.
John
at 12:41 pm
Do you often have to undercut the offered price in your appraisal reports?
Is so, does it become a major concern for a lot or a very few buyers?
Given your occupation, your insights are invaluable these days.
Appraiser
at 1:19 pm
Rarely. But yesterday it happened. The sale price of the subject property was a clear outlier in a data set of recent sales containing a plethora of very good comparable sales.
Having said that, I have no doubt that by the end of the month the sale price may no longer be an outlier.
My understanding is that much like 2017, when we experienced a brief rash of appraisal shortfalls, 99% of the deals will close successfully. Usually the remedy is a larger down payment from the buyer.
Bal
at 3:43 pm
If Appraisal is shaking his head in disbelief that mean market is totally insane ????
John
at 3:51 pm
I don’t know anyone who hasn’t been shaking their head over the last 12-18 months, but the market seems to keep running regardless.
JL
at 4:45 pm
I’m still waiting for someone to kind of predict how/when this will all end (other than “its going up 20%+ per year forever to infinity”, because if that’s the case the only sensible thing to do is put every last dollar into RE this very second).
Personally I don’t believe prices will ever materially fall, but I did expect them to reach a plateau/low growth phase ‘at some point’. That ‘point’ though seems to keep getting pushed further and further off into the future.
Does the average buyer really have infinite money/leverage, or is there an actual ceiling to how much can be thrown at RE?
Bal
at 8:23 pm
No prediction ….all predictions are failed at this point ….lol
No Ragrets
at 8:44 pm
Think about the people who bought homes, for under half a million, ten years ago. Mostly normal people with normal jobs. Now if we move, it will cost us at least a year’s salary in land transfer taxes, real estate commission, lawyer fees and misc. moving costs. Also consider that many of this group are starting to plan for retirement so that amount of money matters a great deal. What I’m saying is, a lot of us can’t afford to move.
David Fleming
at 9:43 am
@ Scotty P
“That’s my credo. No ragrets. Fo real.”
JK007
at 10:44 am
and that is another reason for declining inventory i believe people’s inability to move/downsize and have a sizeable nest egg to rely upon in retirement..seems to be a self-fulfilling cycle right now..
Appraiser
at 11:41 am
Also, plenty of anecdotal evidence to suggest that some of those who can afford to move are renting out their old digs instead of listing, further constraining supply.
JF007
at 1:13 am
Things are indeed bonkers in peel..was talking to a friend who told me about this house that sold for 1.7 mill in fall of 2020 and it sold again recently for approx 2.7 mill…not sure what prompted this almost million dollar spike unless the previous buyer left hidden treasure in the backyard or something and the new buyer intends to find it????????
Bal
at 8:41 am
not just that one house …many houses flipped within six months without any upgrades with hefty profit ….new real estate trend
tspare
at 2:46 pm
Thanks for the great breakdown. Amazing to see Toronto has the smallest avg home price in Dec. That in itself is also hard to believe.
Ed
at 4:50 pm
Think lots of condos.
Appraiser
at 6:34 pm
Speaking of foreign buyers:
“Zara owner Amancio Ortega to buy Toronto skyscraper Royal Bank Plaza for $1.2B”
https://www.cbc.ca/news/business/rbc-plaza-amancio-ortega-1.6314011
Kyle
at 1:30 pm
LOL, even at $1.2B there were multiple offers
“Ortega only beat one other bidder to secure the purchase”
https://storeys.com/royal-bank-plaza-sale-zara-bellwether-confidence/
Derek
at 12:19 am
Blog post idea:
-A running commentary on the words coming out of the mouths of the people on CP 24’s Hot Property, any episode.