
There were a few things that inspired, or provoked, this post.
For one, a comment made by Appraiser on Friday that simply said:
“Did I miss a crash somewhere?”
I’m not taking a side on the back-and-forth conversation with other readers from Friday’s blog, but rather raising this point because the question he asked, which I have to think was a serious one, has merit.
Some might suggest that the question was meant with cynicism, but I don’t believe it was.
In fact, it made me realize that there is an opinion out there, perhaps even a prevailing one, that there was a real estate market correction here in Toronto.
Was there?
Was there a crash, a correction, or neither?
Those who read this blog while simultaneously conversing with the author in their heads, are already formulating their responses, mid-read.
Some will knee-jerk, “Of course there was a correction, this is such a stupid conversation. Where is he going with this?”
Others have a voice inside their heads telling them something to the contrary.
And what’s so ironic about this line of discussion is that I don’t know any two people who would agree on whether the Toronto real estate market experienced a crash, correction, or none of the above, and could also agree on a definition of “crash” and “correction.”
That’s where I want to start this blog today, since, to be quite honest, all the talk of market corrections isn’t really prudent without a definition of one.
And as I write this, I’ll tell you – I could make an argument, re: correction, either way. In fact, I just might do that.
So how about this, let’s just type “market correction definition” into Google and let them decide how to define it, shall we?
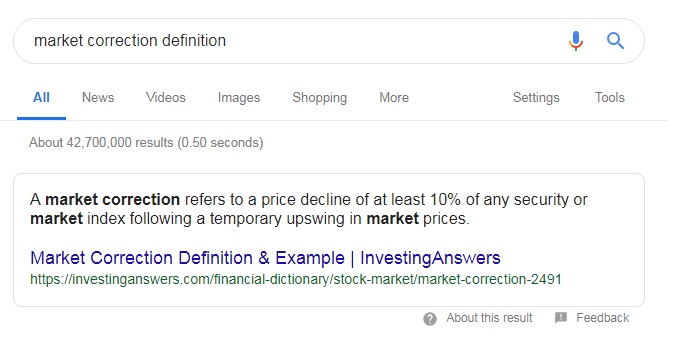
Alright then, so it’s a drop of 10%.
But just for good measure, let’s go to a second source.
How about Investopedia?
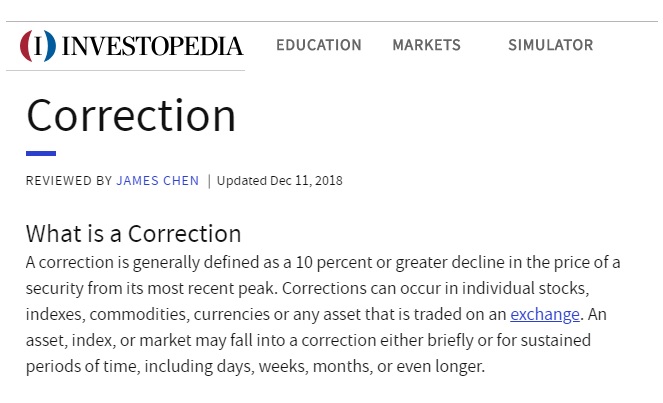
There again awe see a drop of at least 10%, so I’m sure if we can agree on anything here on TRB, we can agree that a “market correction” is a drop of at least 10%?
But just to add fuel to the fire here, what about the words, “….following a temporary upswing in market prices”?
That’s what the first definition reads, and the word “temporary” offers potential conflict on an agreement for our definition.
Because, let’s face it, there was nothing temporary about the twenty-one-year appreciation in Toronto home prices.
It feels as though the term “correction” insinuates that there was a mistake, and I just don’t know that this was the case in the Toronto real estate market. If a 10% drop occurs after a prolonged period of appreciation, as oppose to temporary, is it really a “correction?”
Well, now I’ve gone and undermined any attempt to find common ground on the mere definition of the phrase “market correction.” But either way, let’s just assume that the definition holds true, or mostly.
So now we’re clear of subjectivity (as much as we can be…) and looking at an objective opportunity to identify whether or not there was a market correction in Toronto. All we have to do is use that 10% number, and it should be quite easy.
But alas, nothing is easy when it comes to the complex world of Toronto real estate, especially as opinion is involved.
Because I do believe that there are market bulls out there that would concede Toronto’s real estate market experienced a correction, and there are market bears out there that would argue it did not.
As I said earlier, I feel as though I could make a compelling argument for both cases, so let me do that now.
Argument for a correction in the Toronto real estate market.
Any market correction happens after a “peak,” and thus identifying the peak, with the benefit of hindsight, shouldn’t be all that difficult.
The average home prices in the GTA, in individual months, in the spring of 2017 were the following:
January – $770,745
February – $875,983
March – $916,567
April – $920,791
May – $863,910
June – $793,915
We know that January is like December; they’re slow months, with misleading conclusions drawn from any statistics, relative to adjacent months, so we can ignore that month. Either way, we can see a “peak” in April.
For those that would suggest one month is not sufficient time for a “peak,” then I would offer the average sale price in March was only $4,000 lower; less than a half-percentage point, so really our peak is two months.
From this peak, we can fast-forward 6, 12, or 18 months, and see that the average Toronto home price never recovered.
Again, ignoring December, we’ll look at the fall of 2018 and see the following:
September – $796,786
October – $807,340
November – $788,345
Simply rounding, and using $920,000 as the peak, and $800,000 as the current level, we see a drop of 13.0%, which meets our criteria of “at least a 10% decline” to be considered a true market correction.
If that’s not enough to satisfy the definition, let me take this a step further.
The question of whether or not a market correction happening in lieu of a “temporary upswing in market prices” still qualifies as such has arisen.
But the “peak” did come after a temporary upswing in prices, and there’s no debate about that.
We can ignore the low January average sale price of $770,745, that’s fine. We can ignore December’s $730,472.
But we can’t ignore the fall, 2016 market that preceded the spring of 2017:
September – $755,755
October – $762,975
November – $776,684
Is there any doubt that the early-2017 average sale prices constitute a “temporary upswing?”
Not only have we satisfied the criteria of “at least a 10% drop in price,” but we also have it following a “temporary upswing.”
Check. Mate.
–
Argument against a correction in the Toronto real estate market.
The comments section on Friday’s blog saw a couple of readers go back and forth using the term “chery-picking” with respect to statistics, and I would offer that anybody who chooses to use a “peak” market home price that’s one, or two months, is doing exactly that. Cherry-picking.
In the context of an unprecedented twenty-one-year market run, using the price from one month to generate a “peak” is simply irresponsible, but it’s also rather see-through.
Markets are not made in a day, a week, or a month.
Just as any succesful stock market investor will tell you that no one trade makes a person rich, and that it’s not like movies about bank robbers who always want to go out on top with that one, last “big score,” but rather success is bred over the long-term, through thousands of trades, the same logic should be applied to the real estate market.
I would offer that the Toronto real estate market did, in fact, see its first decline in twenty-one years. That’s not up for discussion, it’s simply numbers. The average home price in 2017 was $822,727, and the average home price in 2018 was $787,300. That’s a 4.3% decline, not in debate.
But that’s still only a 4.3% decline.
Where is the “market correction” talk coming from?
In order for the market to truly have corrected, we’d have to see “at least” ten percent. And we’re not seeing even half of that.
Yes, the average sale price in Toronto in April of 2017 was extremely high. But that was one month in a year.
By extention, my New Orelans Saints were up 13-0 in Sunday’s playoff game, only to lose (on an egregious missed penalty that will live in playoff history forever) by a score of 26-23 over three hours later.
Who cares about being up 13-0 in the second quarter when there are four quarters to play?
How can anybody suggest that the Toronto real estate market experienced a correction because of one or two months’ average home price? The responsible thing to do would be to see how the whole year plays out, and put that up against the next year, just as the Los Angeles Rams put all of the points they scored in four quarters against all of the points the New Orleans Saints scored in four quarters, to figure out who won and who lost.
I would also offer that the city of Toronto saw its average home price actually increase by 0.2% from 2017 to 2018, and while the GTA home price dropped 4.3%, there are a whole lot of folks here in the core asking, “What correction? My house is worth more than it was last year!”
Not only that, the condo market was on fire in 2018!
The average condo price in the 416 increased 8.7% from 2017 to 2018, and while I don’t have the specific GTA-wide condo stats for YTD 2017 and YTD 2018, because the Toronto Real Estate Board’s statistics department remains unable to identify what stats people actually value, and which videos of boring floating-heads people don’t actually watch, I would guess that the average condo price in the GTA did not decline by 10% or more, or even 8%, or even 5%, or even 3%, or perhaps not at all, given the 8.7% increase in the 416.
Last but not least, the MLS Home Price Index, which we know is a much smoother price metric than anything else available, shows the following prices for the spring of 2017:
March: $772,400
April: $807,900
May: $816,400
June: $810,700
And the following for the fall of 2018:
September: $765,400
October: $766,300
November: $763,600
Round these out at $810,00 and $765,000, and that’s still only a decline of 5.6%, GTA-wide. Looking at the 416, we’re up by over 3.0%.
–
So those would be my two arguments if my feet were to the fire, and to be quite honest, I still don’t know how to address the potential “market correction” in Toronto.
The problem, as I have noted multiple times by now, is that we all have different definitions, and that means different timelines as well. Many of us have agendas too, based on where we work, and what we own.
The media were very quick to talk about “bubbles bursting” as evidenced by the front-page piece in Maclean’s in 2017:
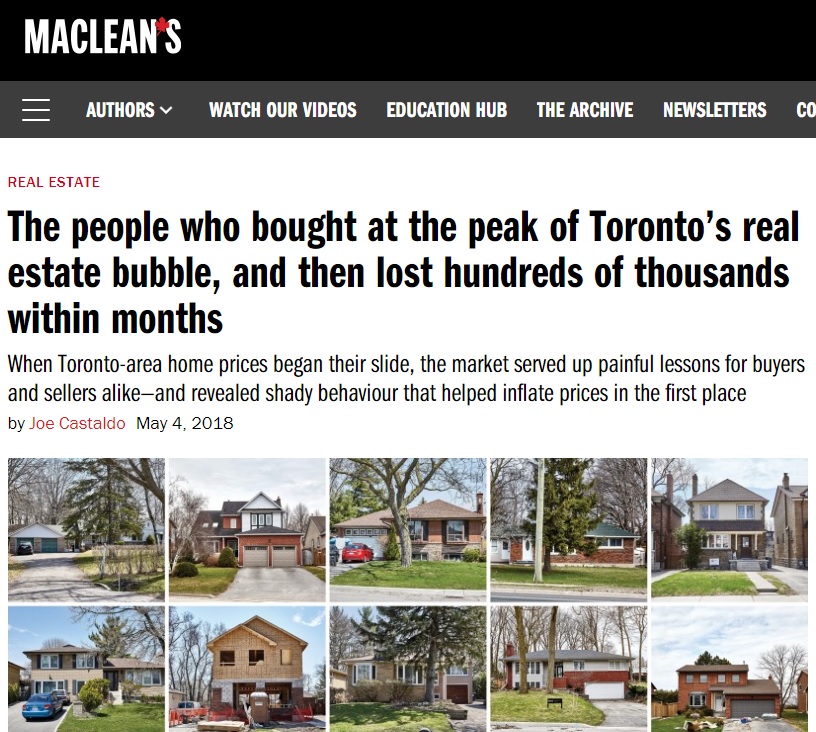
It’s sexy, right?
“Lost hundreds of thousands within months.”
Yes, a few people who bought new homes in March, and then went to sell their existing homes in May, who didn’t accept market conditions, and held on through the summer of 2017, got their asses handed to them.
But I was on those phone calls with reporters for weeks – the ones asking, “Did any of your clients buy houses and then have trouble selling their own houses months later?” And when I said “no,” they simply thanked me for my time, and moved on. Don’t kid yourselves – those stories were written before they ever put names and faces to them.
On the weekend, the Huffington Post published this:
“Ten Charts That Show How Out Of Whack Things Are In Canada’s Housing Markets”
Can anybody guess what data was used for the very first chart?
You guys who commented on Friday’s blog will be pleased…
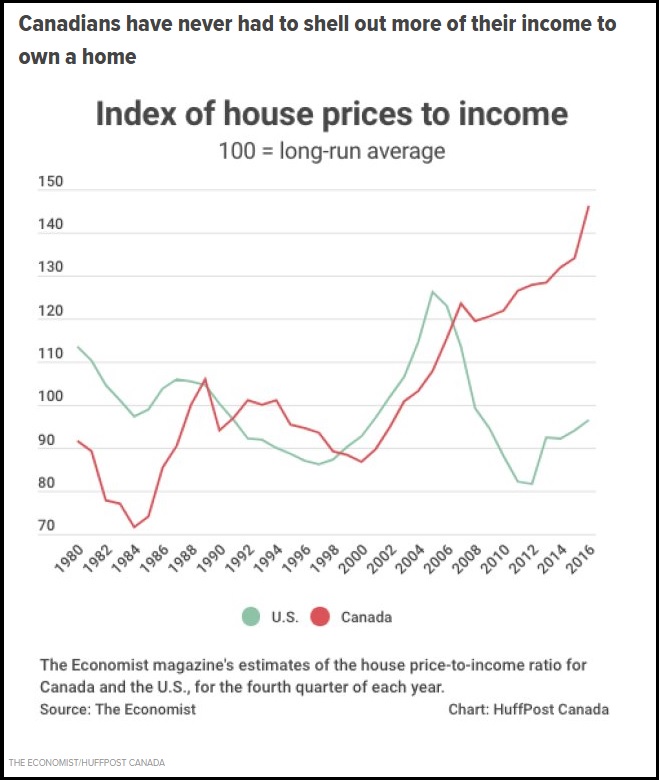
Ah, yes! Median household income! Of course!
You either buy this argument, or you don’t.
We learned that on Friday and we don’t need to take this any further.
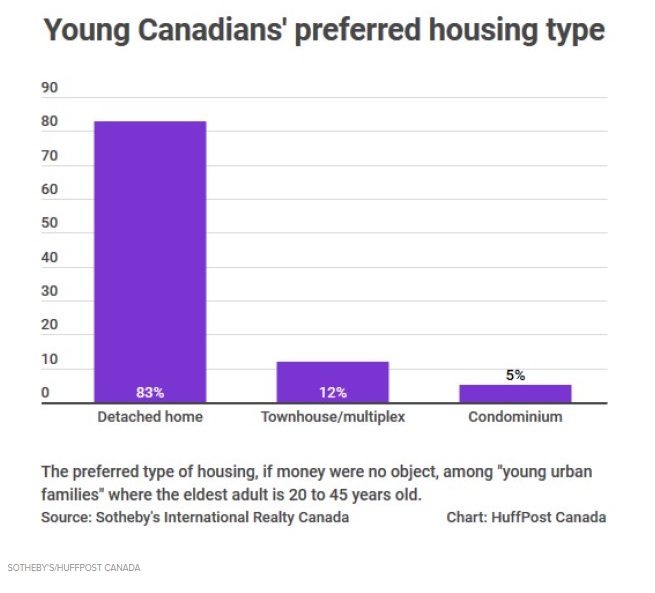
But some of the charts in this piece were a bit silly in my opinion, like this one, for example:
Really?
People want to live in detached houses? The same detached houses that are more expensive on average, larger on average, and rarer on average than any other type of real estate?
Really?
That’s so hard to believe! Who’d have ever seen these poll results coming?
That’s like…..hmmm, wow, it’s so hard to come up with an analogy….
….but I’ll keep trying……
….lemme think, um, ah, I’ve got it!
This poll is equally as surprising as if you asked a raging, hormonal, 15-year-old David Fleming, “To whom would you like to lose your virginity?” with the options:
a) A supermodel
b) The cashier at Dominion
c) A gargoyle
Yeah, wow, I dunno. Real tough call on that one, I’m not sure what I would have answered back then.
But I’m having trouble thinking, because I’m still trying to figure out why 83% of people polled would say that they want to live in the holy grail of houses, aka a detached, “if money were no object.” Real shocker!
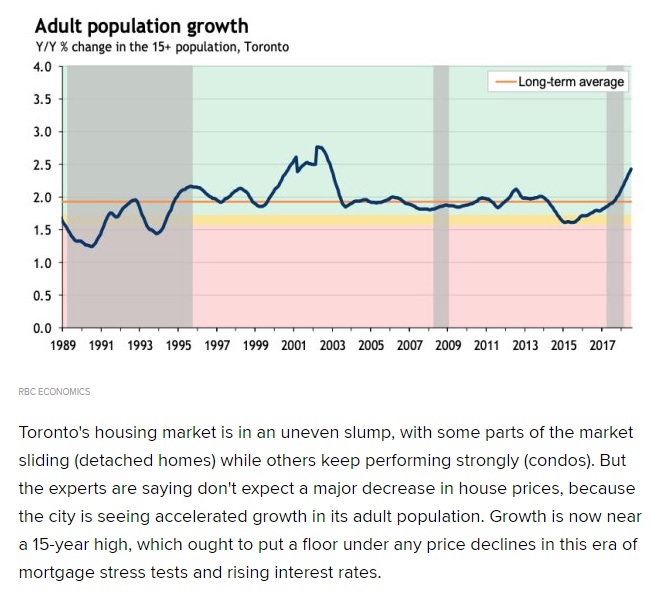
One more chart from the article that really seems to undermine the “out of whack” argument, at least as far as Toronto is concerned:
–
So if you want to talk about a housing correction in Canada, that’s another topic, and not really what we’ve been discussing here on TRB over the last little while. If you need more doom-and-gloom, this is a good read:
“This Is How Canada’s Housing Correction Begins”
For the rest of you, I would request your arguments both for and against the idea of a “market correction” in Toronto.
Happy Monday!


Appraiser
at 8:22 am
Along with the growth in the adult population, it is also attitudes and beliefs that affect demand for real estate ownership.
“The goal of homeownership was also strong among renters: 92% responded that they intended to eventually buy a home, and 59% planned to do so in the next five years.”
“…Renters also recorded the least satisfaction regarding their current home.”
https://news.shupilov.com/section/finance/zoocasa-how-do-canadians-feel-about-homeownership-and-real-estate-investments/
Derek
at 10:09 am
Has there EVER been a “correction” from one year to the next in average GTA or Toronto home prices? What years?
Eddie
at 11:36 am
Drop in average Toronto home price YOY:
1990: -6.8%
1991: -8.1%
1992: -8.3%
1993: -3.9%
This would certainly qualify as a market correction.
Derek
at 12:02 pm
It looks like the 4.3% decline in avg home price from 2017 to 2018 was less than the largest previous year to year decline, which occurred 3 years into consecutive yearly declines. It was also less of a decline than the first annual decline in that past cycle. None of the past declines were annual “corrections”.
If there had been a year over year “correction” from 2017 to 2018, it would have to be considered shocking.
Chris
at 12:16 pm
Agreed, a >10% decline from one full year to another would have been pretty surprising.
As many of us have said, real estate moves slowly. To declare the correction over, or tout a successful soft landing, seems premature.
I think we’ll have a better idea of where the market is heading come Spring.
Personally, I think we’ll see listings continue to climb, sales volumes remain depressed, and pressured sellers accept lower prices. Sure, those sellers who want to can hold out, but those who cannot be patient will set the new comp. prices.
Who knows though. My prediction could be wrong. I don’t have any more ability to see the future than anyone else here.
Appraiser
at 11:06 am
Excellent data here David. I stand corrected. Previously I declared a soft landing after a mild correction. That was imprecise.
The core experienced no correction at all, or even a decline.
The outer GTA is experiencing a soft landing.
Derek
at 11:23 am
I’m wondering how valid any declarations of soft landings or corrections can presently be about this issue. I cannot seem to find any year to year “corrections” for average prices. There are consecutive declines in history, but no year over year “corrections”.
Does anyone else see past year over year data showing “corrections”. If there haven’t been any year to year “corrections” before, the absence of one now doesn’t seem that significant or predictive. Help me out; what am I missing?
Carl
at 11:46 am
Historically, slumps in the Toronto RE prices lasted for several years. Not just one year sharp correction with fast rebound. Between 1989 and 1995 the average price dropped by something like 30%. So it was not a “correction” year over year, but it was one from the peak. I suspect the people who bought or sold houses in those years didn’t really care whether someone called it a correction or not.
Not Harold
at 12:13 pm
Overall housing is just a slower market than stocks.
The two biggest differences being that stocks mostly trade in cash rather than one off financings like mortgages, and stocks settle in T+3 while 90 day closes are standard for housing.
Then you have all the psychology wrt principal residences and the large lump sums involved.
Housing in Vegas went down hard and fast, but it stayed down for years. Toronto had a bobble for a quarter or 2 in 08 but came back very quickly because it was caused by fear of possible contagion rather than an actual issue in this market.
So 4.3% decline could be a soft landing for GTA or it could be the prelude to 4 years of pain. I’m not Tony Romo, I don’t see the future.
Derek
at 12:20 pm
Romostradamus knows all.
Chris
at 11:37 am
Let’s take a look at TREB’s published average sales prices for the 416 only, excluding the 905:
Detached went from $1,578,542 (Apr, 2017) to $1,354,719 (Apr, 2018) to $1,145,892 (Dec, 2018). April to April this is -14.2%. April 2017 to current average price is -27.4%.
Semi-detached went from $1,104,047 (Apr, 2017) to $1,021,986 (Apr, 2018) to $939,859 (Dec, 2018). April to April this is -7.4%. April 2017 to current average price is -14.9%.
Townhouses went from $793,129 (Apr, 2017) to $792,180 (Apr, 2018) to $714,456 (Dec, 2018). April to April this is -0.1%. April 2017 to current average price is -9.9%.
Condos went from $578,280 (Apr, 2017) to $601,211 (Apr, 2018) to $594,371 (Dec, 2018). April to April this is +4.0%. April 2017 to current average price is +2.8%.
If we looked exclusively at TREB’s HPI, from April 2017 to April 2018, detached HPI was -9.6%, semi -4.5%, townhouse +3.7%, and condo +12.4%.
So clearly, City of Toronto condos have been resilient, townhouses somewhat so when measured by HPI, while semis and detached homes have had declines as measured by both metrics.
Professional Shanker
at 12:46 pm
I would say Toronto condos have continued to be the 1) Choice of speculator investment capital and 2) primary benefactor of the stress tests. People cannot get financing for detached homes, their income will not support it under a +2% stress test environment.
I realize there is the believe that move up buyers will come to the rescue and sell their condos and move up but our primary lenders are not financing these additional mortgages, hence the drop in high valued sales, including core Toronto. I see this as the big headwind in the RE market going forward, people can’t afford/finance their move up!
Mortgage brokers may have a different perspective which I would like to hear?
Kyle
at 11:43 am
Now that there is a decent amount of time to look at the history, I would say there was a price correction, but if we are talking about “what” was being corrected, it was the anomalous hyper-growth experienced at the beginning of 2017. And it was NOT a case of the market being overvalued for years that caused this correction. When you look at the data below, it is clear that this correction is in direct response to the few month’s of over-valuation that occurred from Jan – Apr 2017, nothing more.
Let’s look at Y/Y price changes and you will see the pattern (small positive increases except when comparing to the Spring “spike”, then a return to small positive increases):
Oct 2017 vs Oct 2016: +2.3%
Nov 2017 vs Nov 2016: +2.01%
Dec 2017 vs Dec 2016: (0.7%)
Jan 2018 vs Jan 2017: (4.1%)
Feb 2018 vs Feb 2017: (12.4%)
Mar 2018 vs Mar 2017: (14.3%)
Apr 2018 vs Apr 2017: (12.4%)
May 2018 vs May 2017: (6.6%)
Jun 2018 vs Jun 2019: +2.0%
Jul 2018 vs Jul 2017: +4.8%
Aug 2018 vs Aug 2017: +4.7%
Sep 2018 vs Sep 2017: +2.9%
Oct 2018 vs Oct 2017: +3.5%
Nov 2018 vs Nov 2017: +3.5%
Dec 2018 vs Dec 2017: +2.1%
Appraiser
at 2:04 pm
That’s 7 months in a row of y/y increases, after 6 months of consecutive decreases.
If it looks like a recovery followed by a soft landing; and acts like a recovery followed by a soft landing…
Derek
at 3:04 pm
The trend is your friend
Chris
at 5:24 pm
Which trend?
Seven months of stabilizing YoY average price movement (one more month than the trend of consecutive decreases)?
Or the trend of there never being one single verifiable instance of a soft landing in the history of economics?
Derek
at 9:46 am
The former
crazyegg
at 2:27 pm
Hi All,
–> But I’m having trouble thinking, because I’m still trying to figure out why 83% of people polled would say that they want to live in the holy grail of houses, aka a detached, “if money were no object.” Real shocker!
To play devil’s advocate, I see the data as suggesting that 17% (almost one in five) of young adults preferring to live in higher density housing under ANY circumstances.
Maybe these millennials like the Melrose Place lifestyle…
As such, that provides me optimism that the condo market should remain robust…
Regards,
ed…
Alexander
at 3:03 pm
If money were not object I would also buy a condo in Toronto, cottage in Muskoka and villa on Mustique Island…
Alexander
at 3:16 pm
It was certainly a correction. Aurora townhouse I sold in spring 2017 was again on the market in 2018 because new owners overstretched themselves with high-interest loans. They sold in the fall and lost at least 200K and around 20% of the purchased price. I put another one on the market in the fall of 2018 trying to get summer 2018 price to no avail. Pulled the trigger just recently with 15-30K discount on summer prices as buyers are not in the rush and I do not want to hang there drying until who knows when…
Appraiser
at 4:18 pm
Location, location, location.
The “Aurora’s” and Brampton’s of the GTA saw the biggest price drops since the peak of the Spring 2017 bubble (yes I said bubble).
However, prices stopped declining some time ago.
Alexander
at 4:39 pm
I am watching the prices in 3 areas – Aurora, Bayview Village and Englemount-Lawrence and have to tell you that market direction does not look good at the moment. May be condos near Union station sell like candies, but overall my expectations of 2019 are low unless there will be some new positive development from legislative branch and banks.
Appraiser
at 4:31 pm
“We see prices in Canada’s major cities holding steady in 2019, thanks to Canada’s lowest unemployment rate in more than 40 years and the fastest-growing population in the G7″…Not welcome news for potential homebuyers, as affordability will only worsen in the year ahead”
~ RBC Wealth Management
https://twitter.com/benmyers29?ref_src=twsrc%5Egoogle%7Ctwcamp%5Eserp%7Ctwgr%5Eauthor
Chris
at 5:19 pm
“We expect that further interest rate hikes will keep upward pressure on ownership costs in 2019. Softening prices in key markets and rising household income increases will provide some offset, however.”
– RBC Economic Research
http://www.rbc.com/economics/economic-reports/pdf/canadian-housing/house-dec2018.pdf
Professional Shanker
at 6:19 pm
Not welcome news for potential homebuyers, as affordability will only worsen in the year ahead.
Certainly seems like a fear sells statements which both you and David like to point out is only used in bear news……Ben Myers trying to scare people into buying a home – it’s only going to get more expensive!!!!
RBC also in the same paragraph discusses how low interest rates went hand-in-hand with rising house prices, they are only saying don’t expect major declines in 2019, what about 2020, 2021……they are very smart and careful not to touch that.
Kyle
at 7:46 pm
https://business.financialpost.com/business-insider/a-review-of-canadas-housing-market-from-boom-to
Mark Carney pulled off a soft landing for Toronto real estate in 2008 per this article. And not surprisingly this article also contains embarrassingly bad quotes from the same old, broken record bears.
Chris
at 8:18 pm
Toronto average home prices in 2008 were still below their previous 1989 peak when adjusted for inflation. Ownership costs as a percentage of median household income were almost bang on their long-term average.
Anyone claiming there to be a real estate bubble back then was mistaken, as history would confirm. As such, I don’t think it is correct to claim that Carney pulled off a soft landing following an economic bubble.
Remains to be seen if Poloz can.
Appraiser
at 6:50 am
Huh?
Borderline incoherent.
Chris
at 7:17 am
Nope. Just because you personally struggle to understand something, doesn’t mean it is incoherent.
Read it again, slower this time. Good luck, little buddy.
Jimbo
at 12:29 am
I don’t think the market is in correction I believe it is in normal mode and is slowly adjusting to the changes in policy. I will predict that the average price when considering all housing types will be between $685,000 on the low end and $725,000 on the high end. As interest rates rise the average value will start to dip further unless they get rid of the 20% down stress test.
I find it interesting that people were taking on $700,000 of household debt repayment between 1989 and 1991. We did not hit that level of future debt repayment again until 2015. It is slowly peaking at just over $1 million dollars. If this were the US I would say these are hard numbers but because of how mortgages work here most people reset their rate after 5 years and this can have a huge impact on future debt obligations.
I don’t think people really saw $700,000 in real debt repayment as the rates dropped over the years, so it is safe to say most people that signed on to the average house with only 20% down will see future debt repayment above $1 million for that $700,000 home.
Appraiser
at 2:57 pm
Good news for investors.
“The average rent for a Canadian property rose 1.3 per cent month-over-month last month to $1,776, according to the latest data release from Rentals.ca.”
“The average rent for a Toronto one-bedroom apartment remained steady at $2,135, while the average rent for a two-bedroom apartment rose 3 per cent month-over-month to $2,577.”
http://torontostoreys.com/2019/01/toronto-rent-continues-to-top-the-tight-canadian-rental-market/
Chris
at 3:16 pm
Rentals.ca’s, a.k.a. Ben Myers of Fortress fame, is analyzing average listed/asking rent.
A 2018 report by the City of Toronto found that the average amount landlords ask for rent is 1.5 times the average amount tenants are paying (CMHC data).
1 bedroom: $1,614 vs $1,132 (43 per cent higher)
2 bedroom: $2,252 vs $1,326 (70 per cent higher)
All units: $1,829 vs $1,240 (47 per cent higher)
https://www.scribd.com/document/371163813/2018-RENTAL-HOUSING-MARKET-CONDITIONS-IN-TORONTO
daniel b
at 10:06 am
Chris, if your implication is that the asking rents are not reflective of the actual rents achieved on the units i think you’re wrong. LL’s are getting their asking rents, usually with a bidding war from tenants.
Also, in older buildings, which are rent controlled, it would obviously make sense that asking rents, which are not rent controlled, would be substantially higher.
If you were implying something else please clarify
Condodweller
at 3:30 pm
David you got my hopes up when you said you were going to define a correction! Then you go and throw it out the window. The thing about definitions is that they supposedly clearly outline or define something by drawing a line in the sand. Once you have your definition you can’t change it because you don’t agree with it or it doesn’t match your data/argument.
This reminds me of an interview on BNN where the host asked an analyst about his strategy during changing market conditions. He then asked him if he would change his strategy to match the market. I loved his response which was spot on but I think many people miss the point. His response was if I changed my strategy when markets change it wouldn’t be a strategy. I’m probably repeating myself here.
We are never going to have anything resembling an agreement especially between “bulls” and “bears” without stringent definition. Everyone cherry picks numbers to suit their theory.
As for a correction, I agree that it implies that something is wrong, even if it’s short term. We had a short term spike in the spring of 2017 which quickly corrected. However, I think it’s incorrect not to call it a correction just because we have a long term uptrend in prices. The definition reads “after a peak” and we definitely had a recent peak. So, I for one do think we had at least a short term correction: we had a peak with a higher than 10% fall short term.
The next question WRT RE is does it even matter for RE? I mean for stocks it makes sense to identify corrections as they may trigger buying/selling opportunities. Crossing a 200-day moving average to the up and downside is commonly accepted as a bullish/bearish signal. I don’t think I have seen moving averages applied to RE before but it may be a worthwhile exercise. Some people identify selling points when a stock exceeds the 200-day moving average by a certain percentage say 10% or 20%. Perhaps someone with excel skills and access to prices wants to come up with a formula and graph a 200-day moving average for RE prices.
The question then becomes which prices to use for the average? Toronto, GTA, downtown, or a block on Foresthill.
Basil
at 10:26 pm
The precursor to a crash is always irrational exuberance which has come and gone. No one is irrational buying for almost 2 years now.