

I need some help with something this morning, if you’re willing to oblige.
Let’s say there’s an epic January snowstorm that produces over 60cm of snow.
Now, let’s say that you’re shovelling heaps of snow from your driveway to your front lawn, in a futile task that feels like “five steps forward, four steps back.” All the while, your kids are pushing the snow back onto the driveway, begging you to use the snowblower so they can block the flying snow with their sleds, aka their “shields,” thereby increasing your workload twofold.
Do you consider this to be:
a) Exceptionally adorable, a moment of parent-child bonding, and the exact reason we have children.
b) Incredibly frustrating, annoying, unhelpful, and the reason we reminisce about our lack of responsibilities when we were younger.
Go ahead. I promise I won’t be hurt…
Maybe we say this every year, but I think this was the snowiest January we’ve had in a long time.
During that snowstorm on January 25th, I couldn’t help but feel terrible for my colleagues who were hosting open houses for their “hot listings,” especially those who had strategically listed their properties with offer dates on the Monday night following the weekend open houses.
Plan for the best, or plan for the worst? Now there’s a strategy!
Then again, for every piece of bad luck, surely there’s a corresponding piece of good luck as well, right?
Colleagues of mine had a hot East End listing in late January that ended up with over 100 showings booked!
They had an offer date scheduled for Monday afternoon after the weekend, where presumably they’d host two open houses, Saturday & Sunday, and have a slew of those 100 showings take place.
But on Friday night, they received an exceptional bully offer and ended up selling the property firm.
What happened next?
A massive snowstorm.
I have no doubt that the property would have still sold in multiple offers and for an amazing price had they waited until Monday, but there would have been fewer showings, less interest, and fewer offers as a result of that snowstorm. School was cancelled on Monday, so think about all those parents who were focused on their children at home, who maybe, possibly, wouldn’t have offered on the house.
I saw a lot of really impressive sales in January, but most of these were in the same market segment:
Single-family freehold in family-oriented neighbourhoods, between $1.4M – $1.6M.
Areas like Riverdale, The Pocket, Roncesvalles, & Greenwood Park, if we’re being more specific.
But my biggest takeaway from the month of January was that there was a dearth of quality inventory, as we complain every year at this time.
On Monday, January 5th, I sat down and worked the phones to try to find a house for my Leaside buyer-clients.
They were looking for something “more” than your typical 30 x 120 foot new(er)-build home, which runs $2.8M – $3.2M. I needed to find them something on a 36+ foot lot, with more square footage, more features and finishes, and a better backyard.
I called about eight real estate agents that I know, and as is the case when you’re dealing off-market, I received a call from somebody who heard from somebody that I was looking.
I took my clients to see this house, which was “floated” at $4,200,000, but it wasn’t right for us.
Would you believe that it was sold privately the very next day to somebody else?
That product simply doesn’t exist right now, and it’s not the sort of thing that you can sit around and wait to see on MLS.
Regardless of what the January TRREB stats look like in terms of prices, sales, new listings, and absorption rate, I will maintain this until I’m blue in the face:
There’s a major lack of quality inventory in the freehold market right now.
So let me run you through the January TRREB numbers as I see them, and I promise to (try?) to be unbiased.
I say that, of course, because I opened up today’s blog post by talking about a “lack of quality inventory” and being bullish in some respects, and yet for those of you who have already seen the TRREB numbers, you’re going to argue, “the sky is falling.
I’m happy to hear you out on that, but hear me out on this first: one of my trusted colleagues just said, “It’s fucking January, man. It was a goddam snowstorm of a month. You want to evaluate the market? Wait until March.”
Fair point. And as I said, I’m happy to hear yours.
So let’s start with the average GTA home price:
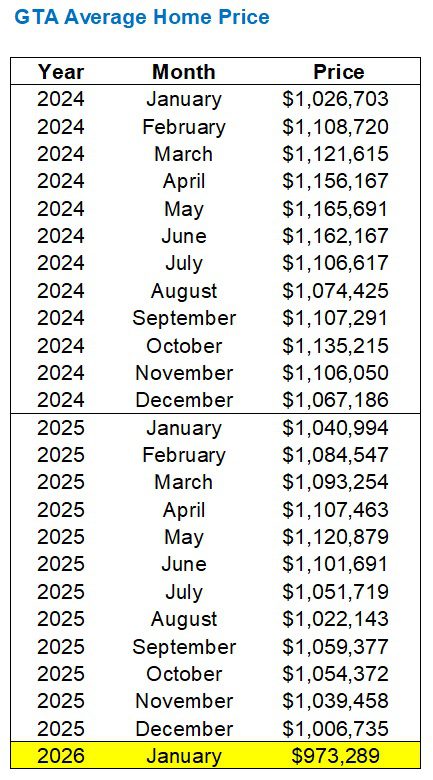
“David, how the @#%& are you going to act like the sky isn’t falling! The average home price just dropped below $1,000,000 for the first time since 2021!”
Yes, just as I said it would
It’s January.
We’ve been on a downward trajectory since the fall, and we’re in the dead of winter.
Sorry, but I have to agree with my trusted colleague on this one and suggest that maybe, just maybe, January gets a pass.
Comparing January of 2026 to January of 2025 ,we see a 6.5% decline in the average home price, which is significant.
But how does this break down by geographic location
Like this:
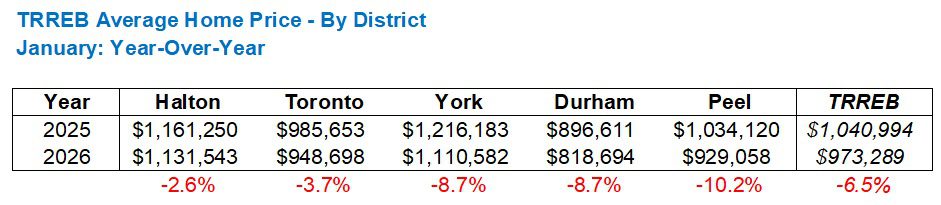
Every average is made up of several or many smaller averages, and the TRREB average home price is no different.
Peel Region has seen a whopping 10.2% decline in average home price, January over January, whereas Halton is only 2.6% and Toronto is only 3.7%, respectively.
If we want to look at the 416 (Toronto) more in depth, I would break down the year-over-year change in price by property type as follows:
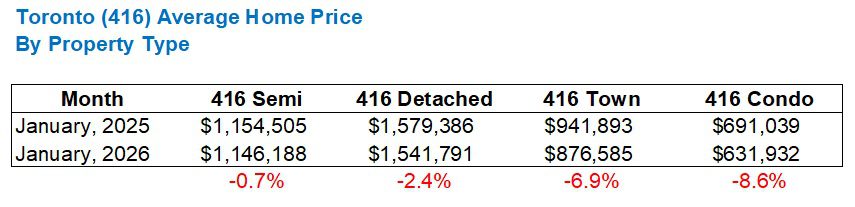
This makes sense, right?
I mean, “What is a townhouse?” would be a good question right now. For clarity, this includes both freehold townhouses and condominium townhouses, which makes absolutely zero sense to me, as I would prefer to include condo townhouses within “Condos” and freehold townhouses in a category with “Semi-Detached,” but I digress.
In any event, seeing a 416 semi-detached price that’s only 0.7% down from last year makes perfect sense and corresponds with what I’m seeing out there right now.
Again, at the risk of being too bullish, I would argue that some semi-detached houses in Riverdale, Leslieville, Roncesvalles, Greenwood Park, et al have sold better in January of 2026 than they would have in January of 2025, but if you don’t want to hear any bullishness from me, then, um, let me fix this for you…
…WOW LOOK AT THAT 8.6% DECLINE IN CONDO PRICES!
There! Now we both win.
In terms of what “typically” happens with the average home price from December to January, consider that from 2001-02 through 2021-22, we saw an increase in home prices in 14/21 years. Since then, it’s been all red data…
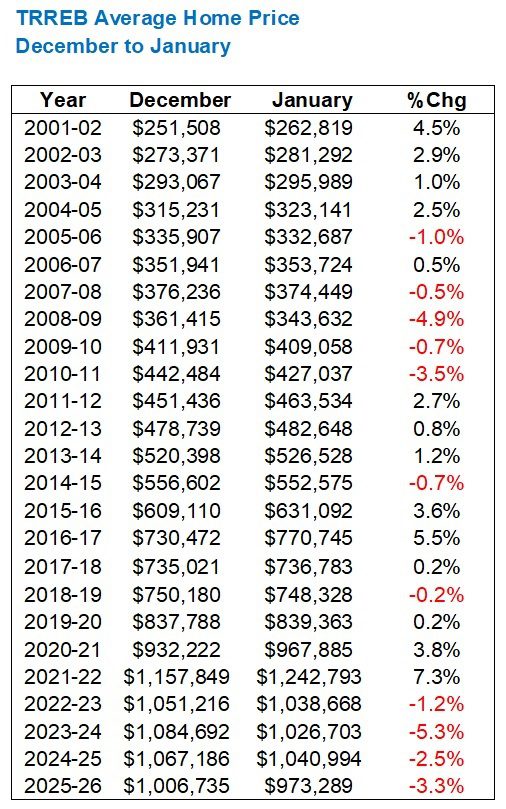
This is the fourth straight year that we’ve seen a decline from December to January, something we haven’t experienced since 2007-2010.
However, consider that the February average home price has increased over January in all of these years, so it’s not like we’re seeing a declining market that declines every single month.
No doubt about it: the February, March, and April prices will be higher. How much higher is the question…
As for sales, this next chart surprises absolutely nobody:
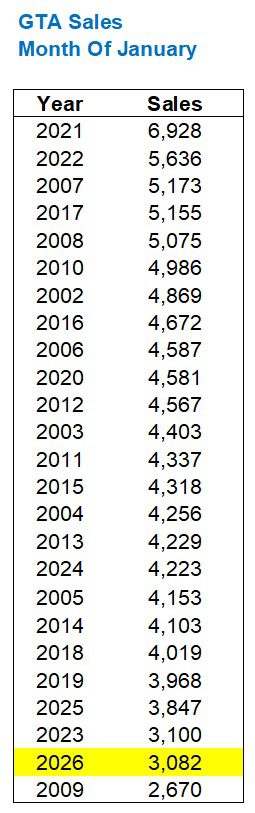
I told my team that we might see fewer than 3,000 sales.
That is how much I felt the market in every ounce of my being last month. There was simply “nothing out there,” and yet when I get to the listing statistics, many of you will want to call “nonsense” on this.
Recall that, once upon a time, TRREB published a “Re Listing” statistic. They did this for a very short while in 2023 and 2024, before ceasing and deleting the data that they had published. From what I saw in January, an overwhelming number of “new listings” were recycled listings from last year.
Having said that, there’s still no denying that sales were low.
Very low.
Sales declined from 3,697 in December to 3,082 in January, which is a decline of 16.6%.
Only once since 2001 have we seen a decline this large or greater:
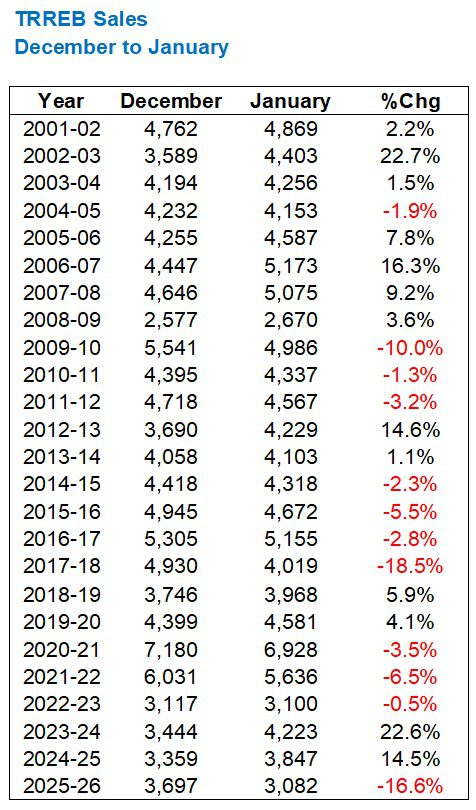
The crazy thing about sales from December to January is that you would think they should increase, but they actually declined in twelve of the twenty-four years prior to last.
Not only that, if you want to look more recently, sales have declined from December to January in seven of the prior nine years
Again, I think this speaks to the absurd number of re-listings we’ve seen over the past several years, but before I go off on that diatribe again, let’s look at the new listing figures.
Last month, we saw 10,774 new listings.
This was down 13.1% from January of 2025; however, it still ranks sixth-highest on the following list dating back to 2002:
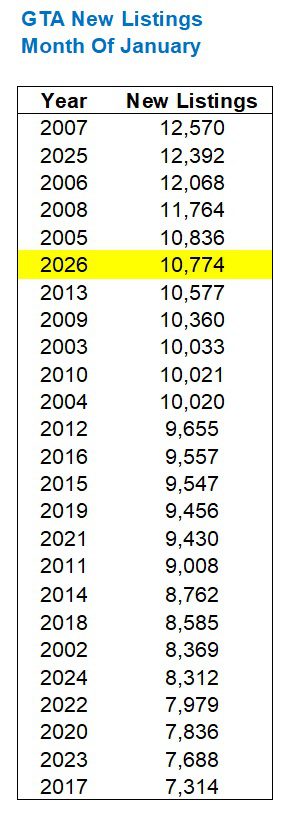
Hardly the “dearth of inventory” that I’m ranting on about, right?
You’ll just have to trust me on the quality of that inventory, plus the fact that so much of the inventory is made up of over-priced micro-condos that nobody wants.
Tell me you want a 3-bedroom, 2-bathroom semi-detached house in a family-oriented area, and I’ll tell you that options are limited, and you’re going to be in multiple offers if you want to bid.
Regardless, I still need to put a figure to the relationship between sales and new listings, which was putrid last month.
Those 3,082 sales, up against 10,774 new listings, resulted in an absorption rate of 28.6%.
This is the lowest we’ve seen in January since 2009, which happens to be the year corresponding to the only January where we saw fewer sales than the 3,082 recorded last month:
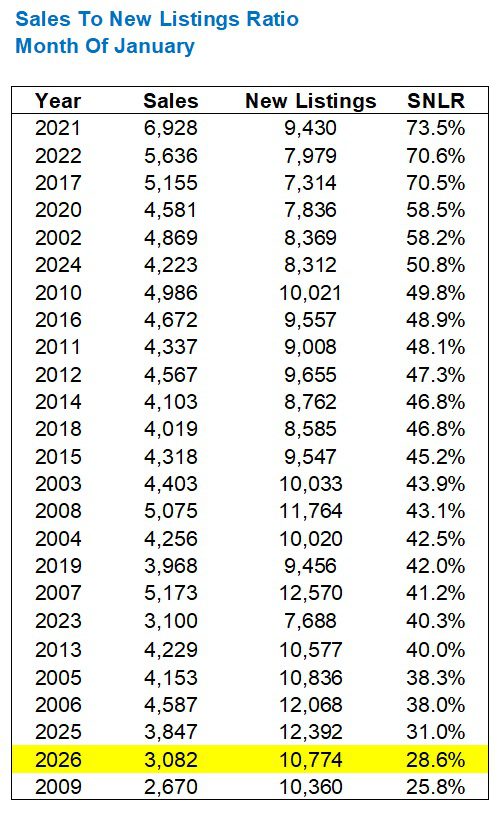
Guys, maybe my memory isn’t what it used to be, but I don’t remember the January, 2009 market.
In any event, that 28.6% absorption rate in January is moderately lower than the 31.0% recorded in January of 2025.
Not only that, it was only two years ago, in 2024, that the January absorption rate was 50.8%. My, how things have changed!
Here’s a look at the five major TRREB regions by absorption rate:
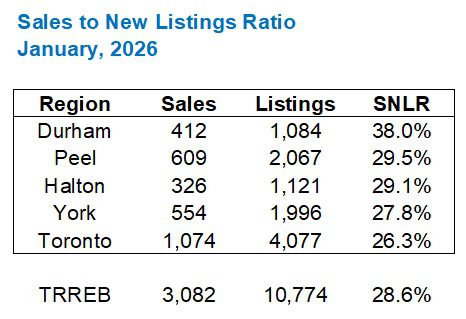
Who saw that coming?
Toronto at the very bottom?
I suspect this is because Toronto has a far greater proportion of condominiums, and the absorption rate in the 416 condo market in January was 22.5%. Perhaps this only moves the needle slightly, but enough that Toronto might not be at the bottom of the pack otherwise.
Alright, those are all the stats I wanted to share today.
Let me summarize with three points:
1) The market continues to be in a period of decline.
2) January was unusual, abysmal, and hard to use as a benchmark.
3) Some areas of the market are truly “red-hot” while others are warm, lukewarm, cool, or ice-cold.
Now it’s your turn…


Serge
at 7:57 am
If there is only trash on the market, a lot of it, and if even this trash does not sell – does it really matter, is it a freeze or thaw? Is not it time to do some soul-searching?
Just kidding 🙂
Derek
at 10:58 am
A house in my area listed early in the week, around Jan.20, for just under 2.5 and sold before the weekend open houses could occur, for just over 2.4. Good sign!
But, I feel the urge to call BS on the “Quality listings” explanation. Maybe I’m forgetting when the top was blowing off 4 or 5 years ago, and we were all talking about the market going absolutely gangbusters, like: Can you believe all of the amazing quality listings flying off the shelves. Wow! So many quality listings causing high sales and prices! The quality of these listings is just so high and the competition for all these quality listings is intense. But hold on… don’t you think these prices and sales activity are unsustainable? No! What else would you expect–the quality of these listings is just too amazing for the people to ignore. It is a tsunami of quality listings. Quality. Quality. Quality. The QL quotient was simply off the charts!
The state of the union invites… nay, demands… new prediction games. Is January 2026 the bottom in TRREB avg price? Will that price for the all of 2026 be higher than 2025. Will the Blue Jays be worse without Bo Bichette? Can Santander return to form? Can Springer get another year out of that body? Can my ADHD be controlled?
Serge
at 3:01 pm
May you forgot – Toronto used to be the new Manhatten, the center of the universe … may be, still is? The skyscrapers are still there.
David Fleming
at 10:42 pm
@ Derek
The Jays should have signed Bichette right out of the gates, but instead, they flirted with Kyle Tucker, waited three months, and then the market reset to allow guys these insane short-term deals. $42 Million per year for Bo??? That never would have happened in December.
The Jays did the same thing with Vladdy. They waited too long.
That Cinderella run was amazing, but 2026’s team won’t be the same.
Santander is a pumpkin. Slow guys who hit for low average, strike out a lot, don’t walk a lot, and clog the basepaths. That’s the worst signing in a decade.
Ace Goodheart
at 1:30 pm
Noticed the same thing here in the Bloor West Junction area. Lots of stuff sitting and being re-listed, but it’s all junk. Lots of “Toronto specials” – (huge house split up into tiny apartments, sitting on an even tinier lot with little to no parking).
A number of houses being sold with the tenants still there and obviously refusing to move (move in date for new buyer – a year from now, if the tribunal agrees to make the eviction order).
I saw one where the tenants had posted tenant rights signs on the front porch – yeah those guys are just going to leave, sure.
Also a new thing is happening- people are listing homes with prices that are less than they paid in 2021 or 2022. Often, these homes don’t sell for the reduced price (there is an example of this right now on Quebec Ave).
David is right, though. Very few good quality listings. Really one house right now that would be a nice catch for a family in this area (and Bosley has the listing). One house. It’s really dry out there.
Ace Goodheart
at 1:33 pm
Sorry, meant Clendenan Ave