

For those of you just discovering the Canadian Real Estate Association’s Home Price Index data, let me provide a bit more context.
CREA tracks the HPI for sixty areas.
This includes eight provinces (doesn’t track Manitoba, Yukon, Northwest Territories, or Nunavut), twenty-nine areas within Toronto (as discussed on Monday), and then twenty-three cities, towns, and/or metropolitan areas outside of Ontario.
It’s somewhat fitting that nearly half the areas for which CREA tracks the HPI are within Ontario, right? I mean, over 40% of the population of the country lives within Ontario.
Seven of the other twenty-three areas are within British Columbia.
Five of the other twenty-three areas are within Quebec.
Only two areas, Edmonton and Calgary, are charted within Alberta, and the other nine are spread out in the larger towns and metropolitan areas that you’d probably expect.
Today, let’s look at these twenty-three areas and see how much the “Top Ten” have declined since the peak.
Keep in mind, in Monday’s blog, we saw the #1 area drop 25.6% and the #10 area drop 22.2%!
Today’s data set is somewhat different, even though it starts around the same place…
1) Chilliwack & District
Down 24.7% from the peak:
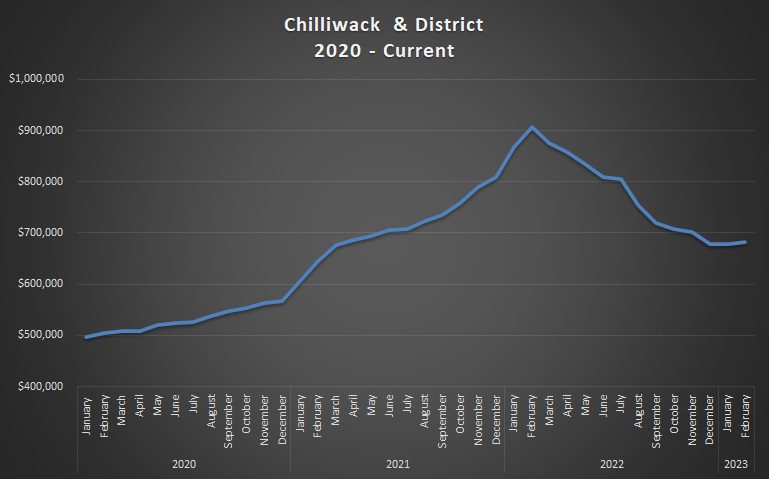
Chilliwack was a Canadian rock band that gave us, among others, hits like “Fly At Night.” The lead singer’s voice reminds of Neil Young. They also sang “My Girl,” known as “Gone, Gone, Gone,” in the 1980’s when they seemed to go retro.
Chilliwack is also the area outside of Ontario where the CREA HPI has dropped the most since the peak, which in this case, took place in February of 2022.
Prices rose 82.4% from January of 2020 through February of 2022, and have declined by 24.7% since that peak was reached.
–
2) Fraser Valley
Down 21.2% from the peak:
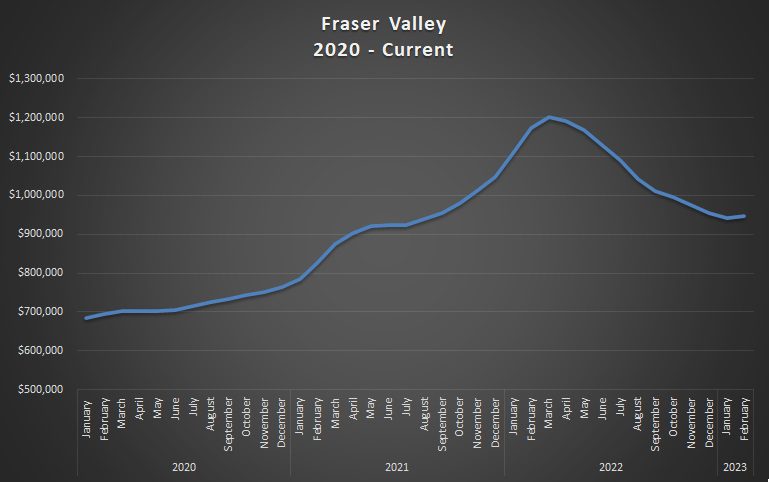
The rest of these curves have a “smooth” peak as opposed to the aggressively pointed one like with Chilliwack, but that just speaks to how quick the market there ascended and declined.
The HPI increased by 75.7% from January of 2020 through the peak.
–
3) Lower Mainland
Down 14.6% from the peak:
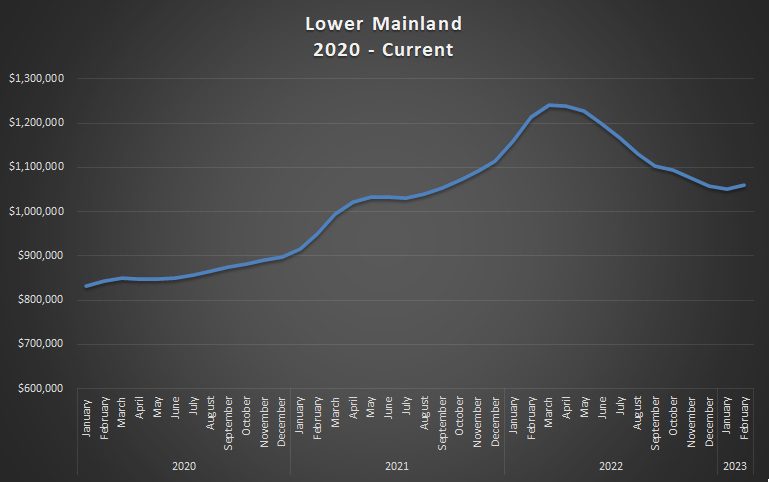
Note that the third highest on our list is “only” 14.6%.
This compares to the third highest on Monday’s list, for areas within Ontario, which was 25.1%.
This is about the time we realize just how hard Ontario has been hit since the peak in 2022.
It’s worth noting that the HPI increased by 49.3% from January of 2020 through the peak, which would have placed it near the bottom of Monday’s list, but is insignificant here.
–
4) Vancouver Island
Down 14.1% from the peak:
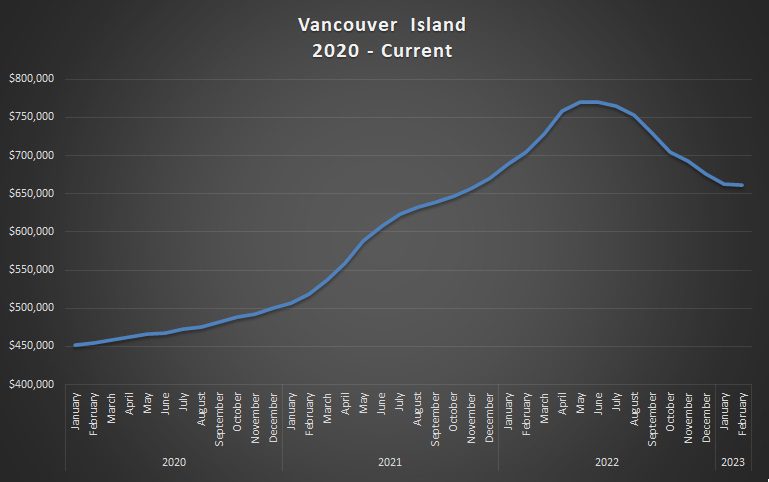
Notice a pattern here?
This is the fourth area in a row located within British Columbia.
The HPI in Vancouver Island increased by 70.7% from January of 2020 through the peak, which took place in May here. More on that later!
–
5) Interior B.C.
Down 13.2% from the peak:
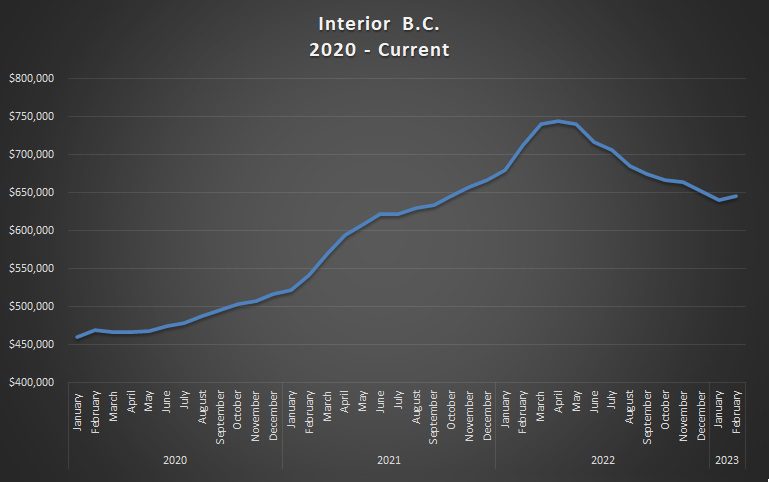
Rounding out the top-five is yet another area from within British Columbia.
Only down 13.2% since the peak, however, after a 61.9% run-up from January of 2020 through the April peak.
–
6) Fredericton
Down 13.1% from the peak:

Finally, we’re out of British Columbia!
And doesn’t this curve look different from what we grew accustomed to seeing on Monday?
Only a 13.1% decline since the July peak. Wait, July? The HPI peaked in July? More on that later, as I said above…
–
7) Victoria
Down 12.9% from the peak:
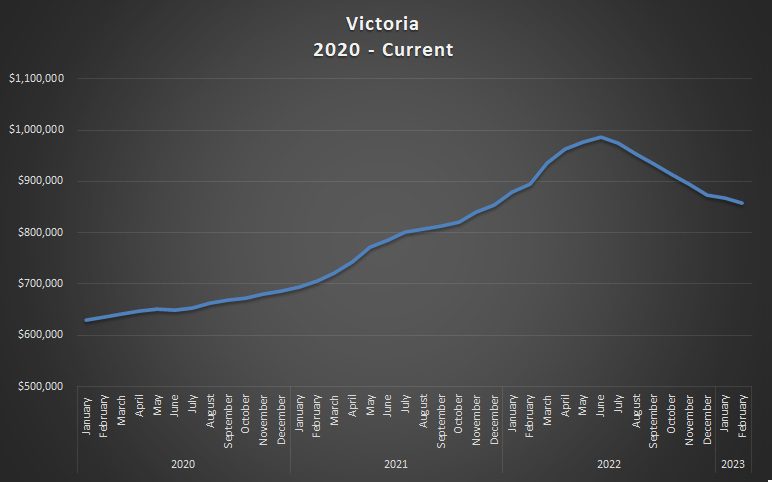
Back in British Columbia once again, this is the sixth area to make the top ten.
The peak here came in June of 2022 after a 56.5% increase from January of 2020.
–
8) Halifax – Dartmouth
Down 11.6% from the peak:
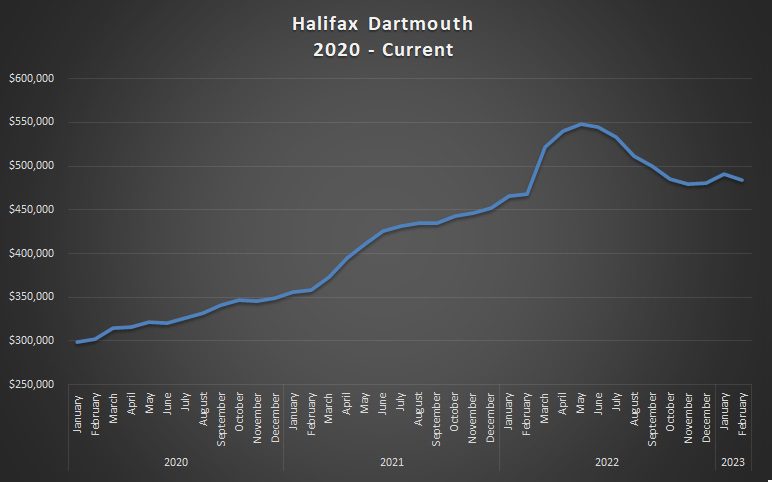
Look at that incline that took place from February to March of 2022, wow!
So while our market in Toronto was declining, the market here skyrocketed.
The HPI in Halifax Dartmouth increased by 83.0% from January of 2020 through the peak, which is second-highest among the twenty-three areas outside of Ontario,
–
9) Greater Vancouver
Down 11.2% from the peak:
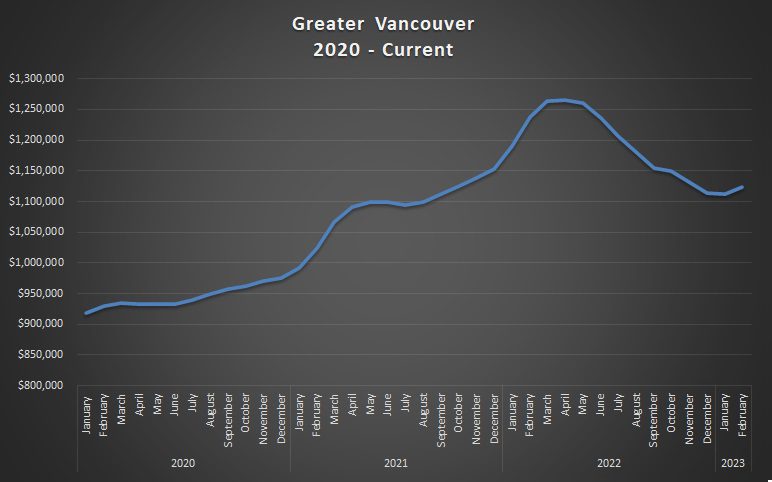
Seven of the top nine areas are within British Columbia.
Notice a pattern?
Ontario and British Columbia both got hammered, although every single area in Ontario, out of twenty-nine, declined more than the 11.2% decline we see above in Greater Vancouver.
Amazingly, prices in Greater Vancouver only increased by 37.8% from January of 2020 through the peak.
–
10) Edmonton
Down 10.9% from the peak:

Rounding out the top ten is Edmonton, which saw a 21.0% increase in HPI from January of 2020 through the peak in May of 2022.
Note the drop in value in late-2021. This is the only area noted in the top ten that saw the HPI decline during that time.
–
Phew!
So that’s the top ten, but as dry as that potentially was, it’s really a means to an end.
I think the take-away here is this: Ontario was hit way harder than the rest of the country.
And if we kick aside Nova Scotia, Newfoundland & Labrador, and Prince Edward Island (sorry, just for now!) and look at the five larger provinces, we can clearly see the difference:

Saskatchewan has barely moved.
Alberta and Quebec are relatively flat.
But Ontario and British Columbia show major increase sand decreases.
In fact, if we look at all eight provinces together, we once again see that not only was Ontario hit the hardest, but the rest of the country paled in comparison:

Is this a matter of, “The quicker they rise, the harder they fall?”
I don’t necessarily think so, although it seems that way.
But then what about, “The faster they recover?”
And what about the net result? What about how much the market is up since the start of 2020, including the ascent and decline?
If we look at the eight provinces in this regard, the results shouldn’t be unexpected:
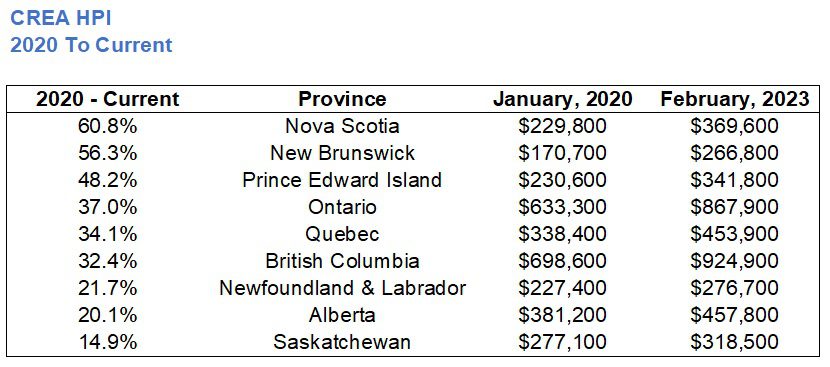
Sure, Saskatchewan only shed 4.9% from the peak, but they’re only up 14.9% from the start of 2020.
Ontario is down 19.8% from the peak but is still up by 37.0% from the start of 2020.
For those that have owned their homes for longer than three years, they likely don’t care about anything but the net. That is, if they care about any of this at all.
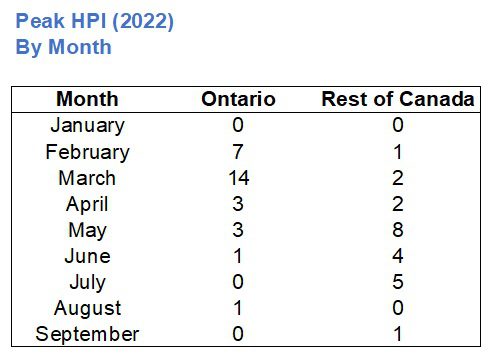
I mentioned above that there was more to be discussed about the “peaks” for each of the twenty-three areas outside of Ontario, and I think this is very interesting.
14 of the 29 areas in Ontario saw a peak in March of 2022.
2 of 23 areas outside of Ontario saw a peak in March of 2022.
It’s crazy!
In fact, the areas outside of Ontario peaked way later:
What does this mean?
Did it take longer for buyers and sellers in Winnipeg, St. John, and Victoria to adapt to the changing interest rate environment? Or did they hang on to their boom markets a little while longer?
The peak in Toronto came in February and while March was only off by a small margin, the decline started in April and well into May. But in the areas outside of Ontario, the peak came in May for the highest number.
Does Ontario lead?
Does Toronto lead? Is that what our takeaway is?
Much has been made in the past about the Vancouver market; how it’s more inflated and/or more expensive than Toronto (or more unaffordable, if you’d like). But that doesn’t necessarily mean that Vancouver leads the way as far as Canadian real estate goes. I’ve always maintained, and always will, that the heart of the market is here in Toronto.
Hardly unbiased, right?
But I will also maintain that, despite what happens in the rest of the country, our market here in Toronto is about to pop.
And it looks like the media is paying attention:
“Big Mortgages, Few Listings, And Fierce Competition: Welcome To THe Spring Housing Market Of 2023”
Through two days “post March Break,” we’re seeing an increase in inventory, thank God. But there can still only be one buyer for each property, so all this simply means is that we’ll have more sales. But on a relative basis, we’ll have way, way more disappointed buyers.
Hang on to your hats, folks! The red-hot spring market is about to begin…


cyber
at 7:57 am
And of course, the linked story highlights one of David’s favourite topics – (un)realistic buyer expectations… I chuckled at the still-childless couple who moved to NB and is living with his parents while looking for the “perfect renovated 4 bedroom starter home in a convenient kid friendly neighbourhood” for 3 years (!), while her own younger sister successfully became a homeowner by adjusting expectations from a small detached to a condo in Oshawa and picking up some extra side gigs to be able to afford on her own.
Heaven forbid the still-non-existing 3rd child might need to share a bedroom! Or that upgrading from a slightly smaller, 3 bedroom home at that time is an option that’s somehow impossible.
Just like there’s social media and gaming limits use limitations for kids in Asia, maybe there should be HGTV limits for North American non-homeowners…
David Fleming
at 9:25 am
😂
Ace Goodheart
at 10:17 am
This is hands down my biggest complaint as to how Ontario (and in particular Toronto’s) housing market is portrayed in the media.
Every time I read another media story about the impossibility of first time buyers to purchase real estate, I want to pull my hair out.
The focus is ALWAYS on young, poorly financed buyers, who are attempting to completely side step the usual “real estate ladder” and obtain for themselves, at a completely unreasonable and artificially low price, a large, detached or semi detached, fully renovated and cream of the crop house in one of Toronto’s most coveted neighbourhoods.
If they are not able to do this, then they want immediate government intervention, they want taxes on everyone other than them, they want houses that people have worked themselves up the ladder to be able to afford, and have worked for decades to pay off, to be basically given to them for almost for free, and they want all this to be done, for them only, by either the Federal or Provincial government.
What they don’t understand is that a fully renovated house in a prime Toronto neighbourhood is a “move up” house. No first time buyer will ever be able to purchase these houses. They are always purchased by people who have been in the property market for a while, who have started out in a condo or a house in a less affluent area, have built equity, and who can afford a large down payment.
The news media just either does not understand this, or is willfully blind to it (I think it is more of the latter). So you keep getting these stories about the poor first time buyer who could not afford a $2.0 million dollar fully renovated semi in the Annex, that they just had to purchase because they really don’t want to live in a condo….
So the government has to help them. To purchase a “move up” house. That they could never afford, and that the owners did not purchase on first instance (they were move up buyers, they always are – if the house is renovated and therefore attractive to young, first time buyers, then it is being sold by a move up buyer).
Why does the media never report on this? It is basically “fake news” (I hate that term, because it invokes conspiracy theories, but that is really what it is).
Bryan
at 1:52 pm
I always find the craziest part of these stories to be the fact that if these people had instead bought what they could afford 3 years ago, it probably would have appreciated enough that they could have generated a large enough down payment to afford what they wanted by now…. or they would have discovered what they actually needed was somewhere in between.
Appraiser
at 8:28 am
Interesting quote from the article: “A year after the rate-hike cycle began, housing affordability remains near record lows, with costlier mortgages largely erasing the effect of lower home values. Federal lending rules are amplifying the impact of higher mortgage rates, further hobbling borrowers.” https://www.theglobeandmail.com/investing/personal-finance/article-canada-housing-mortgage-market-spring-2023/
As David’s charts clearly illustrate, prices are still well above the pre-pandemic era yet the current prime lending rate is 4.25% higher than a year ago.
Appraiser
at 9:04 am
Regarding the level of housing demand in Canada: “Canada’s population was estimated at 39,566,248 on January 1, 2023, after a record population growth of 1,050,110 people from January 1, 2022, to January 1, 2023.
This marks the first 12-month period in Canada’s history where population grew by over 1 million people, and the highest annual population growth rate (+2.7%) on record since that seen for 1957 (+3.3%).” https://www150.statcan.gc.ca/n1/daily-quotidien/230322/dq230322f-eng.htm?HPA=1&indid=4098-1&indgeo=0