

Can you believe it’s been three months already?
Hard to fathom that the last time we looked at these rental statistics, summer was just underway…
In a similar fashion, every time I go to the dentist, without fail, I remain amazed by the concept of my next visit.
You finish your cleaning, get your care package of toothpaste, floss, and a new toothbrush, and you head out to reception to book your next cleaning.
“Three months from now….,” the receptionist says, “….lemme see…..hmmmm…..that’ll be January.”
January? Like, of next year? 2023?
The concept is just so foreign!
You know what I mean? It’s like, you get your teeth cleaned on March 28th and then you’re told, “We should book for the first week of July.”
But here you are, dripping salty slush from your winter boots on the porcelain tile, bundling up to go back into the cold, and you’re being asked about July?
So hard to fathom!
And yet even though I’ve been going to the dentist as an adult for over two decades, each and every time I check out with the receptionist, I go through the same mind-exercise with respect to the timing of my next visit.
Of course, then when you actually attend the next visit, you look backwards; “Was I here at the end of June?” you think to yourself. “Geez, I was just getting ready for summer!”
When I sit down to go over the downtown Toronto rental stats, my mind runs through the exact same exercise.
We ran this feature in the first week of July, and yet it seems like yesterday. I can actually picture those blue, yellow, orange, and grey lines on the graphs. In my mind’s eye, that grey line from 2020 still stands out, and it’ll do so until we drop the year “2020” about 5-6 years from now…
I haven’t had all that many rental listings this year.
Typically, I only list rentals for clients when their tenants leave. And it seems, thus far in 2022, not a whole lot of tenants have vacated!
I did have one rental listing last week, however.
We listed the property for lease on the Thursday before the long weekend, and by Friday, we had five offers.
I felt bad for the tenants and the agents involved, however. I couldn’t exactly check references and employment over a long weekend, since I obviously needed to speak directly to “Kathy from H.R.” or whoever signed the employment letters provided by the prospective tenants. This meant that the individuals who made offers had to wait until Tuesday.
Mostly everybody understood.
One agent, however, submitted an offer at 11:00am on Saturday and provided an irrevocable date of 5:00pm on the same day.
I told him, “I need until Tuesday to check employment,” to which he responded, “No you don’t. There’s an employment letter attached.”
I explained that the employment letter could have been made in photo-shop, and that’s why we always speak to the person who’s name is on the letter, whether the letter is from Bell Canada, TD Bank, or Joe’s Auto.
“Are you calling my client a con-artist?” the agent asked me.
“No, I’m not,” I told him. “But whether the employment letter is from a well-known company or some sort of XYZ Corp, I always check employment, and that’s a hard stop.”
He replied, “Well, you’ve got until 5pm, my friend. My client is a triple-A tenant and your landlord would be lucky to have him.”
I never heard back from the guy.
We leased the condo on Tuesday morning after checking references and employment for the other four prospective tenants.
My landlord-client turned down a higher offer to accept an offer from a “better candidate.”
Here’s where my jaw always tightens up when I explain the idea of “candidacy,” since it’s a touchy subject.
I have absolutely, positively no doubt that discrimination exists in our rental market, but I don’t personally believe that this extends to a concept of “financial discrimination.”
If a prospective tenant offers $2,450 per month, with 6-months of rent up front, has a credit score of 832, and makes $112,000 per year at a job that he or she has been at for five years, then this is a “better” offer than the one received from a prospective tenant offering $2,500 per month, with 2-months of rent as a deposit, possessing a credit score of 660, and making $7,000 per month as a freelancer.
But when tenants are rejected in this market, their first thought is often that it’s about something else.
The tenant we chose provided a letter that explained who he was, with a biography, and a description of his hobbies and interests. He felt like somebody who would take care of my client’s condo, who was responsible and respectful, and who also happened to be very well qualified.
Two of the three agents representing the tenants who did not get the unit called to ask why.
What can I say?
There was a “better” candidate.
Let’s have a look at our rental stats from Q3 and see how the market looked in the summer.
Here are the new lease listings for condos in the downtown core, specifically C01 and C08:
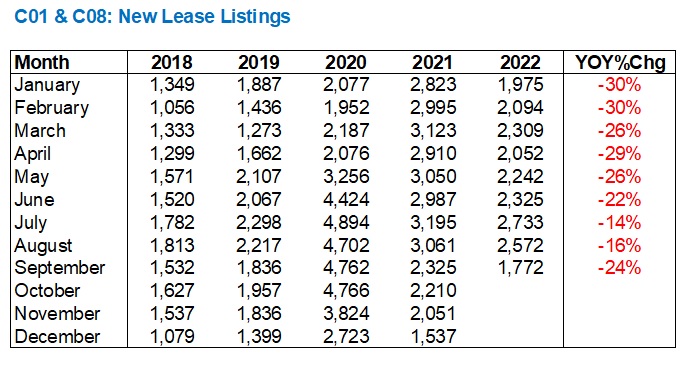
Q1 and Q2 saw huge year-over-year declines in inventory, averaging a 27.2% decline from January through June.
But last quarter saw a mere 18% decline, year-over-year, which means that inventory was decreasing at a decreasing rate. Say that, three times fast…
Nevertheless, September saw only 1,772 new listings which is actually fewer than we saw in 2019.
I’ve only had nine lease listings so far in 2022, compared to something like 2020 when I had twenty-four. Of course, 2020 was the pandemic year, and people were moving out of their homes in the middle of the night, dropping the keys at the concierge, and disappearing. So comparing to 2020 isn’t a great comparison.
But the feeling I get when I look at my own client base is that tenants are staying longer. There’s not nearly as much turnover among my investor-clients’ tenants.
Seeing a September listing figure that’s the lowest of 2022 is quite shocking. I mean, it’s lower than January!
Let’s plot this graphically:
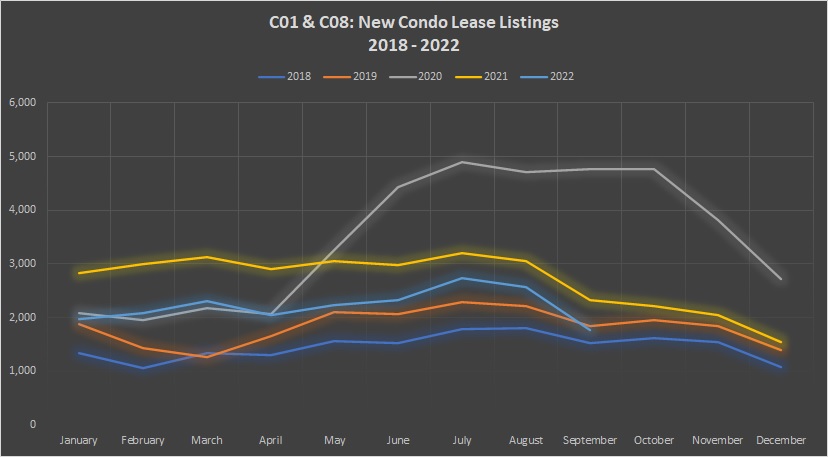
I almost want to take the 2020 data out of these graphs since it feels like a distraction, but my OCD simply wouldn’t allow for that.
As you can see, the light-blue line representing 2022 drops below both 2021 and 2019 by September.
We’re still above the September data point for 2018, but seriously, how long ago was 2018 in real estate years? That was four years and thousands of new-condos ago…
When we look at condos leased, we see a major pickup in activity:

Sure, the figures are still red.
But while condos leased are down, year-over-year, they’re down at a much lower rate than in previous months.
Q1 saw an average 35% decline from the same period in 2021.
But activity picked up significantly in Q2, with an average decline of only 18%, and that continued into July, August, and September.
September saw 1,444 condos leased, which is only 12% fewer than in September of 2021.
Of course, with inventory down 24%, and units leased only down 12%, that means our absorption rate is increasing. More on that later.
Here’s how the data looks graphically:
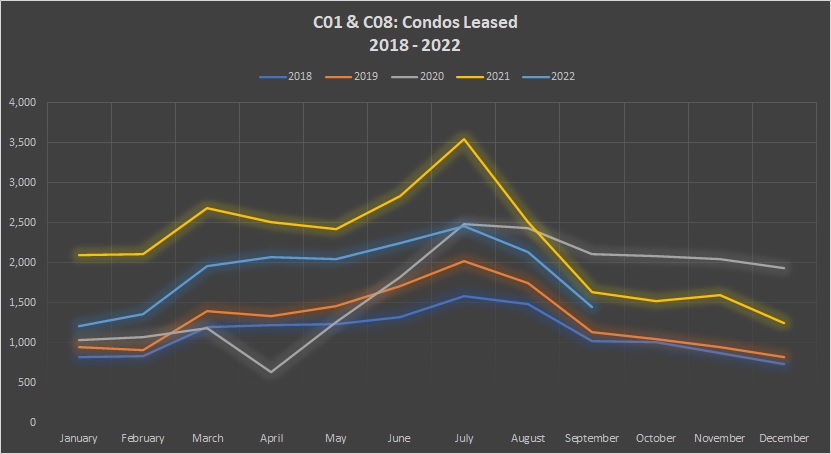
We saw more condos leased in September of both 2020 and 2021, but again, you have to consider the inventory levels have declined as well.
As I said, I received five offers to lease on my condo listing last week, but only one prospective tenant could lease the property. If there was more inventory available, we’d see far more properties leased.
When it comes to the absorption rate, it wasn’t nearly as dire as I predicted in this space back in July:0
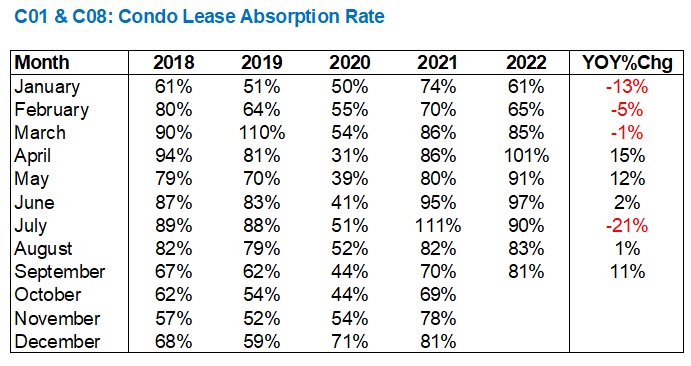
Q1 saw a decline in absorption rate, which was really unexpected. Starting with a huge 13% drop in January, the figure slowly levelled out through the rest of Q1 before we transitioned to a tighter market and an increase in absorption rate by Q2.
After the June data showed a 97% absorption rate, I predicted we’d see over 100% by July.
I was wrong.
In fact, we only saw a 90% absorption rate, which was a huge 21% decline from July of 2021.
Only seeing an absorption rate of 100% or greater twice in the previous 4 1/2 years, it’s a lot to try and predict such a figure. But from what I was seeing out there in the rental market, it felt like a certainty.
And now here we are, suggesting that an absorption rate of “only” 90% shows a slower market.
August and September saw year-over-year increases in absorption rate, of course culminating with that 11% increase in what was a surprisingly busy September.
Take the pandemic-affected 2020 out of the equation if you’d like, and you’ll still see that absorption rates on the whole are increasing dramatically.
67% in 2018, 62% in 2019, up to 70% in 2021, but now 81% in 2022.
This is the problem in our rental market; there are too many prospective tenants for too few properties.
Here’s the absorption rate graphically:

The fact that we’re seeing that light-blue line atop all others in the month of September cannot be understated.
We just passed through the tightest downtown rental market on record.
For anybody who secured a condo rental in September, congratulations. I’m sure it wasn’t easy,.
And for anybody who tried and failed to secure a rental, that graph above tells you why.
I’ve heard from a few different people that condominium developers are being extremely cautious out there right now. Future condo projects are few and far between, many existing projects are facing uncertainty, and it seems like nobody is buying land.
This is going to result in a major shortage of condo completions three years down the line, and beyond.
And that, given how many of those new condos end up as rentals, is going to put further pressure on the rental market down the line as well…


Condodweller
at 2:30 pm
crickets. Interesting.
I didn’t get a chance to comment but I totally get the point about passing time. I’m like that with Christmas. Each year Christmas seems to come sooner. I sometimes joke in January that Christmas is only 11 months away. When something happened a “while” ago I have trouble telling if it was 2 years ago or 20 years ago. I clearly remember when the loonie replaced the dollar bill and that was 25 years ago. I couldn’t believe it. It came up in a random google search.
Gloria T Garry
at 6:53 am
To be sure, Toronto’s core is slowing as well. The average days on market for a property edged up to 15 in April from 13 in February, with active listings up 69.9%. And the median price leveled off in April from March.
Best Ceiling Drywall Installation company in Scituate MA