
That’s an odd title for a blog that’s referencing 2025 statistics, isn’t it?
Well, if a broken clock is right twice per day, then this blog title makes sense during three of the four iterations each year.
At the end of every quarter, we take a look at how the GTA condominium market is performing, specifically looking at listings, sales, and absorption rates in both the 416 and the 905.
While we’re already through January and we have some of 2026’s data in the books, I want to see how 2025 finished up.
Perhaps this is a sign of things to come?
If you remember how 2025 started, you might recall that new condo listings skyrocketed!
January’s listings in the 416 were up 32.9%, year-over-year.
February’s listings were up 5.8%, year-over-year.
And March’s listings were up 22.6%, year-over-year.
But that trend, amazingly, reversed into Q2 as we saw year-over-year declines in listing activity in April, May, and June.
Here’s how 2025 finished up:
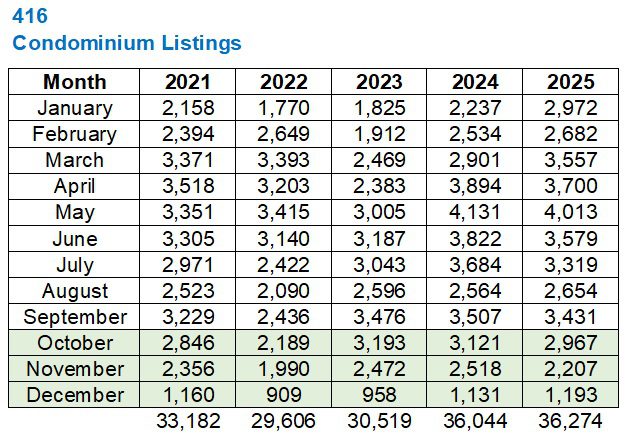
New listings were down 4.9% in October and 12.4% in November, but up by 5.5% in December.
All told, we saw the highest number of new listings in our selected five-year period, but only up by 0.6% over 2025.
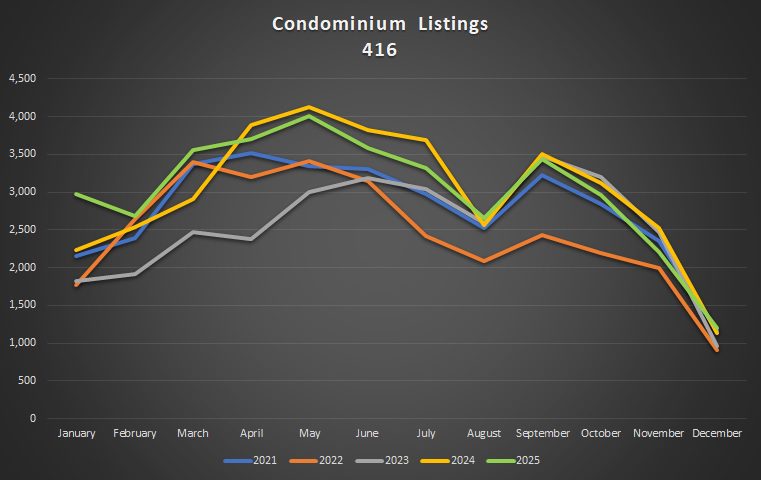
The following chart highlights how 2025 started and how it ended:
In the 905, the increase in new listings was far more pronounced!
We started 2025 with year-over-year increases of 63.5%, 11.2%, and 38.8% in January, February, and March, which were effectively double the increase that we saw in the 416.
While the 416 saw seven out of twelve months where new listings declined on a year-over-year basis, the 905 only saw three such months: September, October, and November:
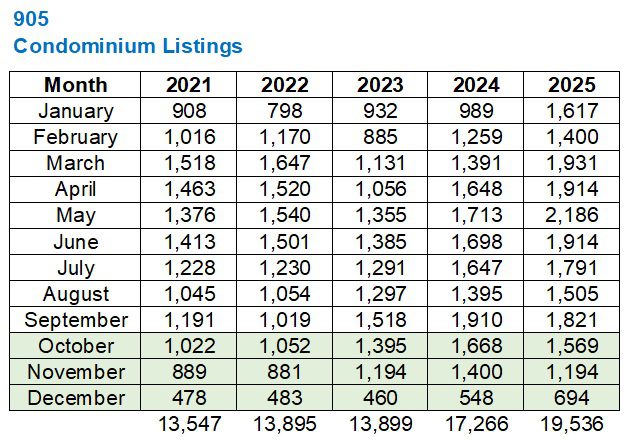
And while new condo listings in the 416 increased from 2024 to 2025 by only 0.6%, we saw a respective 13.2% increase in the 905.
The following chart speaks volumes about how the 905 condo market looked in 2025:
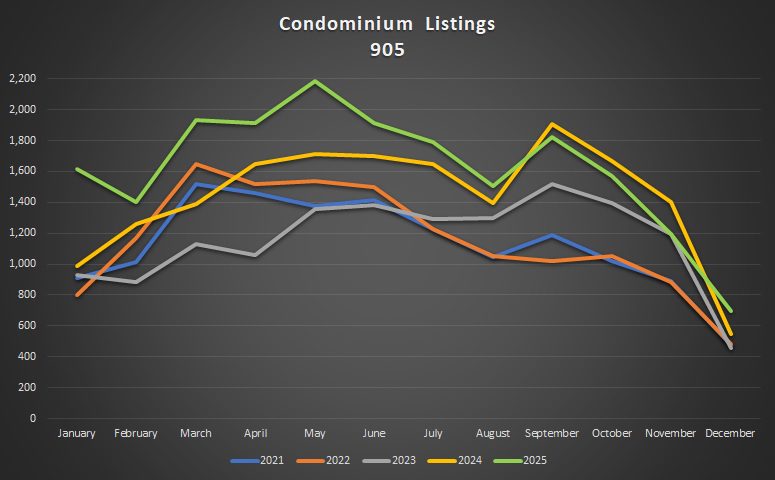
That’s what you might call “off the charts.”
At least, for the first half of the year.
When it comes to unit sales, the declines in both the 416 and 905 are quite pronounced on a year-over-year basis, but especially as we look back toward the market “peak” in 2021 and 2022:
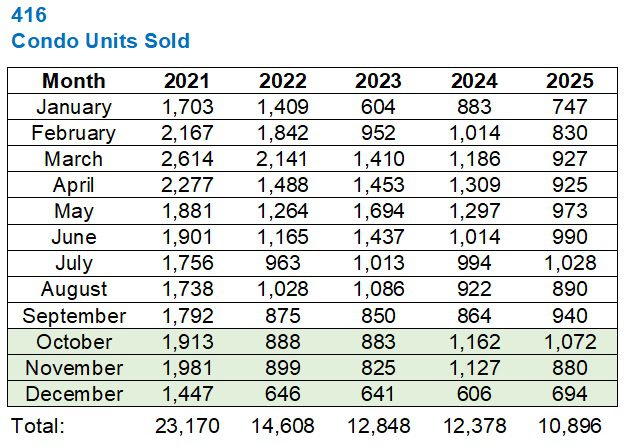
Let me save your eyes for a moment: the only months during which we saw year-over-year increases in unit sales were July (3.4%), September (8.8%), and December (14.5%).
I suspect the increase during December was a case of people searching for deals. While this happens every December, I believe that far more people felt that we had “reached the market bottom” in December of 2025 than in 2024 or 2023, thus the increase.
In fact, we saw more unit sales in December 2024 than all of 2022, 2023, and 2024.
Overall, those 10,896 unit sales are 12.0% lower than the 12,378 sales in 2024.
But nothing can hold a candle to the absurd condo market in 2021, which sticks out like a sore thumb on this chart:
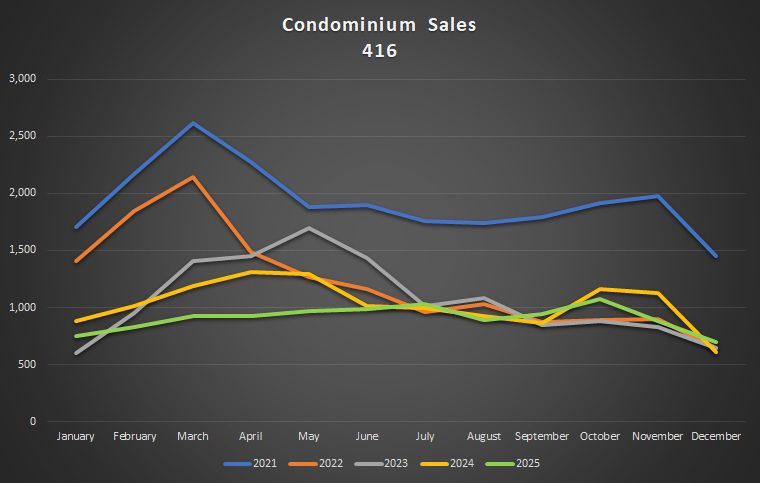
Another thing that sticks out to me: how consistent the monthly sales were in 2025.
Every other year shows monthly volatility, but sales look so consistent for the first nine months of 2025.
As we move into 2026 and remove 2021 to make room on our chart (like taking a ring off the Stanley Cup when you add another!), these numbers are going to blend together a lot more!
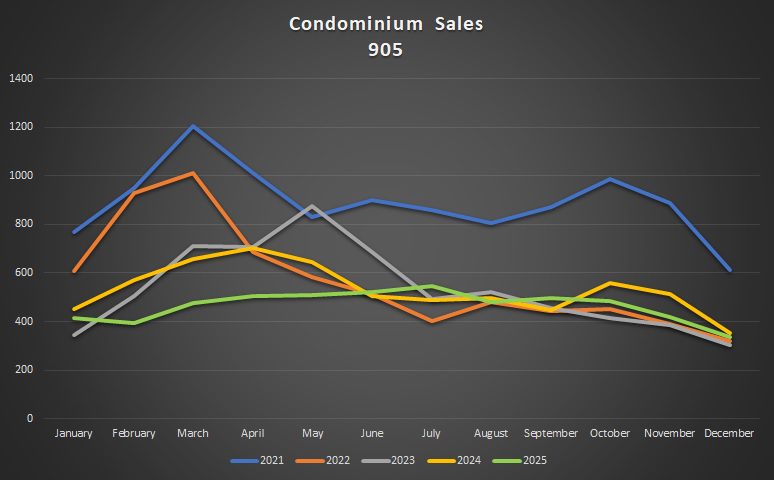
Looking at sales in the 905, you might think we’re going to see a far weaker market than in the 416.
But what I concluded was that sales activity in the 416 and 905 wasn’t all that different, but rather the difference was with respect to new listings.
For example, we noted above that the 416 saw three months in 2025 with a year-over-year increase in sales from 2024: July, September, and December. But in the 905, we also saw three months with a year-over-year increase in sales: June, July, and September:
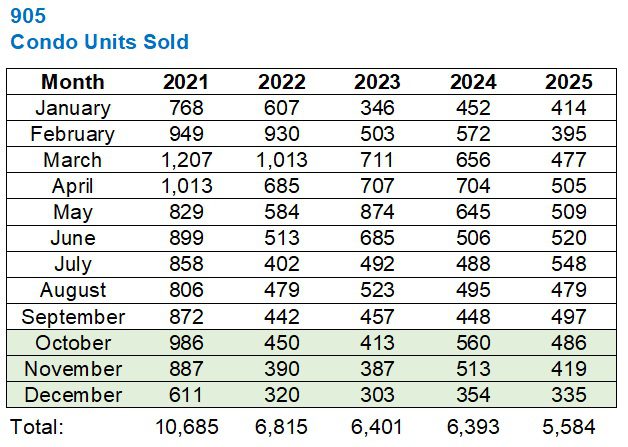
We also noted that the 10,896 sales in the 416 last year were 12.0% fewer than the 12,378 sales in 2024.
In the 905, the 5,584 sales in 2025 were 12.7% fewer than the 6,393 recorded in 2024.
These markets essentially moved in tandem, at least in terms of sales.
Not only that, the lime-green line below looks quite similar in the 905 as it did in the 416, save for the 416’s September spike:
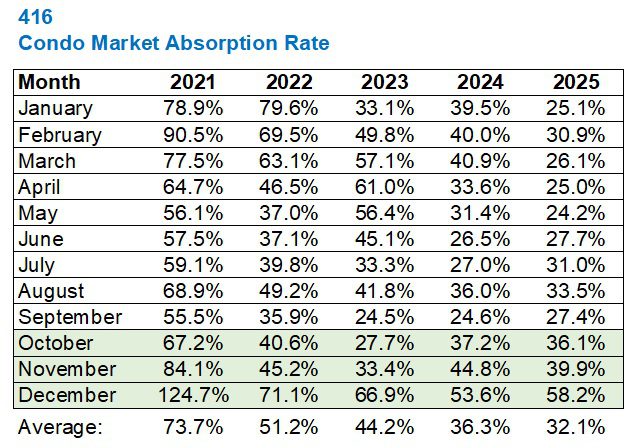
This brings us to the ratio of sales to new listings, or the absorption rate, which peaked in 2021 with an absurd 73.7% in the 416.
While the overall absorption rate of 32.1% last year was lower than the 36.3% recorded in 2024, it’s worth noting that year-over-year absorption rates were higher in June, July, September, and December:
There’s that December uptick again.
I have to think this signals that investors or end-users were out there seeking deals in the weeks before the market shut down for Christmas.
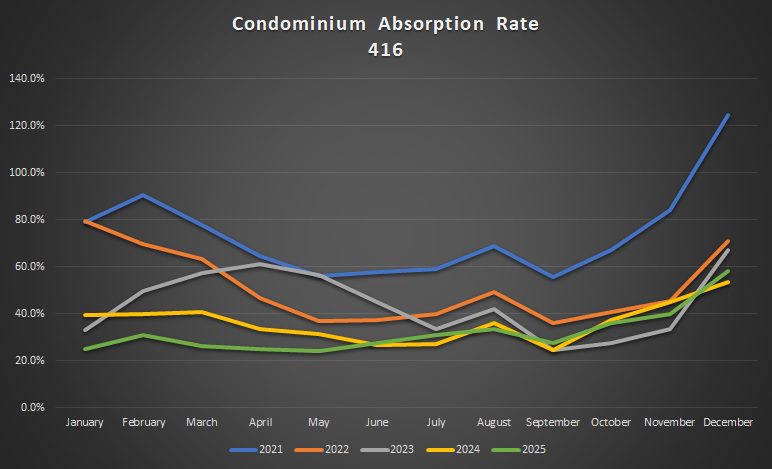
The chart shows us that while the absorption rate was at an abnormally low level for the first five months of the year, it pulled in line with prior years from June onward:
As for the 905, we noted above that the year-over-year sales figures weren’t that different between the 416 and the 905, but the new listings figures were, as they spiked in the 905.
This means the absorption rate in the 905 is going to show a much larger drop off on a year-over-year basis:
That looks about right.
The 416 saw a decline in absorption rate from 36.3% in 2024 to 32.1% in 2025.
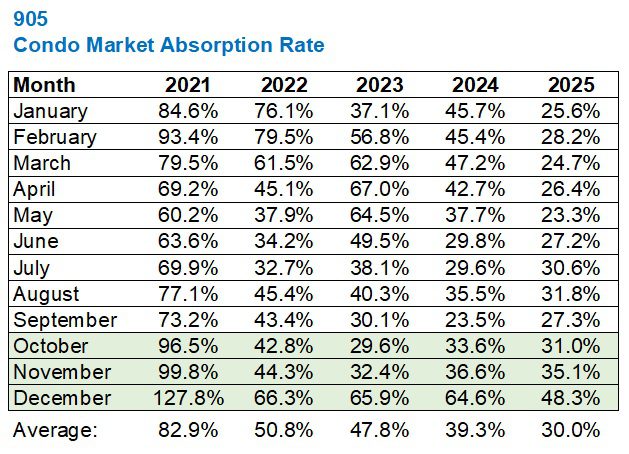
The 905 saw a decline in absorption rate from 39.3% in 2024 to 30.0% in 2025.
This is simply the result of a 0.6% increase in listings in the 416 versus a 13.2% increase in listings in the 905.
Having said that, the following chart looks quite similar to that of the 416:
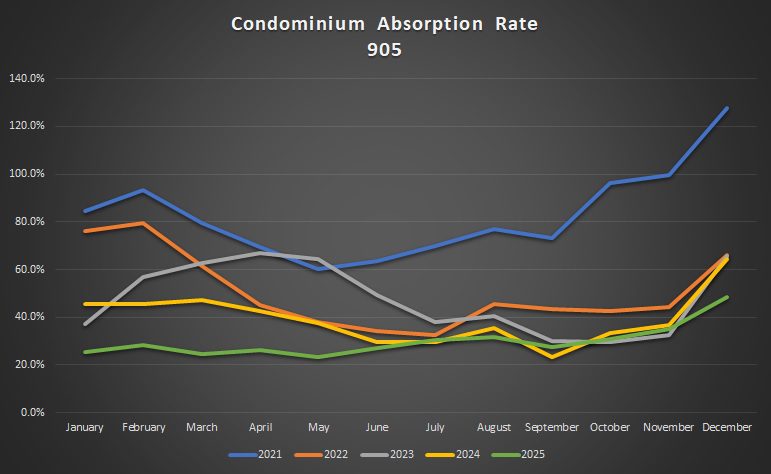
Geez, I can’t get over that blue line from 2021. Right?
If you ever wanted to understand why our condo market reached the peak that it did, look no further than an absorption rate that averaged a ridciulous 82.9% in 2021, culminating with rates of 96.5%, 99.8%, and 127.8% in October, November, and December.
So how does all this translate in terms of prices?
Here’s a look at the monthly average condo price in the 416:
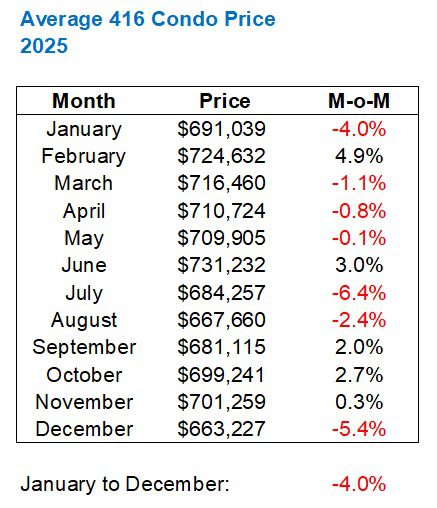
Interestingly enough, while sales and absorption rate were very strong in December, prices dropped significantly.
Overall, the average 416 condo price dropped 4.0% from January to December.
Should we expect to see the same thing in the 905?
Nope!
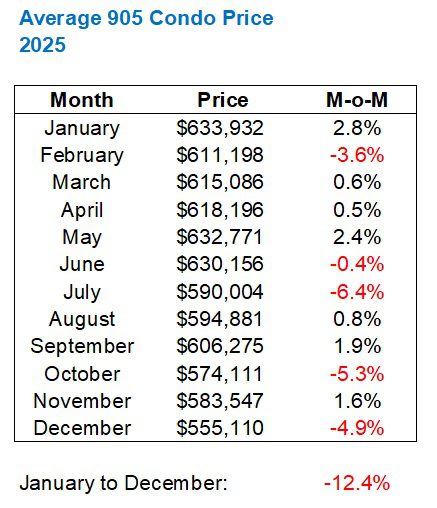
Our eyes have a tendency to skip over the month-over-month figures and just finish at the bottom.
A decline of 12.4% from January through December. Wow!
And when this is compared to the “mere” 4.0% decline that we saw in the 416, the contrast is stark.
We should have the TRREB stats for January by Wednesday or Thursday, so I’ll be sure to update this post, and we’ll follow on Thursday with a full blog that breaks down the January stats.


Derek
at 10:24 am
Gasp! Who had a ‘new low’ for January 2026 in the “when will we peak again” contest?
Derek
at 12:19 pm
I had March 2026 for the “peak again” prediction, so hopefully the TREEB average price increases 40% from here, in the next two months. Interest rates were cut big time from their high so I’m sitting pretty!
Derek
at 3:10 pm
Talking to myself here 🙂 It looks like the average price has now fallen just as far as it fell after 1989, except twice as quickly this time…. Someone should coin a term for this.