
There’s a small town out west where the population is absolutely exploding!
In one year, they saw a 300% increase in the overall population, which is astounding.
You might say this level of growth is unsustainable. You might say that the existing infrastructure can’t support the increase in residents.
But what if I told you that only twelve people lived in the town?
What if I were more specific and said that, last year, there were three people living there, and now there are twelve?
That is 300%, right?
Excuse me for being cheeky on a Monday morning, but I’m proving a point and shining a light on a long-standing issue that I’ve had with a little thing called “sample size.”
You’ve heard me say, time and time again, “You can make numbers say anything you want.” This is especially true when it comes to data with small sample sizes.
A few people flagged this article last week:
“Toronto’s Ultra-Luxury Real Estate Market Sees Whopping 200% Increase In Sales”
Toronto Star
July 16th, 2025
Just read that headline, wow!
Here are a couple of possible knee-jerk reactions:
“The Toronto market real estate market is booming!”
“Luxury real estate is hot!”
“It’s a seller’s market!”
And so on.
But read the introduction to the article and tell me what you see:
The Toronto-area ultra-luxury real estate market defied troubling economic headwinds with a whopping 200 per cent increase in sales in the first half of 2025 over the same time last year.
According to Sotheby’s International Realty Canada’s 2025 “Mid-Year State of Luxury Report,” residential sales in Canada’s largest luxury real estate market declined in the first half of 2025 as uncertainty slowed activity. But the region’s ultra-luxury real estate saw 12 sales for homes over $10 million in the first half of 2025, compared to four sales for the same period last year.
I haven’t watched Family Guy in about twenty years, but do you remember the scene about when the telephone was first invented?
This scene came to mind as I was talking about small sample sizes.
Imagine making a wrong number when there were only seven phone numbers?
But at the same time, imagine talking about a 200% increase in ultra-luxury home sales when the baseline is four?
That’s right.
Per the Toronto Star article, which touted the 200% increase in the headline, and was no doubt designed to catch eyes and solicit “clicks,” the ultra-luxury market is on fire!
A whopping 200% increase. And they even used my word! Whopping. That’s mine!
Going from four ultra-luxury sales to twelve may, in fact, represent a 200% increase, statistically. But in reality, does it really tell us anything about the market?
What constitutes “luxury” is going to be different to just about everybody.
And if we went beyond people, and their definition, and looked at geography, then we’d really be throwing the definition into the fire.
Semi-related, but check out this email I received last weekend:
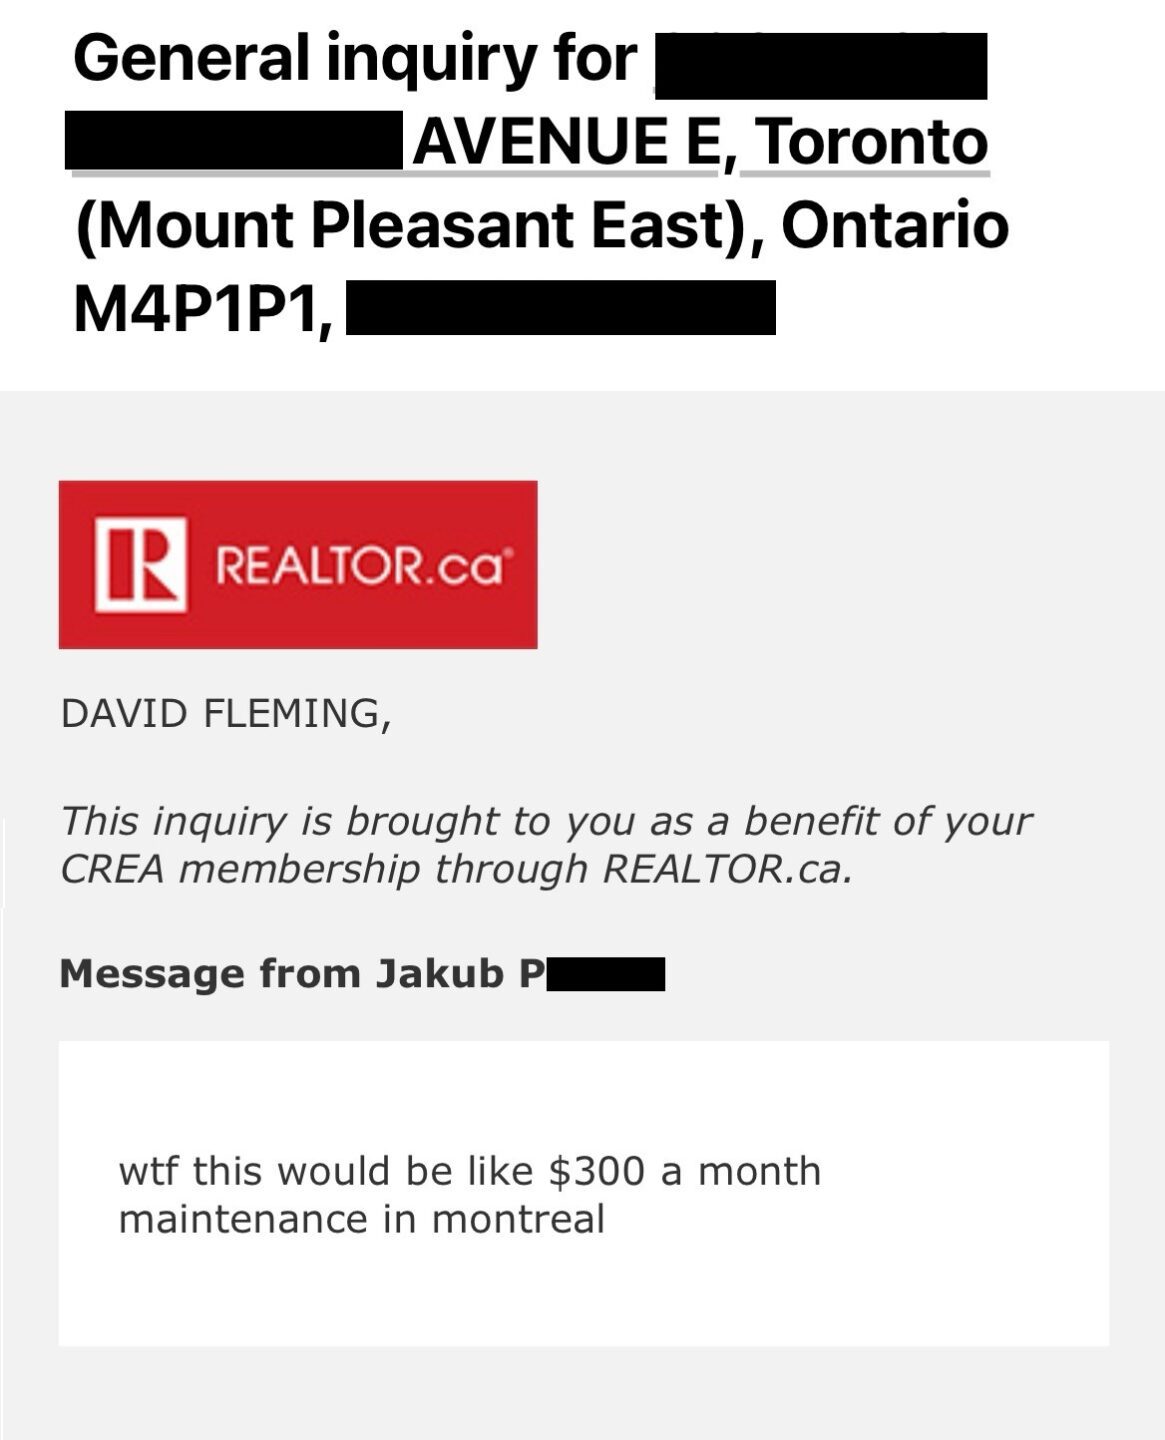
Somebody get Jakub an atlas, please and thanks!
Because this condo is located in Toronto, and for the life of me, I don’t know why comparative fees in Montreal has anything to do with this.
I mean, I also wonder why Jakub felt the need to email me to voice his displeasure, but people are people.
So in that vein, how do you define the word “luxury?”
Maybe you’re picturing a beautiful Rolex?
I’m not a watch guy. Or a car guy. Or a $500 t-shirt guy.
Then again, a 1924 Champs Cigarettes Frank “King” Clancy PSA-8 hockey card doesn’t really scream “luxury” to you either, right?
If we were to ask people around the world to put a price on the value of “luxury” real estate, I think the responses would be all over the place.
So let’s stick with the $2,000,000 threshold that we’ve used in this blog feature before.
Here’s how the various price points of $2M+ have looked in terms of sales so far in 2025:
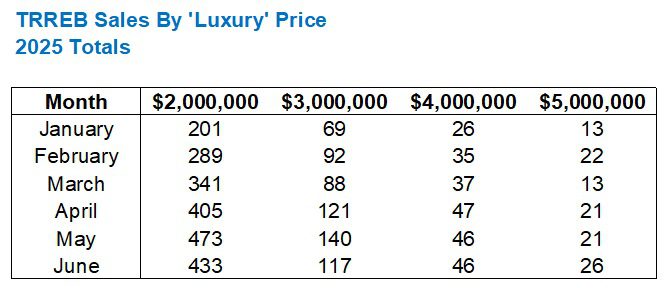
As you might expect, sales look to have “peaked” in the month of May in just about every category, give or take.
As you also might expect, the sample size decreases as you continue to increase in price, which is the problem that I had with the Toronto Star article, of course.
To put these figures in context, here’s the same chart but with TRREB total sales on the end
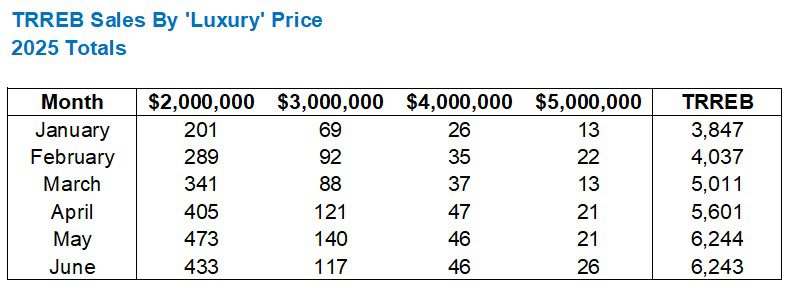
As overall sales increase, so too should the number of “luxury” sales.
But what do these numbers represent as a percentage of overall sales?
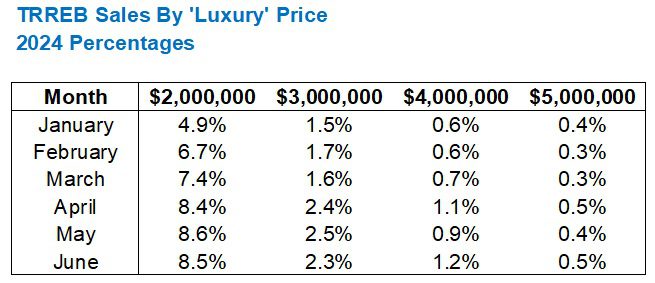
Here’s that figure:
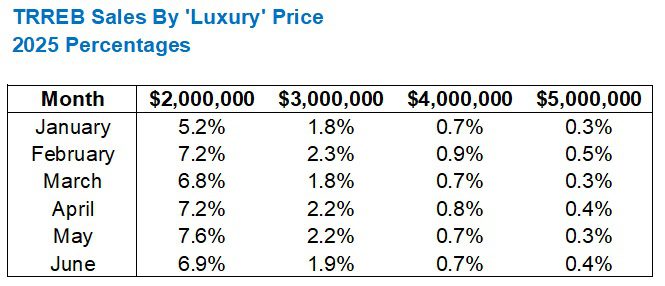
This speaks to the idea that the “luxury market” peaks during the better weather, but having said that, the sample size is so small at $4M and $5M that we’d need to go to hundredths of a percentage to really notice any movement up or down.
But how does this compare to 2024?
Here’s that data set:
For comparison purposes, let’s look at each segment and put 2025 vs. 2024, side-by-side.
We’ll start with $2,000,000 and up:
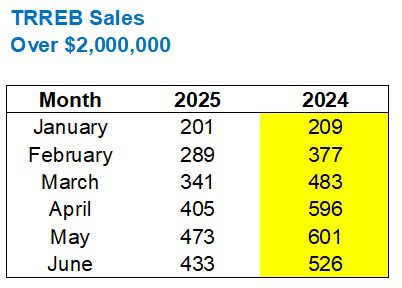
That’s a clean sweep.
Not one month so far in 2025 saw more sales of $2M+ than in 2024.
However, we’re not accounting for the total number of sales!
For example, there were 201 sales of $2M+ in January of 2025 compared to 209 sales in January of 2025. So what if there were more overall sales?
We need to look at these figures as a percentage to understand the comparison on a relative basis:
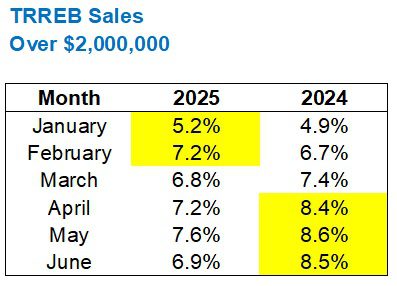
This changes the perspective, does it not?
While there were more sales in January and February of 2024 than 2025, the relative number of sales was higher in 2025.
Here’s the overall data for $3,000,000 and up:
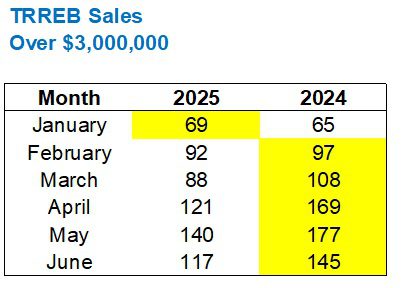
Again, for some strange reason, we saw strength in January, but the total number of sales of $3M and up is higher in February through June.
As for the relative number, it follows the same trend as with the $2M and up chart:
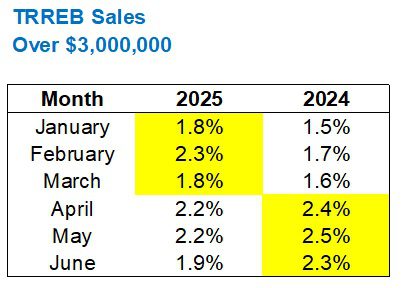
That’s very interesting!
And very surprising too.
I know we’re talking about very small percentage points, but with total sales declining, and with prices down year-over-year, you wouln’t expect to see this relative strength.
Here’s the data for $4,000,000 and up:
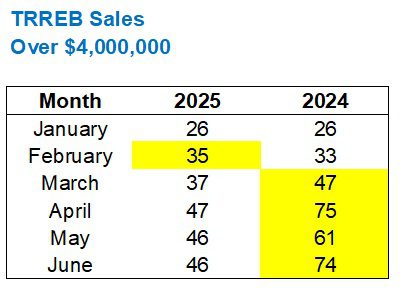
Once again, it looks like 2024 is far stronger than 2025.
But once you see the relative data, this changes:
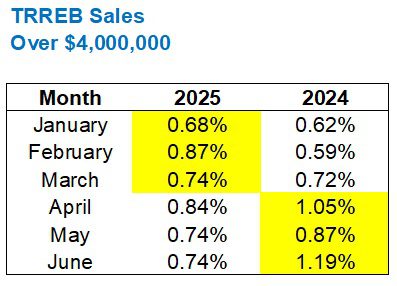
Again, maybe we’re splitting hairs.
Look at January, for example. We’re talking six one-hundredths of a percentage point, but it still counts!
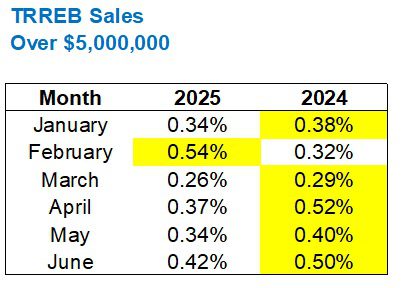
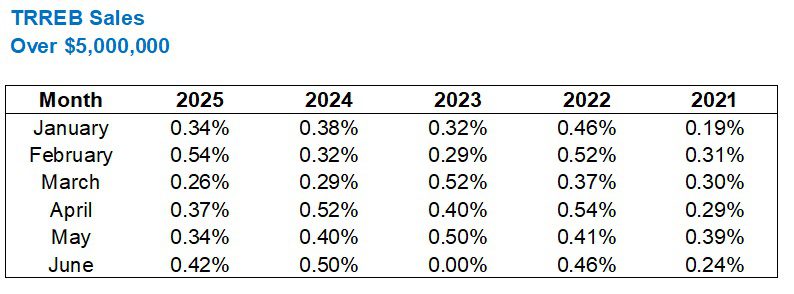
Last, but not least, the $5,000,000 and up sales:
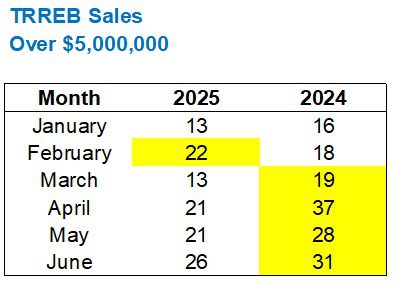
This time, however, the total sales match the relative sales:
Does anybody care to look back further than 2024?
I know my interest was certainly piqued!
Let’s run the charts on relative sales from 2021 through 2025 for the price thresholds noted above.
The most shocking, in my opinion, is the $2,000,000 and up chart:
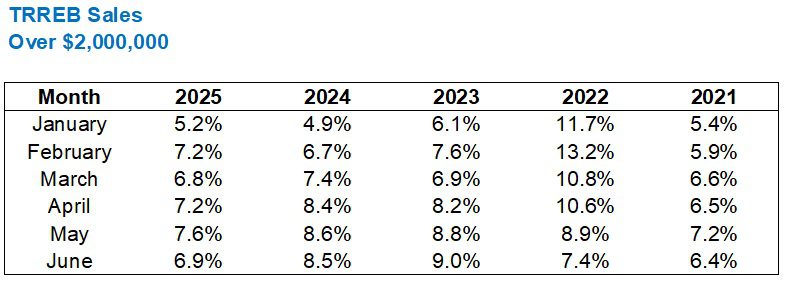
Compare 2022 to 2025, just to say we did.
I recognize that we’re using the “peak” of a two-decade bull run for comparison purposes, but look at January!
11.7% then versus 5.2% now.
The percentages narrowed as we went through the year, as evidenced by the 7.4% in June of 2022 compared to 6.9% in June of 2025, but the point is made. January and February of 2022 was the craziest market I have ever worked in!
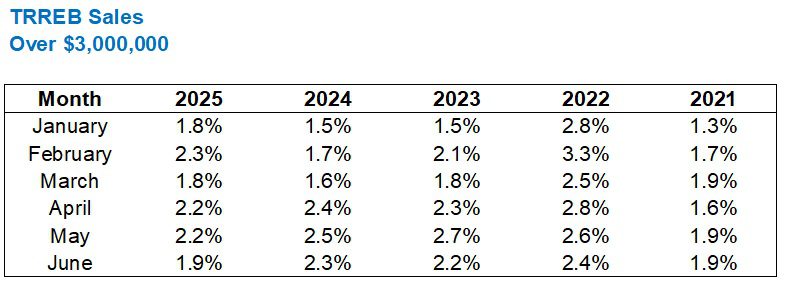
When we get to $3,000,000 and up, the percentages narrow:
And when we get to $4,000,000 and up, we need to extend this to another decimal place:
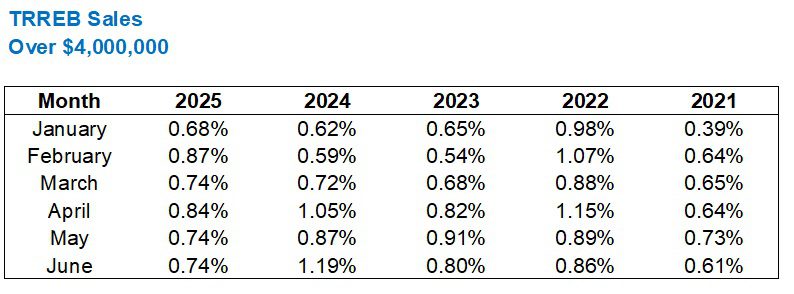
As noted above, the share of $4M+ homes sold in 2025 is actually higher than in 2024 for January, February, and March, but it’s also higher than 2023 too.
Look back at 2021, and we see the same trend.
Perhaps there’s more of a market today than in 2021, despite higher interest rates and economic uncertainty?
I’ve long argued that buyers in this price point arent affected even when the economy retracts, at least, not like the buyers for $550,000 condos or $1,200,000 houses.
Note that the trend continues for $5,000,000 and up homes:
This comparison between 2025 and 2021 is starting to fascinate me.
The sales share is higher in January, February, April, and June, and by a wide margin.
Like I said: these folks aren’t affected by changes in the real estate market, financial markets, economy, or by what the “winds of change” threaten to bring.
And that is why they should pay a Land Transfer Tax rate of 100%.
KIDDING!
Only kidding.
But somewhere, Olivia Chow is taking a break from dancing to take note of my suggestion.
Folks, the long weekend is coming up!
I’m hardly the “get out of the city” guy, as you know. But summer is flying by, and my fatalist nature is already making me think about September…
So here’s hoping everybody celebrates “Simcoe Day” in their own way.
Yes, the holiday that dates back to 1869 was briefly renamed by Toronto City Council in 1969, but it’s a good thing this didn’t stick, since Sir John Graves Simcoe will probably be cancelled at some point this year or next, as everybody born in the 1800’s (and soon 1900’s…) will most certainly be.
And on that happy note, have a wonderful long weekend, and I’ll see you back here with a rare mid-week, Wednesday blog post to catch up on the July TRREB stats!


Serge
at 8:08 am
I recall long time ago some newspaper (Star?) comparing Toronto market with NYC, noted, condescendingly, that in Toronto, there was no even property worth more than 7 mils. (David should recall it, too.) And here we are, alongside supertall condos. Huge progress!
Kevin
at 11:19 am
David, I’m sure you can do better than Subway or Mr. Sub. Try Grandma Loves You. Stupid name, great subs!
Milk Man
at 12:05 pm
There are rules to this sort of thing.
The order of best chain sub shops in Ontario is as follows:
1) Quiznos (yes they still do exist)
2) Firehouse Subs
3) Jimmy John’s (1 store in Canada still counts)
4) Mr. Sub
5) Subway
I am prepared to defend this ranking accordingly
Different David
at 12:49 pm
Try Jersey Mike’s. Your ratings will adjust, I guarantee.
Milk Man
at 1:03 pm
Thanks for the tip!
Max
at 2:55 pm
Look no further than Forest Hill as an example. There are like 15-20 houses for sale over $10M yet only one has sold this year.
Ace Goodheart
at 2:09 pm
Rich folks are picky. If you get up into the .01% who can afford the $5 mil + houses, they have their own opinions on every little thing. They essentially tear out the interior of the house when they buy, even though there is nothing wrong with it, because they don’t 100% approve of the design.
They are incredibly hard people to sell to.
So.if they bought 12 houses, either someone got divorced, someone died, or a bunch of people won the lottery.
The established rich set almost never buy and move into houses. They like to build their own, to their own specifications.