
At one point during the last week of July, a colleague of mine was passing by my office and said, “You headin’ outta here for the long weekend?”
Wow.
After eighteen years, I thought he knew me better than that…
“I’ll be here during the long weekend,” I explained. “I love long weekends in the city!”
He looked at me with a furrowed brow and I could see the cloud forming a question mark over his head, so I continued, “There’s nobody here. The city is empty.”
He still looked confused.
“You drive on the streets, there’s nobody there. You check out at Loblaw’s, there’s no lineup. You take your kids to a play centre, it’s empty. School’s out, man.”
He nodded and smiled. He got it. He does know me, after all, and once I explained the bizarre logic, he recognized me once again.
“So no trips this summer then?” he asked.
“Oh, no, man, it’s not like that,” I explained. “Once everybody is back in the city after the long weekend, we’re heading up to my brother’s cottage, first thing, Tuesday morning!”
He shook his head, threw up his hands, and left my office.
What can I say? I’m not wrong here.
We drove back home from Honey Harbour last Friday at 11:00am and the traffic heading north was bumper-to-bumper already! At 11am! Your 2.5 hour drive to wherever you’re going when there’s “no traffic” is a five-hour torture-fest on a Friday.
Why do people do this? Seriously, I’m asking.
I doubt that I will ever own a cottage, and there are many reasons, but I’m not knocking it. I totally see the appeal, I’m just not “that guy,” and I can always bring my family up to see my brother and his family a couple of times per summer, and that’s truly getting our fill.
But what is it about a person that leads them to believe driving Highway-400 on a Friday at 3pm is worth doing at all?
I would never do it. I couldn’t.
I’m a control person and things beyond my control drive me insane. There’s one thing that I will never, ever have control over, and that’s time, so I don’t do well in bumper-to-bumper traffic with no end in sight.
Side-note: how about doubling or tripling the size of Highway 400 over the next decade? I’m all for it! Should be simple, right? 🙂
Well, it’s not like me to take “time off,” but when you’re 90-minutes north of the city, you have a home office at somebody else’s cottage, and you’ve finished all your homework before dinner, it’s probably not the worst idea in the world. Although, TRREB sure threw me for a loop when they released the July stats on Thursday! In the last week of July, as we prepared for me to head away for three days, I remember telling my team, “After Canada Day, they were so late with the stats, so there’s no way we’ll see the stats by the 5th of August. Not a chance!”
Then TRREB said, “Hey…..hold my beer…”
It was Thursday morning and I was just choking down a cup of Folgers coffee with Splenda and 1% milk, which did not come close to matching my typical Tim Horton’s XL, regular, and just because I’m a creature of habit, I Googled “TRREB Market Watch” on my laptop before I was heading down to the dock to ensure my 12-year-old niece was okay watching my two small kids.
And there, on my laptop screen, was what I leased expected to see: “03 August 2022”
The timestamp on TRREB’s latest stats! That stamp that you’ve literally seen change before your very eyes in the past, when you click ‘refresh’ on your browser, knowing the stats are to be released that day.
I was Googling this simply as a formality; like checking eBay for new 1933 O-Pee-Chee hockey cards every night before bed!
But the stats were out. And so too was school, apparently!
Even a quick glance at the stats showed that not much was happening in the Toronto market in the month of July, as the real estate playground was empty!
I typically look at price first, but I knew the average home price was going to decline by 3-5%, month-over-month. It was volume I wanted to see; sales volume, that is.
If the market does the same thing every July, compared to June, then seeing that happen this past month wouldn’t be cause for either celebration or concern. I had some expectations for the market as far as price, sales, active listings, SNLR, and general feeling of the four big “suburb” regions go, but it was the sheer number of sales from which I was going to draw the largest conclusion.
So what was that figure?
4,912
That’s how many sales there were in the GTA in the month of July, and it tells more tales than the walls of your neighbourhood school’s library…
It’s not just the drop in sales on a month-over-month basis, because we’ll explore that.
It’s not just the drop in sales on a year-over-year basis, because we’ll explore that too.
It’s because the number “5,000” stands out in my mind as a floor of sorts. It’s like the area of the water that you don’t swim past, for fear of going into the black, or getting the bends on the way back up.
From January of 2002 through June of 2022, there are 246 months’ worth of Toronto real estate data.
And in how many of those months did we see fewer than 5,000 sales?
36
Some of you are thinking, “Wait, that’s a lot! I thought you were going to say ‘five’ or something like that! Thirty-six out of 246 is almost 15 percent! That’s not that bad!”
Fair. For now.
But if we add July of 2022 into our tally and come up to 37, and if we analyze the months in which fewer than 5,000 sales occur, the results are very telling:
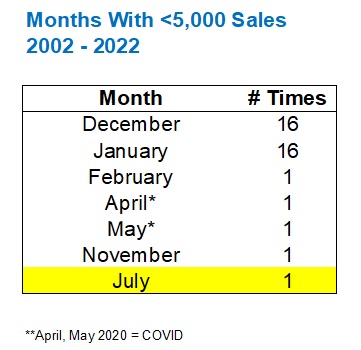
December and January.
That is when we see fewer than 5,000 sales, and understandably, since those are the slowest months of the year.
Not only that, from 2002 through 2022, we have data for twenty-one months of January and twenty months of December.
December: 16/20
January: 17/21
That’s how often we see fewer than 5,000 sales in those months, so it’s almost automatic.
Of the other months, we see February, April, May, July, and November.
But February is adjacent to January, and November is adjacent to December, so maybe, just once for each, we saw slow January and December months followed and preceded by slow February’s and November’s as well.
Alright, but there’s still those months of April and May, right? So the fact that we saw fewer than 5,000 sales last month in July isn’t all that bad.
Except that, if you can read as well as I can, you’ll see my asterisk next to both April and May, noting that they were in 2020, when COVID had hammered the market. So can we really count those?
What we’re left with, when all is said and done, and excuses are made for December, January, February, April, May, and November, is that the sales figures in July of 2022 are as shocking as it gets.
Now, in the context of the current market, was July worse than expected?
I mean, when you consider the trend and the downward momentum, should those 4,912 sales come as a surprise?
To answer that, I want to know what typcially happens to sales from June to July.
This past June, we saw 6,474 sales.
The 4,912 sales in July represent a 24.1% decline, month-over-month.
Now, if we’re accustomed to seeing a 35% decline, month-over-month, from June to July, as the busy spring market winds down and summer sets in, then last month’s 4,912 sales and 24.1% decline could be considered good.
Here’s how the June-to-July data looks over the previous decade:

From 2012 through 2021, the average decline is 10.5%.
If you want to throw out that 2020-outlier due to COVID, the decline averages 14.7%.
So the 24.1% drop that we saw last month is a concern, and ironically, it’s only topped by the drop in 2017 when the market was in decline as well.
Any way you look at the sales data from July, it shows a market where buyers just aren’t as active as expected.
You want to say, “Nobody’s buying,” and while that’s hyperbolic, and there are actually almost five thousand people buying, the exaggeration holds true in the context of the market we find ourselves in, especially when we compare to previous months or years.
On a year-over-year basis, sales in July were down by almost half!
As bad as this looks, and feel free to accuse me of being wildly optimistic, but I think we’ll look back at July as the trough of this market. Perhaps not in terms of price, because I could see the average home price declining again in August, but in terms of market activity, this summer will represent the weakest market activity in terms of sales, listings, and consumer confidence.
I remain convinced that the month of September, which always starts off the “fall market” in a strong way, will show increased activity across the board.
Now, this activity that I speak of; how did it look last month?
There were 12,046 “new listings,” and believe it or not, that’s way fewer than we expected.
Let’s run the same chart as we did above so we can look at “New Listings” in previous months of July, but also compare how the market “should” behave from June to July:

The month-over-month decline from June to July is on par with 2020.
And the number of new listings is on par as well.
This is a good thing for our market, with sales declining.
An increase in new listings would push the market further into “buyer’s market” territory.
With all this said, new listings keeping pace with last year, and sales declining by almost half, means that “active listings” should be through the roof.
Let’s take a look:
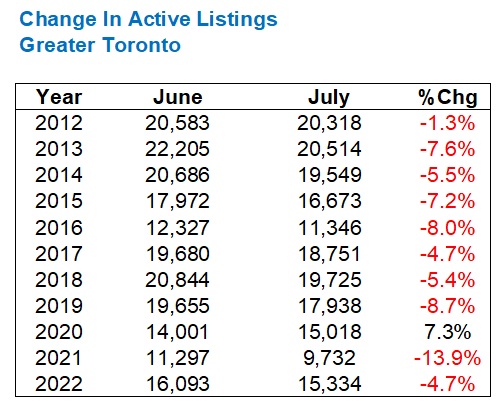
Those 15,334 active listings at the end of July are an eyesore when compared to the mere 9,732 in July of 2021, but that’s a result of sales dropping by half since last July.
This is actually better than I had expected.
In fact, when I put all of this together and look at the “Sales To New Listings Ratio,” we see that some areas of Toronto are actually seeing the market tighten, month over month.
What do I mean by “tightening?”
I mean that the ratio of sales to new listings has increased.
Let’s look at SNLR by TRREB Region:
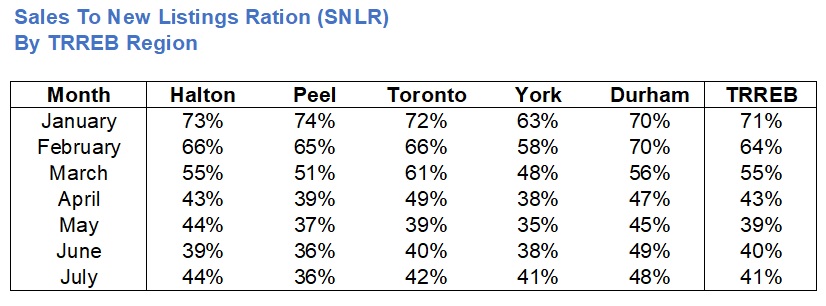
Perhaps the SNLR in Greater Toronto or “TRREB” as we call it, moving from 40% to 41% isn’t much to write home about. But didn’t you think that it would decline? I sure did!
And when I look an area like Halton, seeing an increase from 39% to 44%, from June to July, I’m downright shocked.
In fact, only one TRREB Region saw a lower SNLR and that was Durham Region.
This is very, very surprising!
I think a lot of folks are choosing not to list their houses and condos right now, and that’s probably helping the market overall.
Having said that, certain segments of the market are barren as a result! I have a listing coming out this week and I will have absolutely zero competition. Are there fewer buyers out there right now? Absolutely! But to have zero competition in this area, price range, and demographic is a dream!
Last, but not least, a quick note about average home price: it’s down!
In fact, it’s down 6.2%, month-over-month.
Here’s a quick refresher on the average home price in the GTA over the past year:
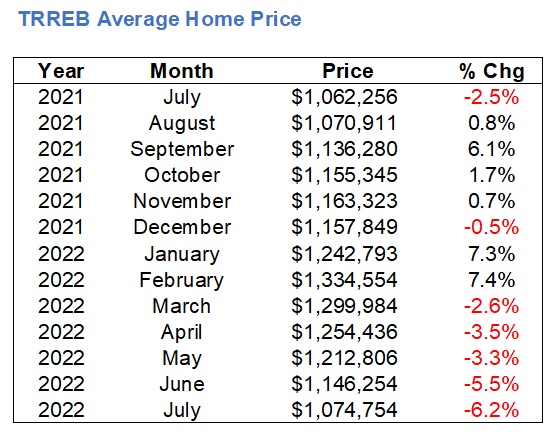
Geez, those 7.3% and 7.4% month-over-month increases to start the year sure didn’t help!
And now here we are, mainly due to weakness in the suburbs, with a return to an average home price equal to August of last year.
There are going to be more bumps along the way before a return to “normal.”
And more importantly, it’s going to be very, very hard to understand this market when nobody really knows how to report on it.
Case in point, two articles that appeared in my Google feed on Friday:
The first article says home prices have “slipped” and the second article says prices aren’t “following suit.”
How can both be true?
I suppose if the person who wrote the second column thought that a 50% drop in sales should lead to a 50% drop in prices, then yeah, maybe the headline holds water.
But if that were the case, then the person writing the headlines might know the least about real estate, markets, and the real estate market of any human on the planet.
So be careful what you read in the coming months.
I expect August to be slow, both in terms of sales and pricing, but you heard it here first, folks: September will be very, very different…


Appraiser
at 6:39 am
Remember when the scourge of “blind-bidding” was a thing?
A Grant
at 9:10 am
“Side-note: how about doubling or tripling the size of Highway 400 over the next decade? I’m all for it! Should be simple, right?”
Besides the epic cost, there is the problem of induced demand.
Bryan
at 10:51 am
Very true for the 400 in particular, however, induced demand only maters when “potential demand” is underserved!… which is, in a way, self perpetuating when we choose (for 50+ years) not to build infrastructure because it will induce demand amongst the underserved.
If, in an absurd example, we built a London style subway system that served communities (in both directions) within a circle as far out of the city as Missisauga, Brampton, King City, Aurora, Markham, and Ajax (and of course everywhere inside that circle), then built bullet trains all over the place, fixed local transit in smaller communities like Muskoka where these bullet trains dropped people off, and tripled the size of every highway, there would definitely be more people choosing to go places (induced demand)… but also far less congestion as the supply of transportation options would drastically outstrip the demand for transportation.
David Fleming
at 1:30 pm
@ Bryan & A Grant
I have always gone on record as saying we need more public transportation and highways. You can never build enough. Never fast enough either.
I will probably never take the TTC again. But I would love to see my tax dollars spent there. I would be in favour of increasing my taxes to pay for new subways. THAT is how strongly I feel about the need for transportation infrastructure.
Alexander
at 3:10 pm
I simply do not see any bargains at current valuations with the higher interest rates and I do not see any easing of BoC stance on inflation this year. Buyers are not desperate and sellers are waiting for a big drop in prices. IMHO 20-30% drop in prices from the peak of February takes us to the second half of 2021 and with the new reality of interest rates sellers have to fold first. It is way cheaper to rent now.
Alexander
at 3:13 pm
Comment has to go to the different discussion, not 400 & TTC
Marina
at 10:06 am
David, do you think September will be a fire sale? Or will prices go up again?
I’m following Toronto and Durham in particular, and very curious to see how things shake out. But a lot of people are calling a 20-30% price crash and I can’t see right now how that will happen.
Bal
at 12:31 pm
i think David is expecting to prices move higher in September ….
CdnGAL
at 5:06 pm
There is zero chance of higher prices in September or in the forseeable short to mid term
JL
at 1:11 pm
I’ve heard, and personally tend to agree, that a slow but steady drop in price is more likely in the near term, at least while interest rates are still climbing or expected to rise. With the quick price increases of Q1 having already been erased with corresponding quick drops in Q2, a price “crash” would probably require some triggering change in economic fundamentals (e.g. employment loss).
David Fleming
at 1:29 pm
@ Marina
A 20-30% drop from February? We’re working in that range as we speak.
But a 20-30% drop from where we are now? Not a chance.
You have to be careful. I read this today:
https://www.thestar.com/news/gta/2022/08/07/king-township-has-experienced-close-to-a-50-per-cent-price-drop-in-a-three-month-period.html
Their sample size is 20. Seriously. Twenty home sales and they’re quoting averages.
Some reporters and columnists have no knowledge of markets or economics and they’re simply told, “Write about real estate!” Articles like that are the result.
J G
at 3:58 pm
I agree with you, another 20-30% drop in next 6 months (just like Feb until now), not a chance.
However, another 20% drop over the next say, 24-30 months, how do you know it’s not going to happen? The overnight rate could go up to 5% (or higher) and stay there for a while, all depends on inflation.
Nobody
at 2:06 pm
Overnight WILL go over 5%.
Inventory/new listings will drop (already lots of people are moving sales into rental listings given strength in rental demand).
It will take that 24 months for refinancings (or rather failed refinancings), job loss, and many, many days on market to bring down sellers expectations. Moving back to flat on Feb 2020 is pretty easy since effectively no one who bought in Feb 22 is selling now. Almost every seller is still making money compared to when they bought (and the ones who renovated too long and missed their market are the ones with 120 days on market or 8 listings since Feb) .
People have less money for a downpayment, can’t easily get out of their existing condo/house, and will be looking at a qualifying rate of 7.75% or more. That leads to a frozen market where buyers can’t hit the numbers sellers want or need.
Look to Phoenix in 09/10 to see how that (doesn’t) works.
Condodweller
at 3:15 pm
It will be interesting to see what happens in September. If prices continue to fall I’m interested in how that will be explained away.
With rates increasing and no pressure to buy (no FOMO) I can see people holding off, or at least not overbidding. I’m sure September will be busier, keeping to seasonality, but I would not be shocked if prices stay flat or even fell further.
In 2017, once the new rule shock was absorbed prices started moving up with continued low rates. In 2020 everyone needing more space kickstarted the market again with continued record low rates. What’s the fuel to light a fire under the market this time around?
William Ramdass
at 10:38 am
The % changes in several metrics from June to July of both 2017 and 2022 are very similar. In other years they are quite different.
Vancouver Keith
at 4:09 pm
Dramatic headline with a sketchy sounding person behind it.
https://www.cbc.ca/news/canada/ottawa/unreserved-real-estate-lawsuit-oreb-orea-crea-1.6539915
Condodweller
at 3:07 pm
Well, we knew it was just a matter of time before someone was going to do something like this. The key here is “the billions of dollars of commissions and fees at stake for real estate agents”. I find it funny that RECO wants to protect consumers from the guy who wants to do what many have been asking for for years, saving a fortune in the process, and they want us to be protected by themselves.
To do this they want to use their power: “the power to levy severe penalties on realtors or brokers that violate its code of ethics or break the law. This can include fines of up to $50,000 and jail time up to two years less a day.” Are you kidding me? Can someone please tell me when was the last time a member agent went to jail? Or for that matter, when was the last time an agent paid a fine that was larger than the resulting gain of the offense?
As for the sketchy founder, he went to jail for helping his clients obtain the vehicles they wanted (I don’t know this guy so if anyone does, feel free to let us know if he twisted peoples’ arms into spending more than they can afford). Is RECO sending anyone to jail for these infamous Brampton mortgages? I guess they’re too busy protecting us from unscrupulous salesmen who want to do a better job for us than most RE agents out there.
It will be interesting to see how they do. I mean their selling process on the website seems pretty straightforward, in fact, it echoes most of what David recommends. They provide an estimate, an inspection for all listings, pro photographers, stagers, and a transparent bidding process. Oh, and your lawyer handles the transaction. The only part that seems sketchy is the minimum guarantee. If there is no buyer they get the place for that base amount? If that’s the case clearly there is an opportunity there for fraud by undervaluing the property. But if I can hire my own appraiser that’s ok. This sounds like a great blog topic for David to tear it apart and find the weaknesses.