
Have you ever taken your children to the Berczy Park Dog Fountain?
I suppose the question could have been, “Have you ever taken your dog to the Dog Fountain,” but I think the kids have a lot more fun than the dogs. I honestly don’t know if this fountain was intended to attract dogs and dog owners, but the verdict is in: kids love it.
My son is five years old. Anybody who has a young boy, or has raised one, knows the level of energy, excitement, and curiosity that they exude just about every minute of every day.
Along those lines, anybody who has a young boy knows that there’s a time and place to encourage the little guy to let that energy out!
Sure, you could take your kids to a Sky Zone, The Bubble, Jump For Joy, and the like. But trust me when I say that they’ll love Berczy Park.
The trouble is, at least for my son, some kids don’t know the difference between a splash pad and a public fountain.
On Sunday morning, I took the kids down to Berczy Park and had them do laps around the fountain on their scooters. Everything was going fine…
…for about six minutes.
I just knew it wouldn’t be long before the boy was completely soaked…

He didn’t care in the slightest, however.
Completely soaked from head to toe within about five minutes of getting to the park, and the pattern went: do some laps of the fountain on the scooter, get more soaked, repeat.
But there was a small win here!
My son didn’t strip off his clothes and go in the fountain.
No.
That would be soooo 2024…

No matter how many times you shout, “Hey, Bud, this isn’t a splash pad,” you just can’t stop them. It’s in their DNA.
That was a nice morning! It was nice to have a day off, as we’re now six months into the year and the real estate market has slowed down.
There’s still market activity, don’t get me wrong. And we’re going to spend the next two months preparing a dozen listings for sale in September, but there’s something to be said for the “slow summer real estate market.”
Slow(er), perhaps. But that is to be expected.
I was talking to a colleague on Saturday night (she has a high-end listing for sale, my clients made an offer, but a deal couldn’t be reached), and she said that this has been one of the toughest years of her career. I completely agreed with her, and we noted how most people think 2020 was hard due to COVID, but that really only lasted for 6-8 weeks and then the market went on an absolute tear from June through December.
This has been a tough year, but it’s not that sales or other measurable metrics are down, but rather the amount of effort to get from A-to-B seems to have quadrupled, and the problems encountered along the way have increased exponentially.
I’ve written a lot through 2025 about the dichotomy between buyer desire and seller expectations, as well as the entitlement and naivety of would-be sellers, and the inexperience and lack of professionalism of real estate agents on both the buy and sell side. I remain convinced that the reason there aren’t more sales in today’s market is because of these factors, and not necessarily affordability or desire.
Having said that, I expect the market to slow down for the next two months, and as I’ll explain toward the end of today’s post, I think September is going to represent the biggest “fork in the road” we’ve seen for years.
Up first, let’s look at the average home price…
The average home price in the GTA declined from $1,120,879 in May to $1,101,691 in June, representing a 1.7% decline:
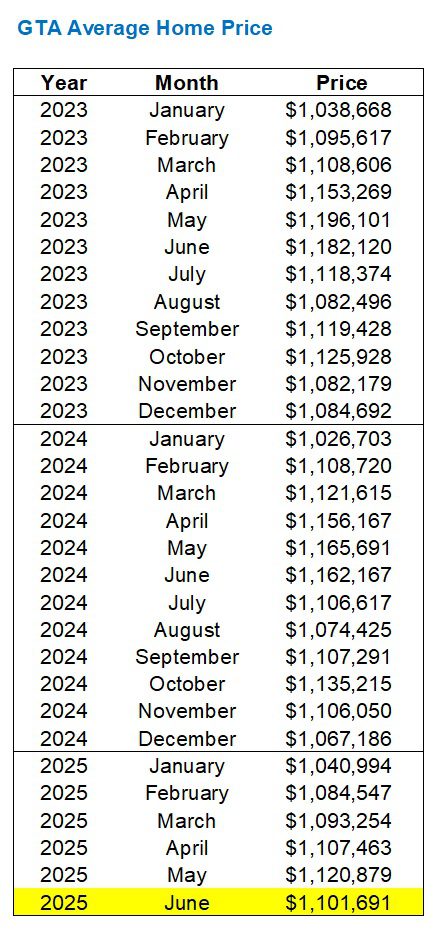
The average home price in both 2023 and 2024 peaked in May, so this should come as no surprise.
In fact, as we have demonstrated before many times in this space, the spring peak usually comes about in May:
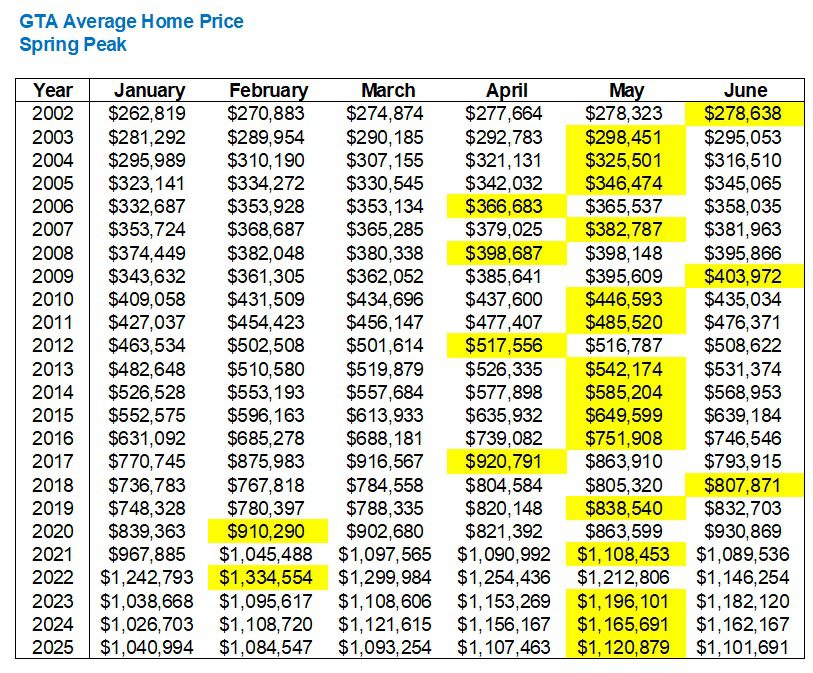
This decline in average home price should be expected.
But is the 1.7% decline in line with expectations?
In the previous twenty-three years, only four times has the average home price increased from May to June, and one of those was in 2020 when all statistics were affected by COVID, as you’ll see below with that ridiculous 7.8% increase.
Based on 2023 and 2024, I’d say last month’s decline was within the mean, but toward the higher end:

There was one more experiment I wanted to run when it comes to price.
The June average home price of $1,101,691 was down from June of 2024 when a price of $1,162,167 was recorded.
That’s 5.2%.
That’s the highest year-over-year decline in any single month so far in 2025:

Outlier?
Or trend?
When we look at this graphically, we can see how 2024 and 2025 really begin to diverge in the month of June:

As I said, this can be an outlier or it can represent a trend.
The summer months don’t really tell us much about the overall health or temperature of the market, but this will e something worth monitoring when we move into September.
Now, in terms of sales, we’re coming out of a period where we saw the lowest sales ever in each of February, March, April, and May – ignoring those months during COVID in 2020, of course.
Amazingly, June did not follow suit!

Well, it’s close!
Amazingly, June sales were essentially tied with sales in the month of May, which doesn’t happen all that often.
In fact, only six times in the previous twenty-three years have we seen an increase in sales from May to June, and one of those was during COVID, which is quite obvious from the chart below:

Considering we’ve seen declines of 7.1%, 11.1%, 17.0%, and 11.4% from May to June in the past four years, being on par with May in 2025 is a positive indicator for the market.
Alright, that’s one.
One positive indicator before I return to yet another bearish sentiment: all-time sales data.
The lowest sales this millennium were in 2023, and 2024 was a close second.
This is how sales in the first six months of the year look in 2023, 2024, and 2025:

Sure, we could go on a rip in the fall, but barring a huge turnaround, we’re on pace to see less than 60,000 sales, which is just unfathomable.
As we know from listing activity, sales aren’t low because “there’s nothing for sale.”
In fact, June of 2025 saw the most new listings in any June, ever:

That’s a lot of new listings!
But it’s down from the whopping 21,819 that we saw in the month of May, and I’ll save you the May-to-June new listings chart, but simply tell you that new listings have declined from May-to-June every year since 2002, except for 2023.
Put together our data on sales and listings, and our SNLR is going to be at the bottom of the chart for the month of June, all-time:
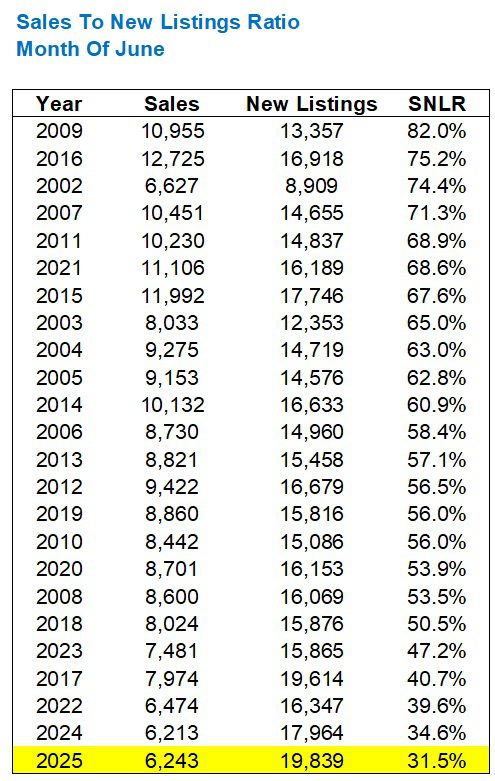
Look at the bottom of the chart, and what do you see?
2022, 2023, 2024, 2025, and then 2017.
We know that 2017 saw a decline in the spring, as did 2022. But the effects have lingered this time around through 2023, 2024, and 2025.
As poor as that 31.5% absorption rate looks when placed up against every other month of June, it’s not as bad when we chart this though 2025:
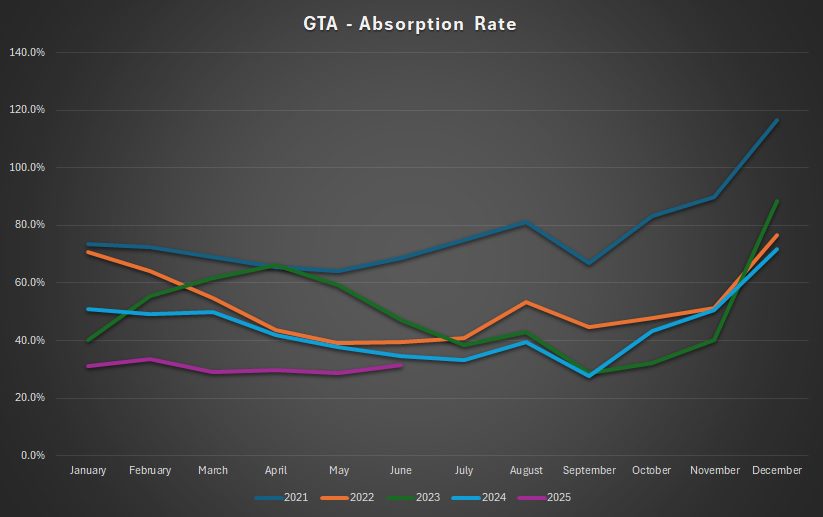
Yes, I know, this isn’t much to get excited about.
But the respective absorption rates of 29.0%, 29.7%, and 28.6% in March, April, and May show that this past month represents a reversal of the prevailing trend.
This will be interesting to monitor through the summer and into the fall.
One final note about inventory, however, and this will also be worth monitoring as we get into the fall.
Last month, I noted that we broke 30,000 active listings for the first time in the city’s history.
30,964.
That obliterated the previous record of 27,386, which was set…….when?
Oh, right, the previous month!
There were a then-record 27,386 active listings in April of 2025, but this paled in comparison to the month of May.
Well, there’s a new record, once again…

Despite sales in June keeping pace with May, and new listings in June declining by 9.1% from May, we saw an increase in active listings last month.
So here’s my question:
If all the people who refused to sell in April, May, and June look into their crystal ball and determine “I’ll sell in the fall when the market is better,” then when you combine this influx of “new” listings with all the folks who are spending their summers prepping properties for sale in September, what does this say about active listings in the fall?
I think active listings are going to continue to increase, maybe not in July and August, but definitely in September and beyond.
The result will be a stark contrast between the sale prospects for “top” properties and “everything else.”
I believe that the A’s will sell this fall, the B’s will have serious trouble, but the C’s have no hope, and the D’s might as well not even be listed.
Not to turn this into an advertorial, but preparation, marketing, and representation will play an even larger role in the upcoming fall market than ever before.
Don’t say I didn’t warn you!


Appraiser
at 8:07 am
Great info as usual David.
Interesting bit of data courtesy of Scott Ingram regarding June TRREB stats.
In the 416 sales of all low rise homes – detached, semi’s and townhomes were up over the previous year, while the 905 was down. https://x.com/areacode416?ref_src=twsrc%5Egoogle%7Ctwcamp%5Eserp%7Ctwgr%5Eauthor
Derek
at 11:13 am
There isn’t much good to say about the state of the real estate union. A -7% from here would be a new “new low”.
QUIETBARD
at 2:50 pm
With listings being at all time highs I’m trying to figure out who these sellers are. Are they move-upers? Is everyone planning on taking on a bigger mortgage at these elevated rates? Can they afford to do so? Or are these owners with multiple properties and they are trying to unload their portfolios. Or retirees trying to cash out? I wonder if one was to strip out the condo listings would the listings landscape look a little better than what we are seeing right now.
cyber
at 5:06 am
1/ Rental demand is down as population growth hovers around 0 (due to clamp down on temporary residents)
2/ Unemployment in the GTA is high (nearly 10% in GTA officially, more if you count those who are not counted as EI ran out)
3/ Remember “mortgage renewal cliff”? Properties bought at ultra low interest rates have started coming up for renewal
—
Basically way less students and temporary foreign workers driving up rental demand
Domestic rental demand also down as younger people move back in with parents, don’t move out, or move to other parts of Canada (mainly Alberta, some to Atlantic provinces)
Sure, condos are obviously getting “hit” – but plenty of house owners have (had?) basement tenants, bought at the COVID peak prices and coming up for renewal, or took out HELOC.to help children with downpayment and now getting slammed with higher interest payments
Karen
at 4:09 pm
Cute kid!
Is his name actually “Bud” or is that turn of phrase? You referenced Married With Children before so was thinking maybe you named him after Bud Bundy?
David Fleming
at 8:14 pm
@ Karen
I was all set to say it’s completely ridiculous for you to suggest that I named my son “Bud” after a character from Married With Children, but then I reflected on the fact that I named my son “Duke” after a character from G.I. Joe, and suddenly, I thought better of it… 🙂
Milk Man
at 9:56 pm
Don’t let this distract you from the fact that Al Bundy scored four touchdowns in a single game while playing for the Polk High School Panthers in the 1966 city championship game versus Andrew Johnson High School, including the game-winning touchdown in the final seconds against his old nemesis, “Spare Tire” Dixon.
Derek
at 10:43 pm
Damn right he did