
When do you get your winter tires taken off?
Be honest.
And if you wait until June or July every year, don’t worry, you’re not alone.
Kudos to the people who pre-emptively book their service appointment every year at the end of March or in early April. You are most certainly in the minority.
I’d be lying if I said that I minimized the unnecessary wear-and-tear on my winter tires every spring, and in all honesty, I probably average a late-April turnover, at best.
I think, one year, I waited until June to get the winter tires off my rims and into storage, but hey – life happens, as they say.
This year, however, I was well ahead of the curve.
My good friend at the dealership had my car picked up on March 31st, with the tires changed over (and car washed and detailed – thanks, John!), and dropped back at my office.
Earlier that week, when it was 24-degrees celsius one day, I told my daughter, “That’s it, baby. Spring is here. The snow is over!”
So tell me, tell me, just how did you feel on Tuesday morning this week when you walked outside, saw snow on the ground, and felt that -5 degree weather?
Sometimes, I wonder why we do this to ourselves. With all the places in the world that we could live, we choose to live in a place where it’s cold six months per year.
Yeah, sure, I like building snowmen with my children. I can admire a clean snow canvas on a brisk December morning. And who doesn’t love a “White Christmas,” like the song says?
But how much damn snow did you shovel this past winter?
How many injuries do you have as a result?
Back, wrist, shoulder, elbow….we’re not getting any younger, and that snow isn’t getting any lighter…
As you read this on Thursday morning, the boys are teeing off in Augusta, Georgia. The sweet sounds of Jim Nance’s voice is already giving you goosebumps, and the flowers are in full bloom.
Nothing says April quite like this:

Eek.
Poor choice in photo selection?
Maybe it’s the wrong year for that one.
Gosh, nobody can make a mistake anymore, can they? No more third chances? I guess we’re all just one flipped SUV away from being cancelled, but I digress…
Alright, let’s go with this photo instead:

Go get ’em, boys!
And while I’m always cheering for Rory Mcllroy, my sleeper pick this year to win The Masters is none other than Cameron Young.
But how long until you hit the golf course?
Will you get out in April? Will you wait until May?
I don’t know what signifies “spring” in the city of Toronto, but if it’s not taking off your winter tires, and if it’s not getting out for a round of golf, then perhaps it’s a busy real estate market?
You saw that coming. But this is a real estate blog, as much as I’d love to spend more time talking about which Par-5 at Augusta is the best (it’s number thirteen, by the way…).
March was a very busy month in the Toronto real estate market. At least, it was for us.
But I heard a lot of agents clamouring “It’s so slow out there,” while we were busy running around like a chicken with its head cut off.
From my viewpoint, January was abysmal, February was slow, but March was really, really busy.
Whether or not that translated into a pickup in market activity statistically, remains to be seen.
Recall that the average GTA sale price dipped below $1 Million in January for the first time in five years.
The price picked up in February, and last month, increased again:
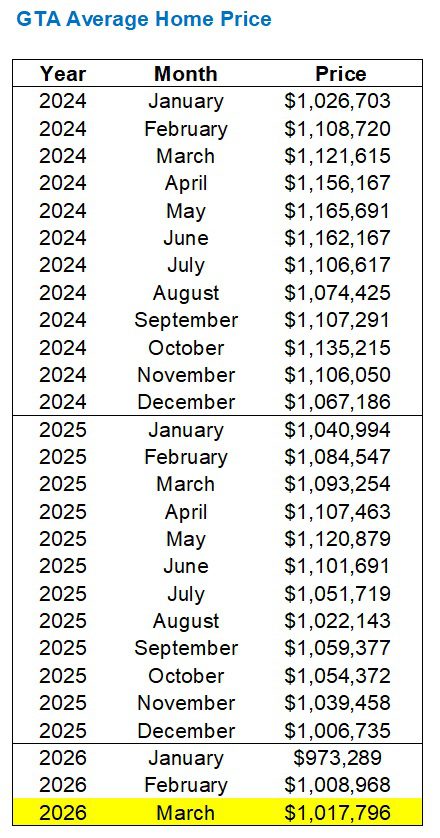
A modest 0.9% increase from February to March.
Almost in “rounding error” territory, isn’t it?
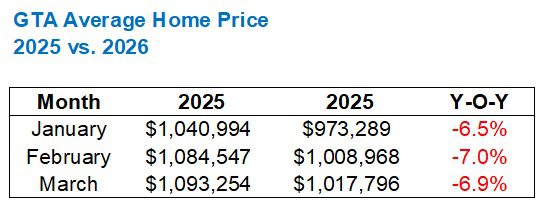
Year-over-year, the decline is far more pronounced at 6.9%, which is in line with the 7.0% year-over-year decline that we saw in February, but higher than the year-over-year in January:
Now, what usually happens from February to March?
The average home price has risen eighteen times in the previous twenty-four years, and done so quite modestly over the previous three years:
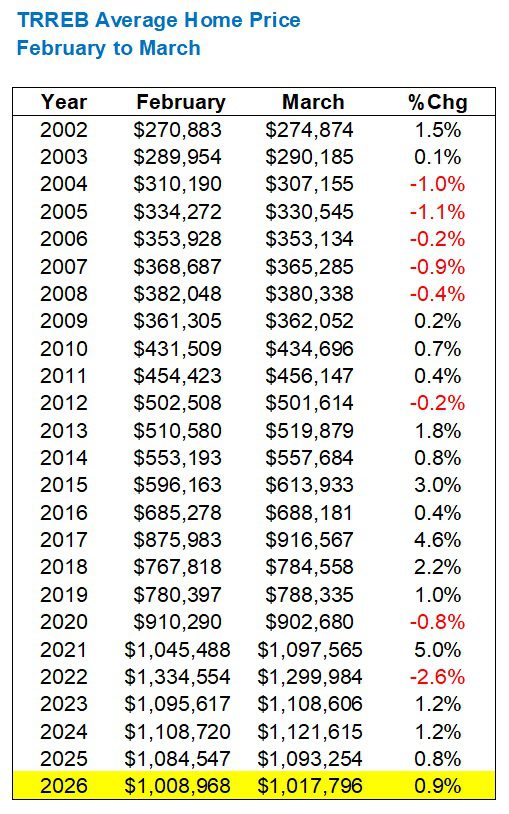
That 0.9% increase is in line with last year, and not too far off from 2023 and 2024.
Everything looks equal, however, when we plot the trajectory of the average home price over the last three years, you can really see where prices have gone:
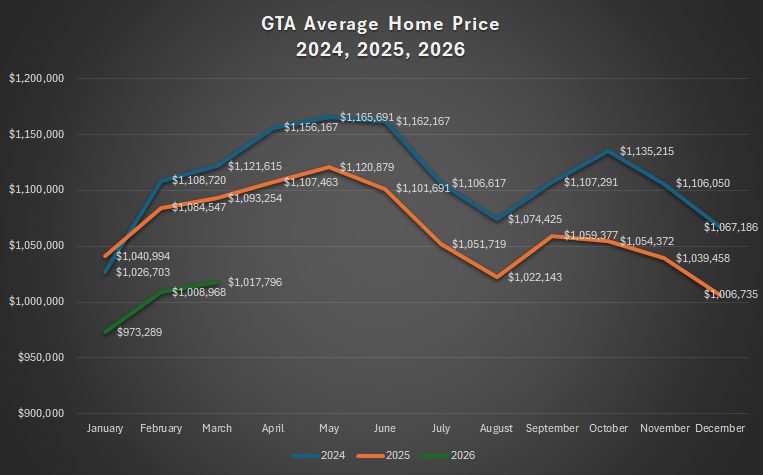
While 2025 trended very closely to 2024 in the first quarter, we’re seeing 2026 come in far lower. The trajectory is the same, but the gap is wider.
What’s causing the decline?
Well, we can look at two things: 1) Geography, 2) Property type.
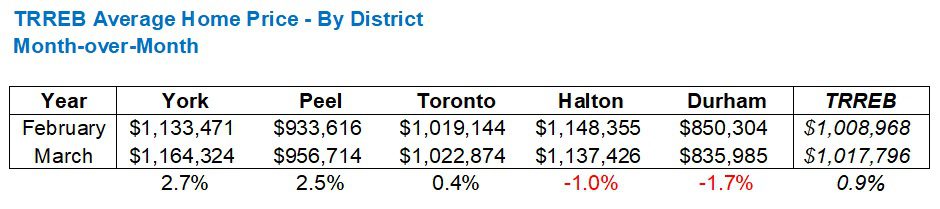
Geographically, Halton and Durham have pulled the average home price down over the last month, while York, Peel, and the 416 are all trending up.
When we look closer at the 416, perhaps to nobody’s surprise, we see the following:
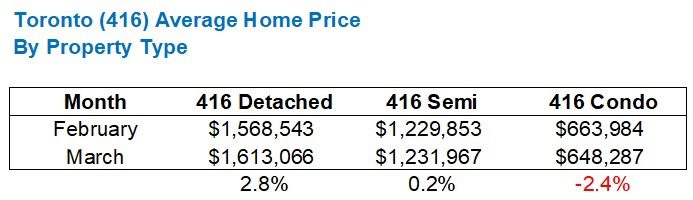
While the average home price in the 416 is up by 0.4%, it’s clearly being dragged down by weakness in the condo sector.
As for sales, recall that sales in March of 2025 were the lowest in any month of March since I began tracking this data in 2002.
Last month did not set a new record. But it sure wasn’t far off from doing so:
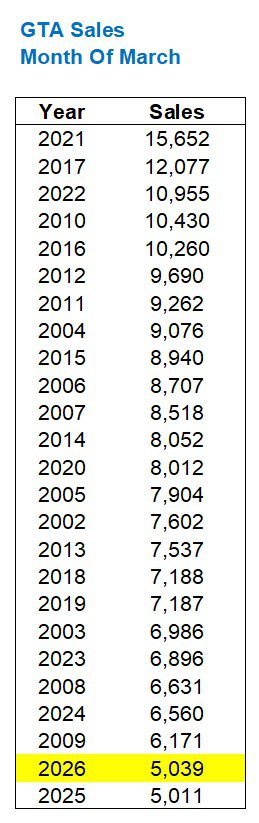
That’s a razor-thin margin!
Another “rounding error,” you might say.
While sales did increase from 3,868 in February to 5,039 in March – an uptick of 30.3%, that’s not exactly out of line with the historical average:
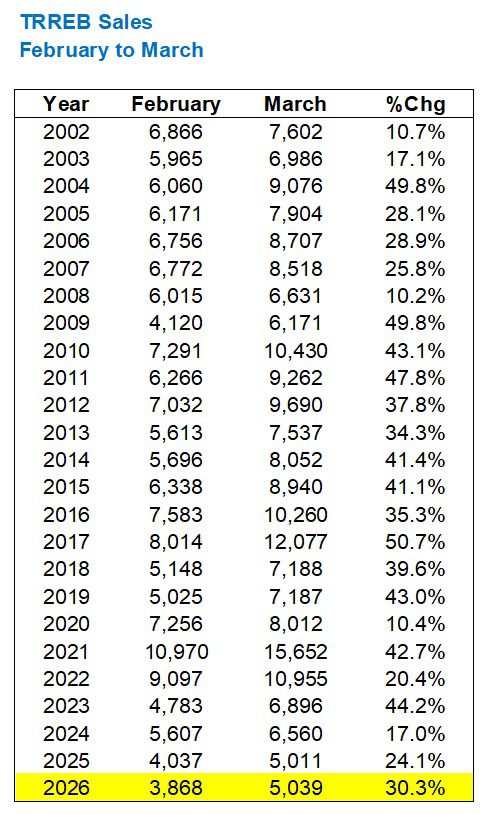
Sales increase every February to March.
In fact, the average increase from 2002 to 2025 was 33.1%, which means we’re actually below the historical trend as it pertains to the February-to-March period.
Now, recall that in 2025, we saw the lowest sales this millennium in 2025, with a mere 62,731.
This was substantially lower than both the 66,315 recorded in 2023 and the 67,984 recorded in 2024.
Through the first quarter of 2026, we’re on pace for another very slow year:
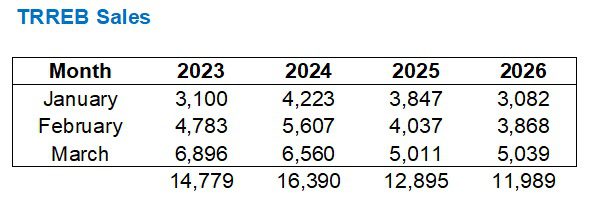
Very slow!
Maybe even slower than our record-low year in 2025?
This is one of the metrics I’m most interested in moving forward.
As for inventory, we’re not exactly trending near all-time highs here:
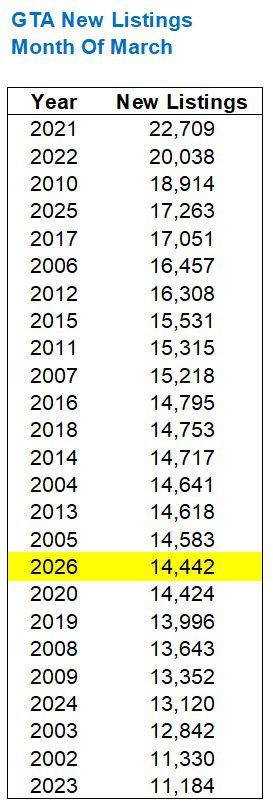
New listings were at 14,442 last month, down 16.7% from March of 2025.
I was literally just talking to a colleague (who annoyingly called me as I was in my blog flow….you know who you are…) who told me, “I have almost twenty buyers under contract right now, all are ready to pull the trigger, and none are finding what they want.”
Say what you want about inventory, quality inventory, or the red herring that you believe this discussion is, but I’m continuing to hear the same thing from buyer agents alike.
Now, put together those 5,039 sales with the 14,442 new listings, and we get an “absorption rate” or sales-to-new-listings ratio of 34.9%.
That’s down from the 36.1% absorption rate recorded in February, but still well up from the paltry 28.6% rate we saw in January.
We’re also trending above 2025’s absorption rate through Q1:
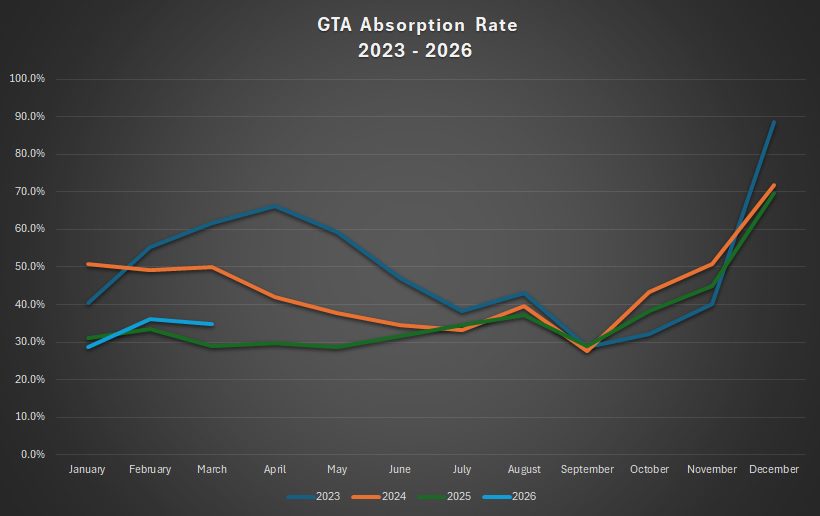
2023 seems like a long time ago, doesn’t it?
Even 2024 seems like a different market than what we’re seeing out there right now.
Last, but not least, the respective absorption rates in the five major TRREB regions:
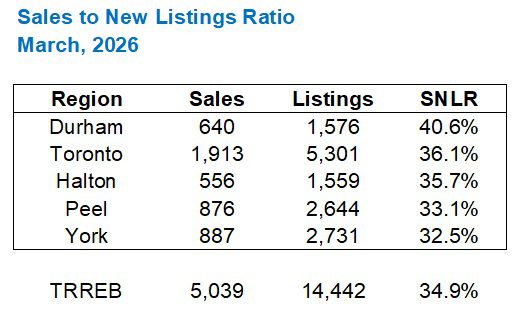
This makes little sense to me.
Durham Region was at the tail-end of our chart above, showing month-over-month average home prices; down some 1.7%.
And yet the absorption rate is the highest.
York Region was at the front of our chart, showing a month-over-month increase of 2.7%.
And yet the absorption rate is the lowest.
Like I’ve been saying all year long: try to find consistency and reason in this market, and you’ll drive yourself nuts.
Well, folks, this is a lot of data to digest!
And now, back to the question about winter tires…
…kidding!
What we all really want is predictions for who wins the Masters.
I’ll be PVR’ing on Sunday and watching alone in my basement panic-room on Sunday night, so nobody text me with spoilers!