
Does anybody want to talk about tariffs?
How about Donald Trump? How about the DOW Jones?
Seriously, who in the world wants to read a real estate blog when we have financial Armageddon being played in a 24-hour rotation on every news channel?
Well, I suppose that’s why have Netflix as a healthy distraction.
And if you live in my house, because of my children, you also have Amazon Prime Video, Paramount+, Disney, Crave, and Apple TV, but let’s keep that between us please…
I don’t often describe myself as “naïve,” nor would I ever consider myself to be the type of person who’s caught off guard. But for the life of me, if you asked me in January if I thought we’d have a worldwide trade war, I would have answered, “That’s the last thing on my mind.”
Thinking back to the beginning of 2025, you will recall our “2025 TRB Real Estate Prediction Game” where I asked you, the TRB readers, to make predictions according to a series of real estate topics and data points ranging from average home price, to inventory levels, to sales, to the condo market, and more. Thirty-two readers entered our contest, but I think if I asked the thirty-two of you if you’d like to revise your predictions today, all of you would do so in a heartbeat.
There’s a certain sentiment out there that “this will all blow over,” and while I understand the theory behind it, we all have to admit: there’s some pretty crazy stuff going on out there!
Meanwhile, here in our fair Verona where we live, er, I mean Toronto, I consistently have to remind myself that while threats of trade wars and economic uncertainty will continue in the news cycle in perpetuity, every man, woman, and child still needs a place to live.
“Don’t quit your day job,” the saying goes, and while I find the news cycle to be entertaining, there is a certain element of “noise” therein that acts as a distraction from the interaction of buyers and sellers in our housing and condo markets.
We are through the first quarter of 2025 and the story, if you can get past all the “noise,” is really about a real estate market that remains flat.
2025, we remain in a flat, balanced market that has its peaks and valleys therein.
As you’ll read soon in the next section, sales are nearing all-time lows, and yet average home prices are only off last year’s pace by about two percent. This speaks not only to the continued resiliency of the Toronto real estate market, as we see during every time of economic uncertainty, but also to the confidence and perseverance of the market participants.
Not only that, we’ve seen the Bank of Canada interest rate decline from a high of 5.00% in 2024 to 2.75% as of early-March. There are likely more cuts to that prevailing rate as we move toward the summer, and this restored affordability will ultimately encourage more buyers to enter the real estate market.
At the same time, there are buyers who maintain their firm seat on the sidelines and will continue to do so.
Earlier this week, I mused that “fear” was keeping young would-be condo buyers on the sidelines these days, even though prices are well off the market-peak. But it’s a different kind of fear, you see. In 2021 and 2022, when condo prices were running up, buyers experienced “fear of missing out” or FOMO, and jumped into the market as they didn’t want to get left behind. In 2025, young condo buyers, even after considering the market decline and the relative “deals” out there, are experiencing a fear of the market declining further.
Most buyers, as I have long explained, feel more comfortable buying after the market has already recovered.
Take a condominium that was trading at $600,000 at the absolute market peak that’s now available for $510,000. Your typical first-time condo-buyer sees that opportunity but fears the market will go lower. That buyer would rather pay $575,000 in 6-18 months when the market is absolutely, positively on the ascent, even though it means they’re paying more.
Sometimes, comfort has a price.
Yet at the very same time, we have to remind ourselves that fortune favours the bold.
With that preamble out of the way, let me give you a rundown of March’s stats as I see them.
The average home price in the GTA checked in at $1,093,254.
That’s a modest 0.8% increase from February:

That’s also down from March of 2024 by 2.5%.
The February-over-February figure was down 2.2%, so the two takes go as follows:
Optimist: “Prices are only off a bit more than 2% from last year, despite everything that’s going on.”
Pessimist: “From 2.2% in February, to 2.5% in March, to…..what, in April? 3%? Then more in May? This is a trend.”
Maybe. Maybe not.
And while I would have been tempted to suggest that a 0.8% increase from February to March is positively putrid, compared to previous years, I was quite surprised to see the following activity:
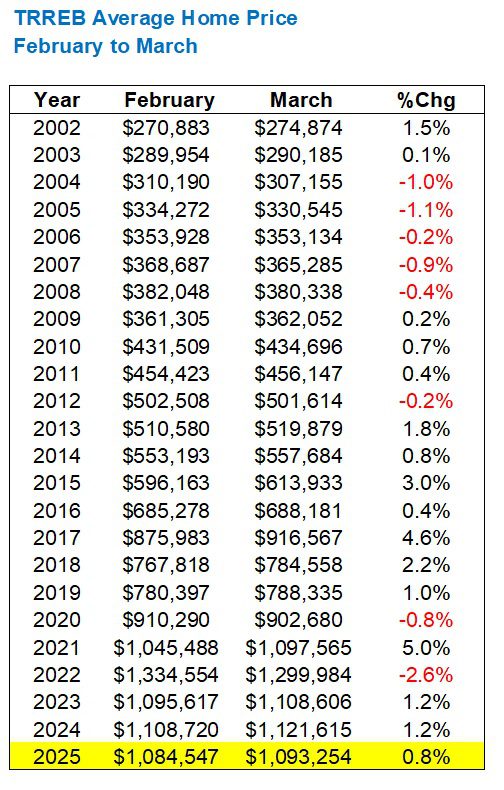
A move of “only” 0.8% from February to March doesn’t seem so small when compared to 1.2% in each of 2023 and 2024 in the same time period.
Our market declined at exactly this time in 2022, so that red figure of -2.6% makes sense.
In the prior year, we were in an absolute boom, so yes, 5.0% in 2021 makes sense.
And before that, we were in the pandemic! Nobody is surprised to see that 0.8% decline.
Overall, I’d say that this data surprised me in two ways:
1) I expected the February-to-March increase to be 1.5% or more.
2) I expected the actual 0.8% increase to be out of line with the last couple of years, and yet it was not.
Now, sales are an entirely different story.
Last month in this space, I told you that the 4,037 sales recorded in February was the lowest in any month of February since we began tracking this data in 2002.
Those 4,037 sales were about 2% below the second-lowest number of all time, which was the 4,120 sales recorded in February of 2009.
Yes, and then March saw that and said, “Hold my beer….”

After a month of February where we saw the fewest sales in any February of all time, it comes as no surprise that March has followed suit.
What does come as a surprise, however, is how much lower those 5,011 sales are than the second-lowest.
I mentioned above that in February, the 4,037 sales were the lowest, but only 2% below the second-lowest of 4,137.
But those 5,011 sales in March, which represent dead-last in any month of March, are 18.8% lower than the second-lowest figure of 6,171.
Folks, this is called an “outlier.”
As for the prevailing trend in sales, it seems to be on par:
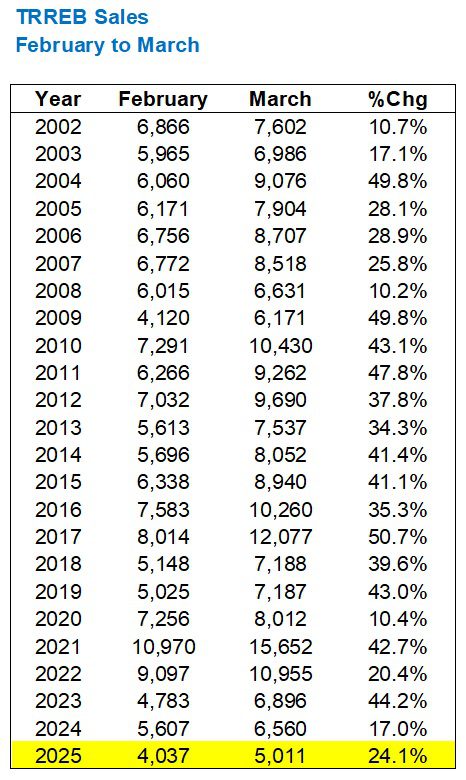
Sales increased by 24.1%, month-over-month, from the fewest ever in February to the fewest ever in March, but that increase shows that the market, for better or for worse, is in line.
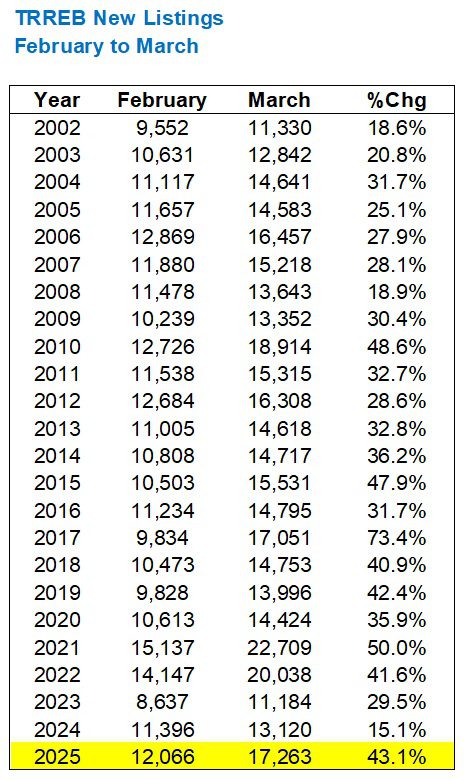
In February, we saw the sixth most new listings in any month of February, all time.
In March, we saw the fourth most…
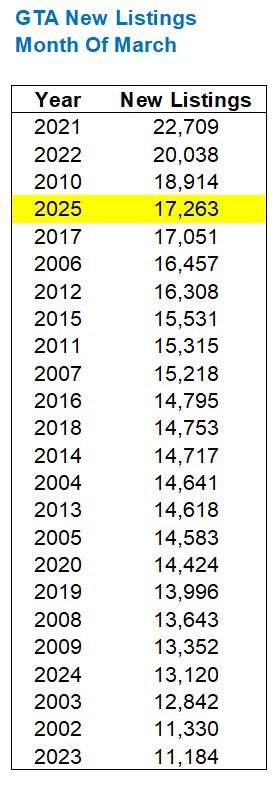
Look toward the bottom of that chart and you’ll find 2023 and 2024.
Say what you want about the decline in prices from 2022 to 2023, but inventory absolutely plummeted in 2023, as evidenced by the fewest listings in any month of March on that chart above. Only three places higher, you’ll find 2024.
But the year-over-year increase in new listings, from 13,120 in 2024 to 17,263 in 2025 represents a jump of 31.6%.
Consider that the year-over-year decrease in sales in March (6,560 to 5,011) represents a drop of 23.6%, and you’ll find a market where inventory is accumulating.
As for the trend in 2025, the month-over-month increase in new listings of 43.1% is more than the last few years, but not out of line with traditional market activity:
Alright, let’s get to what I think is the most important statistic in this market: absorption rate.
Yes, we care about prices the most.
And of course, sales activity is paramount.
But the interaction of buyers and sellers, via sales and new listings, tells us whether this is a seller’s market, a buyer’s market, or a balanced market.
I did say in today’s introduction that we’re in a flat, balanced market, but these stats don’t agree:

That too is an “outlier,” folks.
29.0%.
That is the ratio of sales to new listings in March, or the “absorption rate.”
So why in the world am I saying that our market is balanced?
Because prices are up month-over-month and only off 2.5% from 2024.
In any other industry, to see “demand” decline in the face of increased “production,” or units, we would expect to see prices cut in half.
Not in Toronto, however. At least not in the 416.
A picture paints a thousand words, and the following does exactly that:
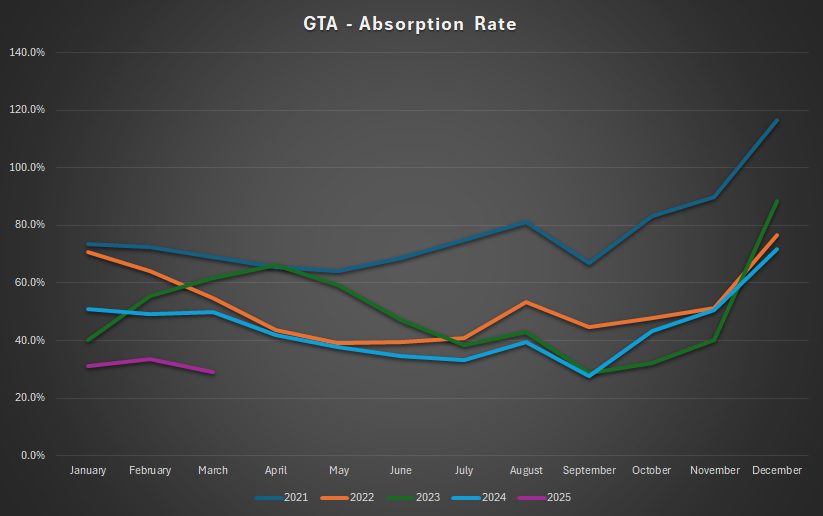
If you’re paying close attention, you’ll note that September of 2024 saw an even lower absorption rate.
27.6%.
That’s the lowest of any month in the five-year data set, although September of 2023 wasn’t far behind at 28.6%.
What I find interesting is the breakdown of SNLR among individual property types.
Last month, it reads as follows:
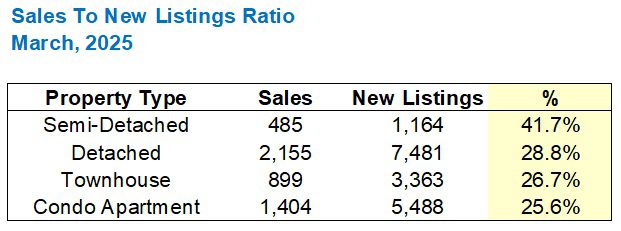
Keeping in mind that the average SNLR or absorption rate is 29.0%, we see that everything but semi-detached houses falls below that average.
It’s no surprise to see condos checking in at 25.6%, which is below the 29.% average.
But detached homes? Really?
Condos, I understand. But detached homes? That doesn’t add up.
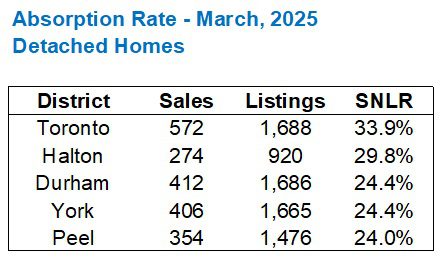
My inexact science tells me this:
Most of the new-build, infill homes in the 905 that saw the largest decline in the past three years are detached. This 28.8% absorption rate in the overall market reflects the build-up of detached homes in those areas, but does not represent the 416.
Actually, forget the inexact science. I need data. I’m doing this on the fly and I’ll post even if I’m wrong…
…which I’m not. Not exactly…
We’ll go with “not exactly.”
The overall absorption rate for detached homes was 28.8%, but in Toronto-416, it’s actually 33.9%.
Not enough to celebrate over, but enough to demonstrate that we sort of know what we’re talking about.
The 416 has a higher absorption rate for detached homes than any other TRREB district, but it’s not like this is 10% ahead of the paltry 29.0%
The figure for townhouses is hard to make sense of, but consider that TRREB groups together both freehold “rowhouses,” which is basically a semi-detached house that’s attached at the other side as well, and that of condominium townhouses, which is an entirely different property type.
I’ve never agreed with this. I feel that semi-detached freehold and rowhouse/townhouse freehold should be grouped together, and condominium apartments should be grouped together with condominium townhouses.
But that’s a topic for another day.
For now, I expect the news cycle to continue as-is, all-day, every minute about Donald Trump, tariffs, and the world economy.
It almost makes you jealous of those two people sitting quietly in Starbucks, having a pleasant conversation, and completely oblivious to what’s happening in the outside world.
Almost.
Is ignorance truly bliss?
Once in a while. But the world keeps turning and that’s something that will never change…


RICK MICHALSKI P.APP ACCI
at 7:44 am
David absolutely nails it again! this inventory is almost all smoke and mirrors of unmotivated sellers fishing for top top top dollar or higjer . Demand is ramping up very very fast and with more rate cuts around the corner just like I said would happen prices will continue to accelerate.
Soundest banking system in the world – Canada.
Most stringent underwriting in the world – Canada.
Most resilient real estate market in the world – Toronto.
Serge
at 9:31 am
It could be a good time to introduce categories of “new new listing” and “relisted new listing”. Otherwise it is not clear, why, when around 10K new listings are not absorbed montly, we still have around 20K of total listings.
Derek
at 1:42 pm
The market has been “flat” and “balanced” month to month, all the way down from 20% higher.
That drop would have happened in one month over month period if this were truly a bear market?
Now, the market is primed to take off? (as it has been every month since rates cuts started, because that is obviously what happens immediately upon rates starting to drop, as everyone knows)
Prices are currently in line with what? About where they were when BOC was at 0.5%?
RICK MICHALSKI P.APP ACCI
at 11:29 am
Down 20% ??? You wish bear price has been resilient
BOC will be at to .5% or lower soon and prices will continue their climbing .
Keep crying panic and doom tho
Derek
at 11:39 am
Apologies Rick and welcome back! Please correct the error. How much is the TRREB price down from the high?
DavidDeFrog
at 1:41 pm
The average sold price is a poor barometer of market health given it does not adjust for property types. i.e. in a market where one $2MM detached and four $500K condos were sold, the average price is $800K. Next month, the same detached got sold for $1.6MM (20% decrease) and only two condos got sold at $400K (20% decrease), the average price will show market is unchanged at $800K even though all prices declined by 20%. This is because home prices typically follow normal distribution within the respective property type but not across.