
Are you familiar with Greek mythology?
I was, for a period of time.
It was grade nine, back in 1994. I took a high school course called “Classics,” and we studied Greek mythology, ancient Roman culture, and Homer’s “The Odyssey” and “The Iliad.”
My teacher was Nancy Karrandjas, who was probably the most passionate teacher I ever met in all my years of schooling.
She made me want to learn.
I was definitely a keener in grade nine. I’m tempted to say that I was a nerd, but I played every sport there was, so I didn’t fit that “mold” of the classic movie nerd.
The leap from grade eight to grade nine was massive, in every way. I think we can all agree that it was a leap socially, but in terms of the course content and the way in which we learned, it was huge.
Classics was a wonderful course, and it led students like me to take Latin in grade ten. The people who said, “Latin is a dead language, there’s no reason to study it,” were completely missing the point. Most words in the English language are derived from Latin, so anybody who’s interested in literature, writing, media literacy, and the like would benefit from the study.
What I loved about Classics was the stories! Fables. Tales. Myths.
They serve as metaphors that still apply to life today, and I find that to be so incredibly powerful.
Are you familiar with Sisyphus?
Maybe not the name, but surely you’ve seen this before:

Sisyphus is a famous character (or real person?) from Greek mythology, who was punished in a way that was both cruel and tragically ironic at the same time.
He was sent to the underworld and forced by Hades to push a massive boulder to the top of a hill. But once he reached the top of the hill, the boulder would roll back down to the very bottom.
Sisyphus’ punishment was to repeat this exercise forever.
For all eternity.
Some would describe the exercise as “futile,” while others would call it “pointless.”
I see this as a metaphor for many things in life where a difficult, arduous task is made frustrating by the realization that you’ll eventually have to do it all over again.
Take the real estate market, for example.
Every January, we start pushing a proverbial boulder up a hill.
We start slow and methodical. We look at the horizon ahead and plan accordingly.
We get some momentum as we move into February, start to look toward the busy spring market, push hard through March, April, and May, and then catch our breath as we move through June, July, and August. Then our final push to the top takes place in September, October, and November, before reaching the summit in December.
We stand at the top of the hill and look down at where we started.
But then what happens?
Well, the boulder rolls right back to the bottom of the hill, and we start it all over again in January.
If you were really sadistic, you could apply this metaphor to every year of your life, but we won’t go there today.
As it pertains to real estate and the market itself, however, I’ve always felt like we have a seriously Sisyphean element to what we do. My colleagues certainly don’t want to hear this from me, but it doesn’t stop me from mentioning it at least five, six, or eighty times per year…
With the holidays just around the corner, the real estate market is entering that really odd time of year when market participants start to behave erratically.
Just last night, Matthew made an offer on a home, listed for $1,100,000, that had been sitting on the market for a month. He and the buyers submitted a bid of $1,070,000. The seller signed it back at $1,250,000.
That made absolutely no sense.
But maybe this isn’t just a December thing. Perhaps this is the story of 2025? We’ll discuss this during our “year-end” posts in the coming weeks.
Many of the buyers out there right now are looking for deals, and many of the sellers out there are trying to decide if they’ll take a discount in order to move their property before year-end, or whether they want to “try again” in 2026.
The fall was a lot slower than people thought it would be, although with the benefit of hindsight, I think there are scores of people ready to offer a massive “I told you so.”
The November TRREB stats were published on Wednesday, and they lined up exactly how I thought they would.
The average home price in the GTA declined from October to November, now checking in at a modest $1,039,458:
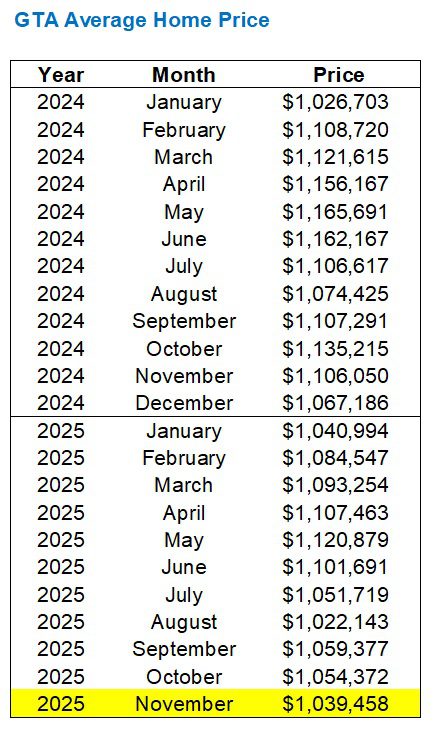
That’s low. Like, really low. Lower than I thought possible when we started the year with $1,040,994 in January.
January!
The start of the year! The boulder at the bottom of the mountain, just beginning its journey to the top!
Of course, this is an average of many different property types, in various price points, and in different geographic locations.
We’ll take a look at how prices have moved in different TRREB districts in a moment.
But for now, let’s look at that 1.4% month-over-month decline and see if it’s representative of what “usually” happens at this time of year, or whether it’s ahead, or behind…
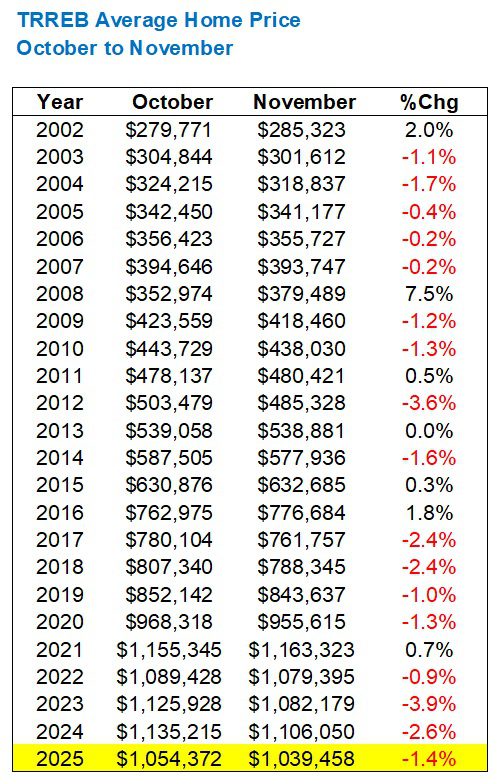
The trend is most certainly showing us that the average home price declines every year at this time.
In fact, only six times in the previous twenty-three years did we see an increase from October to November.
Compared to 2023 and 2024, the decline was not quite as steep, but if we’re looking from 2017 onwards, where the average movement is -1.7%, it looks as though last month is completely in line with the movement in the last eight years.
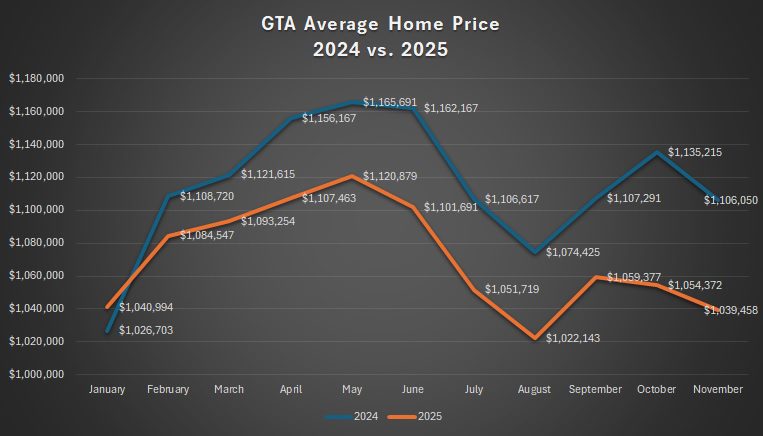
Year-over-year, the average home price is down 6.0%, which is significant!
Not as significant as the whopping 7.1% that we saw in October, but more than the trend from the previous six months, which was about 4.6%:

From the chart below, we can see how the year started in January, with a year-over-year increase, and how the gap between 2024 and 2025 really began to widen this fall:
As noted above, averages are made up of other averages!
So let’s look at how the TRREB average decline of 6.0%, year-over-year, is comprised when divided into the five largest TRREB districts:
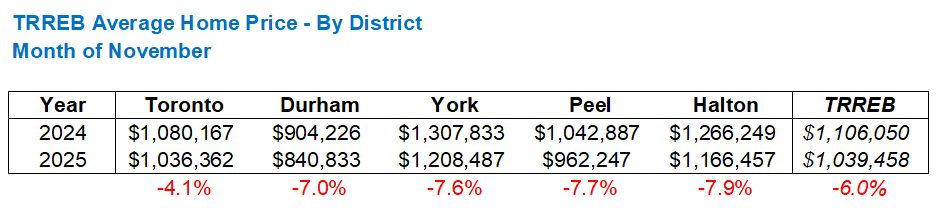
This is somewhat as expected, right?
The 416 is going to lead the 905 in a period of decline, especially after the gains in the 905 during the pandemic in 2020 were so pronounced.
In terms of sales, we hit a period in the spring where every month saw the lowest sales ever in that respective month, but that changed in the fall.
We saw the fourth-lowest sales this millennium in September as well as the fourth-lowest in October.
November did not buck the trend:
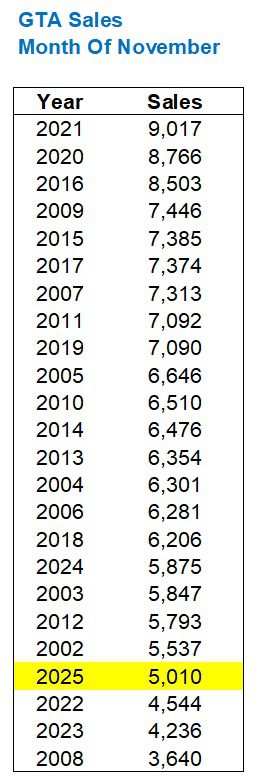
Fourth-lowest, yet again.
But this is after seeing the lowest in each of February, March, April, and May (removing 2020’s pandemic market), and the second-lowest in June.
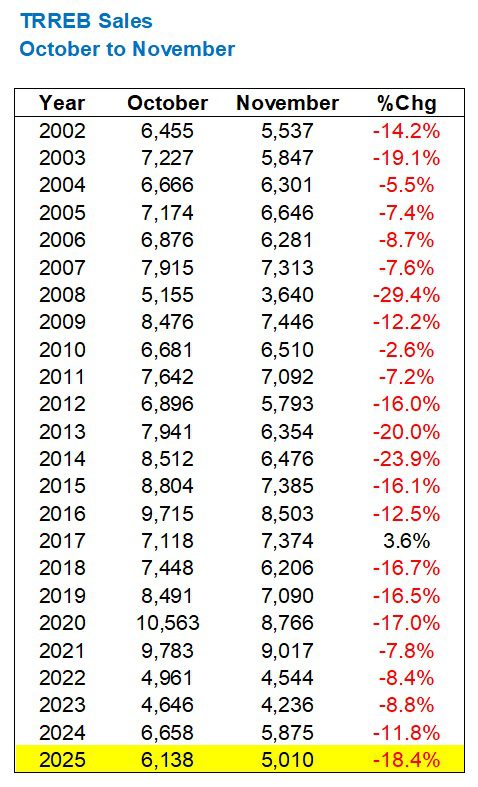
Sales declined from October to November by 18.4%.
That’s the largest decline in that time period since 2014 as the following chart shows:
Maybe we’re splitting hairs. Maybe we’re looking to be bearish.
Suffice it to say, sales decline every October to November without fail. Well, save for 2017, that is…
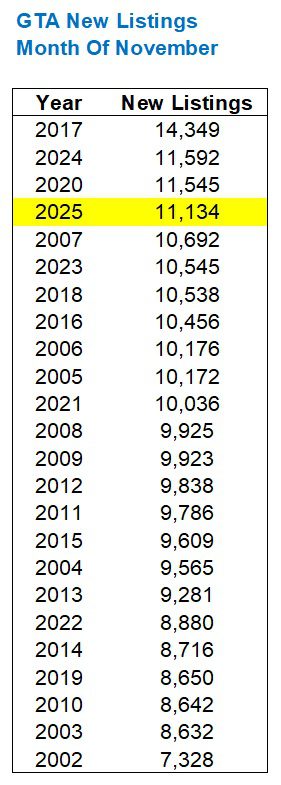
New listings dropped from 19,260 in September, to 16,069 in October, down to 11,134 in November.
Those 11,134 new listings are still the fourth-most in any month of November:
Listings are down year-over-year, but so were sales.
However, sales were down 14.7% on a year-over-year basis, and new listings were only down 4.0%.
That means the absorption rate is going to be lower in 2025 than 2024, which the following chart confirms:
It’s pretty wild to think about a time when the absorption rate was 89.8%, right?
That was the market in the fall of 2020.
Demand was at an all-time high, and supply wasn’t quite at an all-time low, but it wasn’t exactly in abundance.
Looking at the bottom of this chart, we can see 2008, 2017, 2022, 2023, 2024, and 2025.
2008: worldwide financial crisis.
2017: rolling off the twenty-year peak.
2022 onward: rolling off the post-COVID peak.
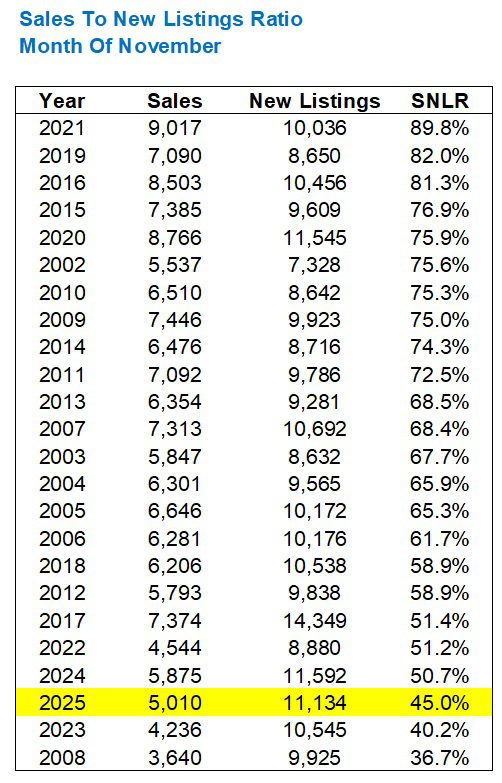
As for the absorption rate in 2025, November’s 45.0% represents the yearly peak:
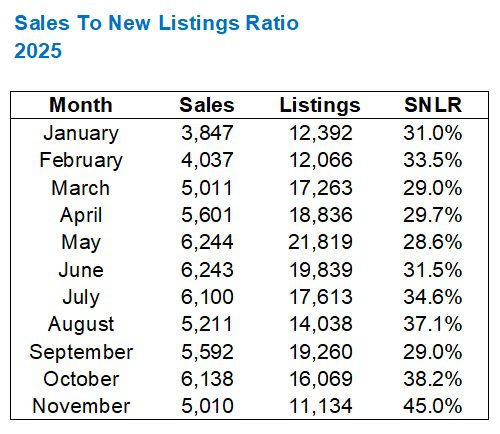
Reason for optimism, right?
Except that, as the following chart shows, the absorption rate increases every year at this time:
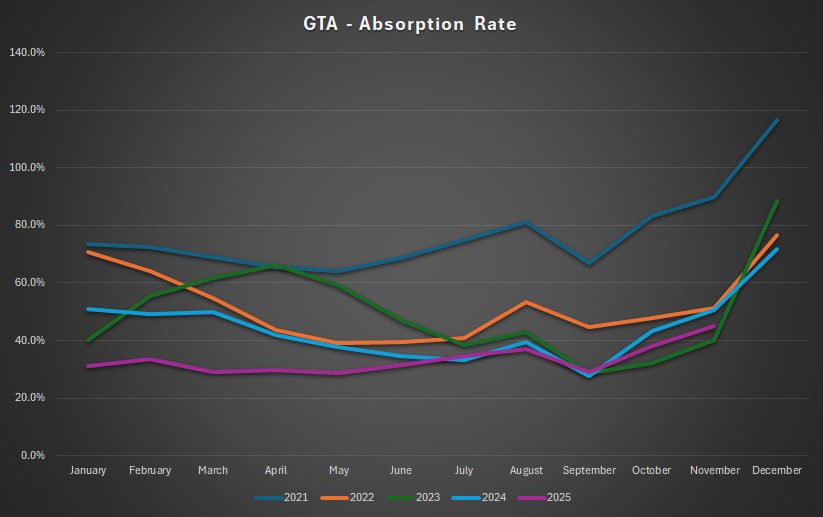
You might wonder why the absorption rate peaks in November and December every year, but it’s a function of how new listings drop off significantly. Sales drop off as well, but not nearly to the same extent as new listings, and that’s why we see the ratio peak.
Back to sales, just for a moment.
Throughout 2025, I’ve been predicting that this year would represent “the lowest sales ever.”
Coming off a record-high 122,133 sales in 2021, we hit a record-low with 66,315 in 2023.
2024 wasn’t much better with 67,984.
However, we’re now on pace to set a new record low in 2025:
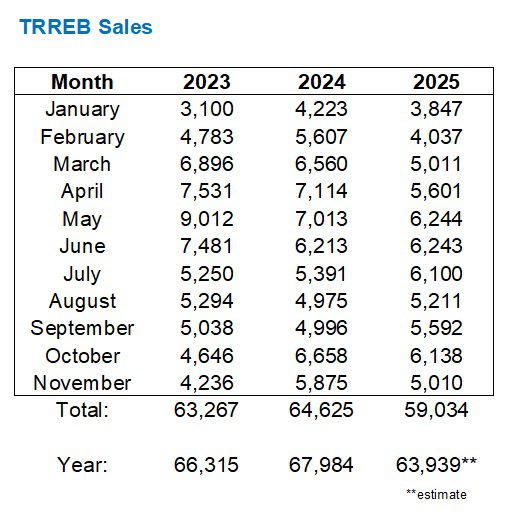
That estimate is based on the ratio of sales from January through November.
However, we only saw 3,444 sales in December of 2023 and 3,359 in December of 2024. If we took the higher of those figures and added it to the 59,034 sales to date in 2025, we’d finish the year with only 62,478.
Either way, we’re going to hit that record low.
And then, when the year is over, we’ll watch as our boulder rolls all the way back down to the bottom of the hill, and we’ll start pushing it back up again in January.
Is it just me, or was this year the most tiring year since the pandemic?
Have a great weekend, folks!


Serge
at 10:11 am
= 2017: rolling off the twenty-year peak.
was not it rather the provincial anti-spec measures?
Derek
at 10:31 am
According to our old LG, “By the time the Ontario Government announced their Fair Housing Plan – a set of policies that aimed to cool the GTA real estate market which included a 15% tax on non-resident buyers – sales were already on their way down.”
Serge
at 11:45 am
true, but not THAT speed down. That argument was voiced by the RE lobby to undermine the measures. I think those who bought after these measures, at the temp bottom, made out like bandits. In the long range, that was a blimp.
Derek
at 12:15 pm
You may be right. Certainly, any measures aimed at cooling the market were demonized by the “RE lobby”. Who needs a stress test! Interest rates never go up anyway! Don’t ban those poor foreign investors! We should be open for business!! I always believed the lobby used it as an excuse, i.e. RE only goes up, if it weren’t for you meddling politicians.
Serge
at 4:12 pm
Naturally, realtors have their interests. Back then, foreign investors were all the rage. Not anymore… Foreigners happened to be locals. But locals never were demonized. One did not see titles like “A realtor, doctor and lawyer from Burlington ruined sweet home dreams of three recent UofT graduates in Toronto, who have to live in basements now.” The mantra became “build, baby, build”, while it is not clear, who would do it and how. And is it necessary in Toronto? There is no way to predict what happens with the market in 2026.
Derek
at 10:20 am
If 2025 will be the third consecutive year of declining prices, how many more years of declining TRREB average sale price are ahead of us? I don’t thing my spring 2026 “peak again” prediction will pan out. I’ve always been too bullish though 🙂
Serge
at 8:14 am
One of the theories of RE is “the fundamentals”. Average RE price should be 3 or 5 times of the average or median population income. After a “bubble”, the average RE price should come back to the “fundamentals”. So look at the gradients of the average RE price in Toronto, and its average income, multiplied by e.g. 5, and you will get the idea. Or, you could try the number 7…
cyber
at 11:47 am
At least 1 more year – Q1 2026 is when we reach “peak % mortgage amount increase at renewal” and it can take 6-12 months beyond that for power of sales – which set the “low comp” for an area – to work their way through the system.
Spring 2027 is probably the earliest the prices might start picking up – assuming recession is sufficiently in the rear view mirror and there’s some sort of (better) deal on steel/aluminum/cars with the US that stops and reverses the bleeding in the Ontario manufacturing sector. But that’s a lot of “ifs”…
The “dearth of supply” may not start showing up until late 2028 or even 2029. While pre-con has been crushed, a lot of those projects merely converted to purpose-built rental under CMHC generous 50 year amortization terms. We are still at an all time high of “units under construction” for high rise – if both pre-con condos and purpose built rental are summed together. So really the shortage of new housing supply won’t be seen for another 2 years, assuming 2-3 year typical construction duration.
This is more or less in line with 1990s, when peak-to-trough took 7 years and saw 27% decline in prices. While we are already at 22% below Feb 2022 peak but it can easily be 2 whole additional years of more moderate declines / flatish prices before there’s more of a supply/demand shift back towards sellers.