
In the last week of September, my painter sent me a text message: “Let me know about any upcoming jobs!”
Where was this message in the summer when we were absolutely slammed? I distinctly remember having to beg her to push back other jobs to accommodate mine.
Suddenly, she was asking me about jobs?
My, how times had changed!
I touched base with my stager last week to book an upcoming job, and I gave her two dates, as I typically do, but she told me, “Either date is doable; we’re open.”
How’s that for a change from the summer?
All this is to say that I have a sneaking suspicion this is far from a coincidence.
Throughout July and August, my team and I spent all our time preparing listings for the fall. Some properties required a coat of paint and a few new light fixtures, whereas others underwent $80,000 worth of renovations. We had over twenty listings at one point in September, and we ran our partners ragged to get there.
But if our partners are now experiencing a slow(er) time in their fields, is this a sign of things to come?
Or, more specifically, for things not to come; ie, come to market.
It feels out there like most of the people who were going to list this fall already have.
Sure, there are going to be thousands of new listings in October and November, but what I mean is that if everybody in the real estate industry and supporting industries (stagers, painters, contractors, etc) is feeling the slowdown, then it’s a good measure of what lies ahead.
I have a sneaking suspicion that a larger proportion of “new” listings in October and November are going to be re-listings for properties with failed offer nights, or that have been sitting on the market, and the overall quality of listings will deteriorate rapidly.
Then there will be the folks who will decide to “hold off” until 2026.
Ah, yes, the crystal ball theory. For all the would-be sellers who don’t like what they see out there today, it’s rather easy for them to convince themselves, “Next year will be better.”
I heard that in the fall of 2022.
I heard that in the fall of 2023.
I heard that in the fall of 2024.
And in all honesty, I probably suggested that on TRB as well! But all the while, my thoughts on what lies ahead are merely educated guesses, whereas the sellers who decide to hold off until the next market cycle are always acting like they deal in certainty.
As the stats in today’s blog post will show, our overall GTA market home price is down about 4-5%, year-over-year, as has been the trend over the last several months.
I went on record in the fall of 2024 saying that things were going to get better, but they didn’t. I figured that the interest rate cuts on the horizon were going to motivate buyers to get off the sidelines, but they didn’t.
So what about now?
How long is this real estate horizon that we’re staring into?
If we’re not going to see an uptick in prices and sales in September, which is a “holy grail” month for buyers and sellers alike, then can we really expect the real estate horizon to change in October and November?
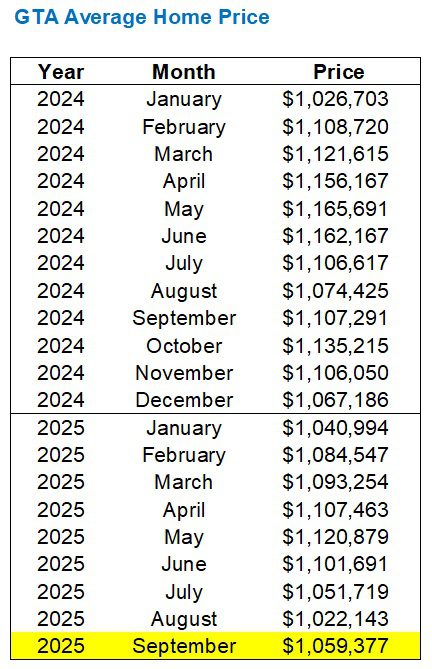
As discussed in this space last month, the average GTA home price in the month of August set a new record low, compared to the market peak in February of 2022.
That figure of $1,022,143 was surpassed in September, as the updated chart shows:
For the regular TRB readers, the updated chart also shows that I have done away with the 2023 data! I’m sure that very tall chart took up the entire screen on your phone…
The average home price increased 3.6% from the month of August.
The average home price increased 3.4% and 3.1% respectively, in the same period of 2023 and 2024, so we’re seeing a “typical” response to the fall market.
The average August-to-September price movement from 2002 through 2024 is +4.3%.
As the chart below shows, we have never seen the average home price decline from August to September:
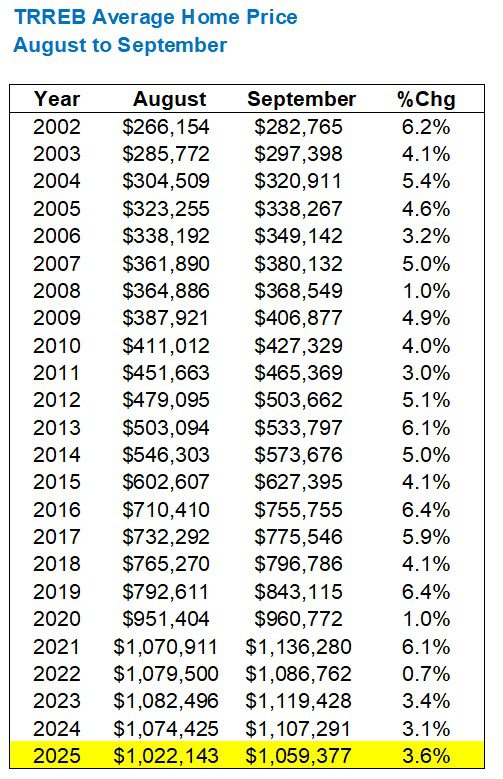
All things considered, as noted below, I would use the word “typical” to describe the price activity last month.
Typical. Flat. Balanced.
Boring?
Maybe.
Predictable?
Absolutely not!
The dichotomy between price activity on the east side versus the west side is quite stark! Every night, I’m seeing houses in Bloor West Village, Roncesvalles, Brockton Village, and the like end up with four, five, or ten offers, and yet every night, I’m seeing a whole lot of bagels for offer nights on the east side.
And that’s just the 416. If we were to look at Halton, Peel, Durham, and York, it would be a different story.
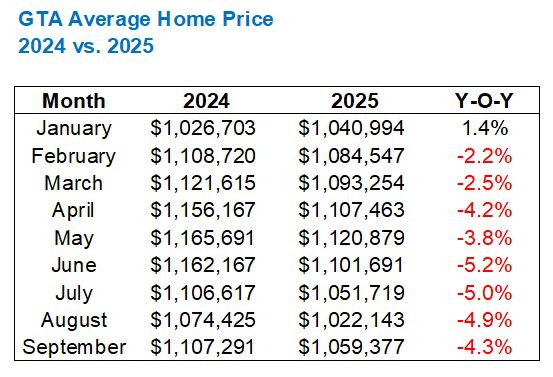
Despite the uptick in average home price from August to September, when we look year-over-year, the story changes.
The average home price is down 4.3% from September of last year.
As has been discussed in this space throughout the year, there has only been one month where the 2025 price was higher than 2024, and that was in January:

Take January out of the picture, and those two charts are mirror images of each other, are they not?
Moving in tandem, every month, from February through September.
And you’d say that June, July, August, and September, specifically, have moved in lock-step.
As the following chart shows, the year-over-year decline hit a high of 5.2% in June, but has seemed to retreat as of late:
All told, it looks like the “average” home in the GTA is down about 4-5%, year-over-year.
There are exceptions to the rule, of course.
I know, as a matter of fact, that there are houses that would sell for more today than they would have twelve months ago. But overall, and on paper, those numbers above fairly represent the overall market.
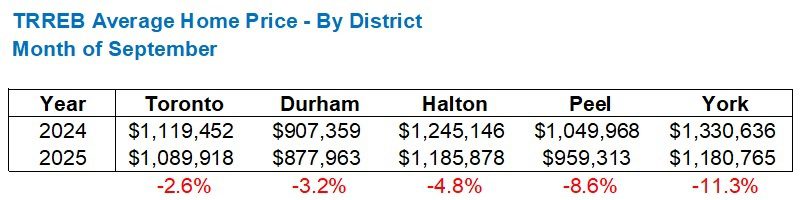
Within those numbers, however, we find these:
That’s right.
The average home price in the GTA is down 4.3% from September of 2024 to September of 2025.
But the respective home prices declines in each of the five major TRREB districts range from 2.6% all the way to a whopping 11.3%.
On paper.
And for one single month, so that does not automatically mean your home in York Region is worth 11.3% less today than last year. It just means the average sale prices in those respective periods measure up as such.
Sales have been quite poor through 2025, and while we saw an increase of 7.3% from August to September, and a year-over-year increase of 8.5%, the sales data from last month still rank near the bottom, all time:
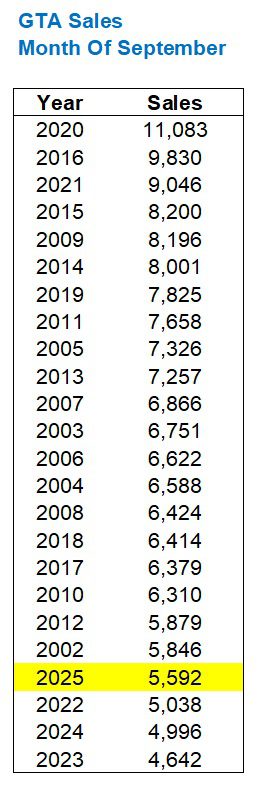
It’s pretty amazing, isn’t it?
The lowest four years in the chart are the four most recent years.
Is this the “crash” that people have been predicting for twenty years?
While a month-over-month increase in sales of 7.3% might not be anything to get excited about, it’s worth noting that this is the largest August-to-September increase since 2002.
You heard that right.
In fact, the increase in the same period in 2024 was a paltry 0.4%, and sales actually decreased from August to September in 2022 and 2023:
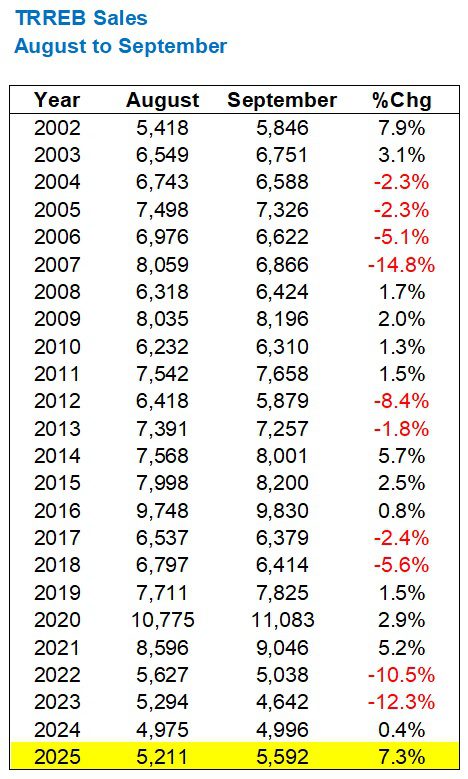
Call that a “meh” stat, but it’s an outlier.
Largest increase since 2002. You don’t say…
For those playing along at home, we are still on pace to see total sales in 2025 set a new record low.
Sales were up in September over 2023 and 2024, but year-to-date sales are still down 11.9% from 2023 and 8.1% from 2024:
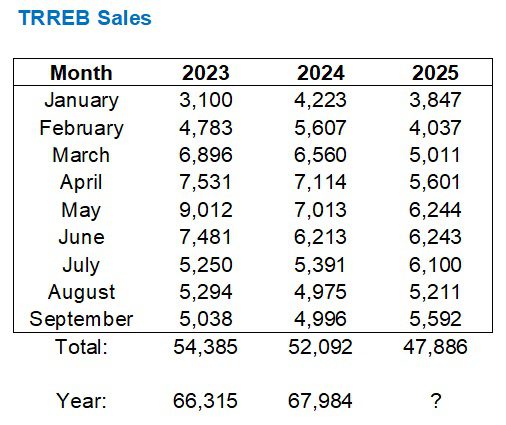
I am 100.00% certain that 2025 sales will finish below those of 2023 and 2024.
There’s nothing to stop it from happening at this point.
As for inventory levels, I don’t know anybody who expected September to be slow!
In fact, we saw more inventory last month than in the same period in both 2023 and 2024:
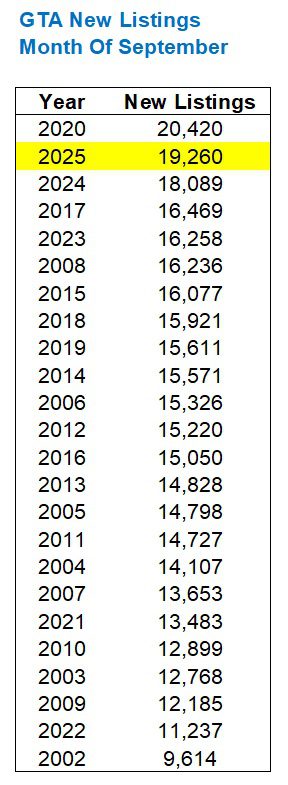
For those with a very short memory, the reason 2020 was so crazy was due to the COVID pandemic. Nobody transacted in March or April, then May and June were playing catchup, so we had an absolutely crazy fall market.
The absorption rate (ratio of sales to new listings) fell back below 30% in September.
This puts it in line with 2023 and 2024, albeit slightly ahead:
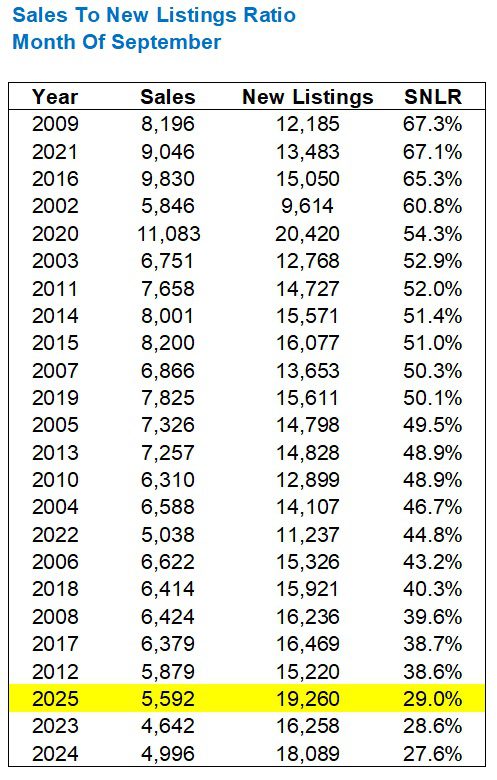
We’re still at all-time lows, however.
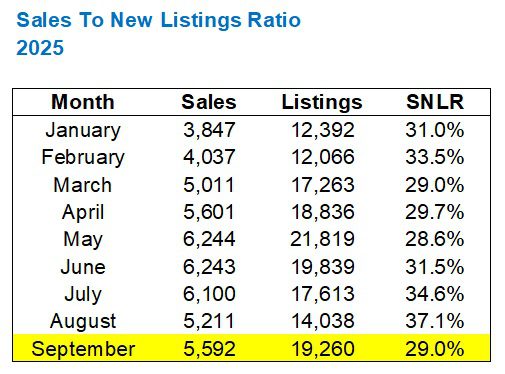
And as it pertains to the 2025 trend, we saw a steep decline from the yearly-high absorption rate of 37.1% set in August:
The absorption rate is always lower in September.
As noted before, the lowest absorption rate in any single month over the last five years was the 27.6% recorded in September of 2024.
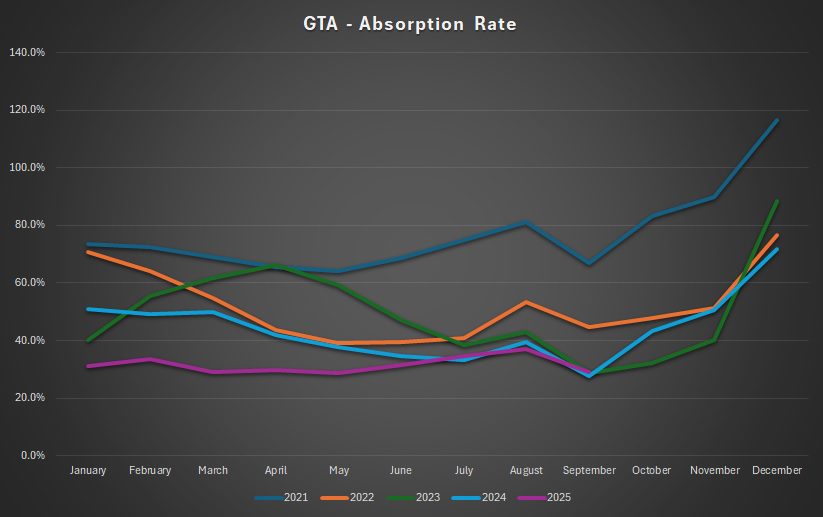
The following chart shows how the last three Septembers have essentially run at the same speed, whereas September of 2022 was more balanced, and September of 2021 was a pure seller’s market:
Last, but not least, we’ve talked a lot in 2025 about the number of active listings on the market at month’s end.
Once upon a time, 20,000+ active listings was a big number.
Then for the first time ever, we cracked 30,000, back in May.
While active listings have fallen below that number and remained there, we still see that six of the top ten months, all time, are from 2025:
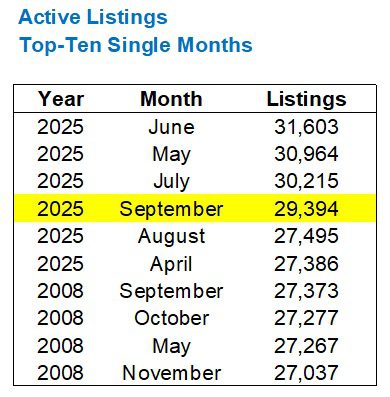
And there’s only been nine months so far in 2025.
The conclusion that I draw after looking at the September data is this:
Nothing has changed.
But if I may add one more thought:
Nothing is going to change.
The Bank of Canada interest rate cut in September did not move the market at all, and while we’ve come all the way down from a bank rate of 5.00% to 2.50%, sales remain at all-time low levels.
September tells me that October and November will be the same.
Whether we’re looking at prices, sales, or inventory, I don’t see the market moving up or down; just sideways.
The 2025 real estate horizon looks to be extending as far as the eye can see…


Marina
at 9:11 am
This is not surprising. There is just too much economic uncertainty for things to move much either way. In my circle, the talk is all question marks – what’s happening with tariffs? Will there be more layoffs? Is my job going the way of the dodo because of AI? What’s going on with Canada’s immigration policy and how will that affect my company? And on and on. Meanwhile thugs keep winning elections around the world.
Aside from the few nut jobs that sold their homes because the world was going to end on Sep 23, I’m not seeing anyone jumping to any decisions. It’s a time to hunker down and see which way things go.
just a thought
at 10:11 am
I wonder if part of the slowdown is because a lot of people put their house hunting on hold and moved their money into the stock market twelve months ago instead of real estate. The stock market’s been on a big run over the last year, so maybe people are just riding that wave for now rather than selling and looking for a new home. Feels like they’ll come back to the housing market once they feel there is no more money to be made in the stock markets.
Steve
at 12:58 pm
For those too young to remember the 1990s ….. Real Estate is cyclical ….. the boomers are attempting to cash out now, and the next generation is grappling with affordability. This will take a while.
Derek
at 11:24 am
Is it significant that in 2023 and 2024, January was the lowest average price for each year, but in 2025, we got a later month with a lower price than January?