

A client of mine emailed me yesterday and asked about a “new” listing, priced at $2,289,000.
We had viewed this listing in person about four or five weeks ago when it was priced at $2,599,000.
The property wasn’t in our price range, nor did we feel that it was worth anywhere near that price, but we were just getting our property search under way and I told them, “You’ve got to start somewhere!” So away we went, looking at this beautiful, albeit over-priced house that had been listed twice, at two different prices.
Originally debuting at $2,729,000 in June, their re-list at $2,599,000 showed that they understood the market wasn’t where they wanted it to be, but perhaps this was simply a case of reacting too late, chasing the market, or, dare I say, rearranging the deck chairs on the Titanic, so the saying goes?
Look, it’s an awesome house, but it’s just not worth “February-money” right now.
So when it was re-listed at $2,289,000, my client asked me:
“Is this like the ‘real’ price that they’re switching to, or is this priced low with an offer date? Because they can’t actually be doing that, right? That would be nuts.
Oh, but they are!
And nuts or otherwise, these folks, having remained unsold at $2,599,000 for five weeks, are now at $2,289,000…………..with an “offer date.”
Look up the definition of “strategy” in the dictionary, and I’m pretty sure you won’t be able to apply the word to this situation.
If the sellers and the listing agent think that people will see the artificially low price and line up to “bid” the $2,289,000 list price up toward $2.6M, well, then they’re just nuts.
Maybe that’s not their intention. Maybe they just want to get people through the door. Maybe they want to see if anybody will offer them $2.5M, or $2.4M, or $2.3M. Who knows.
But the point here is this: the September market will be confusing, frustrating, and chaotic, and nothing will make sense.
On the same day that one property is listed for sale, at fair market value, with offers at any time, a second property will be listed next door, under-priced, with an offer date. Then a third property across the street will be listed for a price that’s higher than February! And all the while, buyers will have no clue what to think.
Agents will play both sides, of course, but that’s their job.
Making an offer on behalf of a buyer-client?
“Don’t you know your property is over-priced?” you’ll ask the listing agent. “The sky is falling out there, rates are going up, you’re lucky I brought you this offer!”
Receiving an offer on behalf of a seller-client?
“What’s with the lowball?” you’ll ask the buyer’s agent. “I’m getting consistent showings on this property and we will get our list price, whether it’s you or from somebody else.”
I’ve been on both sides of that coin in the same week and sometimes it’s hard to keep perspective.
Upon receiving three lowballs on my last listing, I asked aloud, “What market do these people think we’re in?”
But then upon a listing agent, for a house upon which we offered, telling me that they weren’t going to work with our low offer, I asked aloud, “What market do these people think we’re in?”
It’s hard to keep perspective sometimes. And as agents, it’s our job to negotiate. That can mean manipulate, lie, and sell – often to ourselves.
On Monday, I analyzed the August TRREB stats and showed you why it’s possible that we’ve hit the market bottom in this short-lived downturn.
Some of you will call it an outlier, and others will call it a dead-cat bounce. Some will simply offer no explanation and say that the market is going to decline further, and others will suggest that we let the September and October numbers speak for the trajectory of the market.
I’m all set for a confusing and frustrating market ahead; one that’s balanced in some areas, a buyer’s market in other areas, and a seller’s market in some areas too – like in Durham Region right now, where 17-offer-melee’s are making a comeback. Figure that one out, right?
But upon the first week “back” in the fall market, I got this feeling that listing activity was down. Way down.
Not just the listings but rather the quality of the listings.
In my Pick5 video last week, rather than seek out five new listings in a given neighbourhood, price point, or property segment, I decided to hone in on a neighbourhood and analyze the “new” listings. There were nine new listings, and I sought to identify the following:
1) Are these truly new listings, or are they re-lists?
2) Are these listed with offer dates, or with offers any time?
3) Are these quality listings?
The results were fascinating, as five of the listings were re-lists, only one had an offer date, and only three were what I would call “quality listings.”
So on Monday, I sat down and copied all of the new listings in five areas into Excel, sorted through the data, and answered the preceding three questions for those neighbourhoods.
But then I found that I needed context!
So I went back to 2021 and looked at the new listings in the same week, and compared the data sets.
We’re looking at the following dates:
Tuesday, September 7th, 2021 to Friday, September 10th, 2021
Tuesday, September 6th, 2022 to Friday, September 9th, 2022
Then we’re looking at the following five areas:
C09, C10, C11 – Midtown
E01, E02, E03 – East Side
C01, C08 – Downtown
W01, W02 – West Side
C12, C13 – That Area Where Nothing Ever Sells
Why the latter? Because I’ve been asked about Banbury-Don Mills, Parkwoods, Donalda, and St. Andrews more times this summer than in my entire career combined (or so it seems), and I needed a fifth area – one that I rarely analyze. So why not?
So here’s what I’ve found.
First, we want to know the number of listings.
We want to know if inventory is up, down, or flat, since so many people have predicted this “flood” of listings.
Looking at the four-day work-week, post-Labour Day, in each of 2021 and 2022, we find the following:

All five areas that we chose to focus on saw a major decline in new listings.
And while we might be tempted to point to a sample size issue, say, looking at the 19 new listings in C12/C13 this year versus the 25 new listings last year, and say that this isn’t significant, I think that a decline in all five areas tells us otherwise.
An area like the east side – E01, E02, and E03, experiencing a 41.1% decline in new listings, has massive implications.
After all, this is home to more first-time freehold buyers than perhaps any other area of Toronto. Riverdale, Playter Estates, Leslieville, Danforth Village, East York, Woodbine Heights, The Pocket, Greenwood Park, Beaches Triangle, and The Beaches are all found within E01, E02, and E03, and all of these areas offer “starter homes,” whether that means a semi-detached or a 2-bedroom.
To see a 41.1% decline in new listings across the board in these neighbourhoods means that buyers have far fewer options.
Some will claim “there are fewer buyers,” and the fact that sales were down year-over-year by 34.5% in August might give some pessimists the ammunition they need to claim this is a “balanced market,” but I don’t see it that way.
Why?
Wishful thinking on my part?
No.
Because of all the re-listing going on!
Yes, I spent time going through MLS look at every single listing and whether or not this was a re-list, and that’s the first question on our list:
1) Are these truly new listings, or are they re-lists?
If a property was listed for sale in August and that listing was terminated, and the property was re-listed on September 7th, then I don’t consider this to be “new.”
It’s recycled.
And I had a theory, last week, that I wanted to test. So let me present the following:

Wow!
Are we really to believe that 47.0% of all the properties listed for sale in these areas were already listed for sale in the past couple of months?
Yessir!
And if you look at an area like downtown, C01 and C08, 12 of 17 listings are not considered “new.” Those same properties were available in July or August, so while we see 17 New Listings hitting MLS, only 5 are truly “new” to the buyer pool who’s actively looking at what comes out.
To put this in perspective, we need to compare to 2021:

This is exactly what I expected.
Well, I mean I didn’t have an actual expectation for the percentage of re-lists in 2021, but rather I expected that 2022 saw way, way more.
47.0% versus 22.9%.
That tells a story, doesn’t it?
When almost half of all “new listings” are recycled, what does the buyer pool actually have to look at?
Here’s a side-by-side comparison for each area:

The midtown area – C09, C10, C11, didn’t see that big a delta, but the other areas certainly did!
Downtown went from 34.8% to 70.6%! It’s “only” double, as was the 20.0% versus 39.1% that we saw on the west side, but whether you look at the absolute or the relative increase, they’re still shocking numbers.
As was the case in C12 and C13, seeing a massive 63.2% re-listing rate, which is exactly why I call this “the area where nothing ever sells.”
Next question…
2) Are these listed with offer dates, or with offers any time?
As my client who emailed on Tuesday asked, “Why would anybody have an offer date right now?”
It depends on the property, price, and location, of course.
There are certain types of properties for which I would never implement the “list low, hold-back offer” strategy. But that won’t stop other agents from trying it! That doesn’t mean we should expect to see zero listings with offer dates, however.
So what percentage should we expect?
Here’s how things looked in our five target areas through the first week of the fall market:
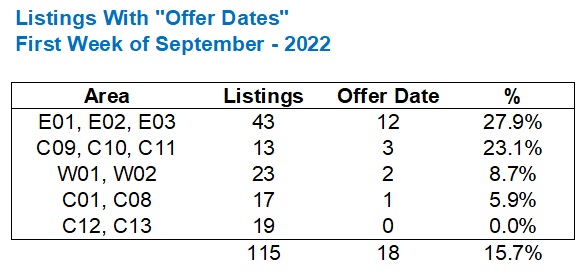
I usually look at the east side for reference, and with only twelve out of forty-three listings showing an “offer date,” that’s a mere 27.9%.
Once upon a time, every $1,099,900 listing would have an offer date, but not this fall. It’s no longer automatic.
Only one of the eighteen downtown listings has an offer date, but then again, twelve of the seventeen are re-lists, as we saw above.
In C12 and C13, the area where nothing ever sells, not a single one of these listings has an offer date.
So how does this compare to last year?
As follows:

Overall, we saw 48.0% of the new listings in these five areas have accompanying “offer dates” back in 2021.
This absolutely dwarfs the mere 15.7% from the same period in 2022.
The east side went from 58.9% down to 27.9%, and that’s my frame of reference.
So while triple the number of new listings last year had holdbacks or offer dates compared to this year, I see double on the east side, and I think that’s more representative of the market. An area like C12/C13 went from 48.0% to 0.0%, so how do we take stock of that? Most of the listings up there are re-lists and/or low quality (more on this in a moment).
Comparing 2021 to 2022 looks like this:

Note that we went from 45.7% to 8.7% on the west side. That’s simply staggering.
As promised, we now want to look at the calibre of listings by answering our third question:
3) Are these quality listings?
This is extremely subjective, so bear with me here.
There is a buyer for a run-down estate sale being sold in “as is” condition. But that’s not a “quality listing” in my opinion. I’m looking for listings that will appeal to the largest percentage of the buyer pool, and while there’s a buyer, or two, or a few for that estate sale home, there are disproportionately more buyers looking for something turnkey, renovated, and well-presented.
So let’s look at quality listings in our five areas last week:

I think I was overly generous here.
But I was incredibly subjective.
If a property was re-listed, can it really be “quality?” Sure, why not? A nice property that was listed for $1,199,000 in August, that’s now listed for $1,099,000, is still a nice listing.
However, a nice property listed for $1,199,000 in August that’s now listed higher at $1,249,000, for some unknown reason, even after the first listing was up for five weeks, is not what I’d call “quality.”
I’d also add that just because a house is $5,000,000 doesn’t mean it’s “quality” if the finishes are from the 1960’s and the house requires the buyer to spend $800,000 before they move in.
So compare this year to last year once again:
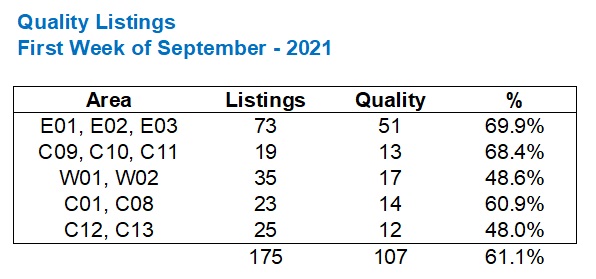
Nothing surprising here, although the delta is actually smaller than with “re-lists” and “new listings.”
About a third fewer listings are what I’d call “quality,” moving from 61.1% last year to 40.0% this year.
But just think about that, for a moment: only 40.0% of new listings are “quality.” And how many of these are re-lists?
This puts the Fall, 2022 market into perspective.
And this is exactly what I expected.
Let’s answer our three questions with three conclusions:
1) Almost half of all the “new listings” in the first week of the fall market are actually recycled, re-listings, and this is more than double what we saw in 2021.
2) A very small percentage of properties are being listed with an “offer date,” and this number is one-third of what it was in 2021.
3) The overall quality of “new listings,” with more being re-listings, is down significantly, with fewer turnkey, renovated, well-presented properties.
The sample size is small here; four days.
And this is merely the first week of the fall market.
But as many agents, including myself, sit back and say, “I can’t really form an opinion on this market until I have some data and some sales,” we can use the first week as a starting point of what to expect, or at the very least, a pattern to monitor.
In our team meeting today, we asked a very simple question: “If you had a house for which you’d like to get $1,300,000, would you list at $999,900 with an offer date or $1,299,900 with offers any time?”
The results were mixed.
50/50 in the group; an even split.
If that’s not a sign of the fall market thus far, I don’t know what is…


Marina
at 9:47 am
This is anecdotal, but I have spoken to at least four other families in my neighborhood who have considered upgrading or moving, and who have all decided to see how the year shakes out. If you don’t HAVE to sell right now (like say moving across the country), why would you sell right now? There is a ton of economic uncertainty, few choices for your next property, and the market is still full of fools that want to ruin your day.
So that’s my theory. People who can wait are waiting. I would not be surprised if things stay slow well through the winter.
Ace Goodheart
at 10:38 am
I honestly wouldn’t sell for the next ten years.
We are at the end of an economic cycle, heading into a period of high interest rates, low growth and likely a recession.
There is very little likelihood of a house gaining value for a long time. So if you buy right now, you are “catching a falling knife” so to speak, and if you sell, you are selling into a downturn which is probably going to be prolonged.
The idea now would be “if you don’t have to move, stay put”.
A Grant
at 10:15 am
“Look up the definition of “strategy” in the dictionary, and I’m pretty sure you won’t be able to apply the word to this situation.”
Sure you could. I mean General Custer also had a “strategy”, did he not?
David Fleming
at 9:23 am
@ A Grant
I’ve actually been to “The Battle of Little Bighorn.”
I spent a lot of time in the midwest United States as a child. My father shared a house in Park City, Utah with some partners. We took road trips every summer which seemed to get progressively longer and further from Park City. We went as far as Shreveport, Louisiana one summer, which is about 2,300 KM away, but I digress…
While I was probably not that engaged and interested, aged 14 or 15, upon arriving at a massive field and being told, “This was the site of the Battle of Little Bighorn,” I realized years later how important that site was, both in terms of pop culture and North American history.
The amazing part about Bighorn was that the US Army lost primarily because they were outnumbered, and they were outnumbered because three or four different Indian (native, indigenous today?) tribes banded together and fought as one. Nowadays, we can’t get three or four people to agree on which Instagram photo is the prettiest…
There’s a Crazy Horse Memorial in South Dakota which began construction in 1948 and was supposed to rival Mount Rushmore. We saw this that summer, maybe ’94 or ’95, and you could barely make out Crazy Horse’s nose and eyes in the rock. This was fifty years after construction started! I just looked it up and they’ve done his whole face. This is 27-28 years after I saw it! I’m no monument builder myself, but damn the work is going slow!
There’s a lot of history in the midwest that goes largely ignored. Then again, raise your hand if you’ve ever been to Nebraska, or knows anybody that has…
ChT
at 12:22 pm
I have a friend who IS from Nebraska. Kearney Nebraska to be exact. Living in Toronto. Mindblowing, I know.
A Grant
at 8:08 am
Funnily enough when I drove out to the Rockies 15 years ago to do some backpacking, I cam back via Rushmore, Deadwood, Little Bighorn and Wounded Knee.
Little Bighorn was only just then getting around to memorializing the Indigenous peoples who fought there as well (some stone markers where warriors were said to have fallen and a larger memorial). Still, it was a very pro-Custer and pro-America, which I found very disconcerting, given the idiocy of the man himself and the overall goal of the American campaign to remove the Lakota and Cheyenne from the Black Hills land that had been promised to them in various treaties.
Driving through Wounded Knee was an eye opener. Both in terms of the desolation and abject poverty of the reservation itself, as well as the lack of any real money that had gone towards memorializing that tragedy (especially when compared to what I saw in Little Bighorn)
Appraiser
at 3:32 pm
Answer: No panic selling.
Question: Why aren’t investors bailing out and flooding the market with listings?
Average Joe
at 6:13 pm
Yes, I believe I’ve heard of the HODL strategy before. RE needs it’s own laser eyes. Maybe lumber eyes?
Appraiser
at 11:05 am
Real estate has the word “real” in it.
Crypto is imaginary private money.
Appraiser
at 2:38 pm
“Average rents nationally have surpassed pre-pandemic levels for the first time. Rents continue to surge in Ontario and BC.” https://twitter.com/benmyers29?ref_src=twsrc%5Egoogle%7Ctwcamp%5Eserp%7Ctwgr%5Eauthor
The current game of real estate Whac-A-Mole continues.
Bal
at 5:11 pm
I failed to understand how people are able to afford high rents and mortgage payments when wages didnot move much higher ….