
On Wednesday, I mentioned an article from 2015 that said January 20th is “the best time to buy a house,” based on average home price statistics.
I decided to switch gears and look and the inventory that’s available during each month in the spring market, and compare the number of sales to both new listings, and overall active listings.
Today, I want to go back and look at “average home price,” which seems to be everybody’s favourite stat. Only I want to take a much longer, deeper look at the numbers…

A great comment from Wednesday’s blog was from “Appraiser”, who said simply:

It can’t get any simpler than that.
Sure, maybe it sounds too simple. But it’s not. Trust me.
There’s nothing simple about buying a house in the city of Toronto in 2015, and it’s utterly impossible to “time” the market.
“Kyle” said yesterday:
“Trying to time the market is unwise.”
No kidding.
The market goes up every month, does it not?
With rising house prices, every month you wait, means you pay more, eventually.
But back to Appraiser’s comment: “The best time to buy is when you find the right house.”
So somewhere between those two ideas – that the market is ever-increasing, and you need to find the “right” house, you need to find a happy medium.
On Thursday night, I met with clients who emailed me at the start of the year and said they were looking to buy a home somewhere around July/August. I didn’t talk them out of that idea, but I did explain all that “buying a house” entailed.
I told them that “buying a house” and “starting your search” are two different things, and represent two different time periods.
If somebody said, “I want to buy a house in May,” if we’re talking about a freehold, single-family home around the $1,000,000 mark, then guess when your search actually starts? Now.
You start your pre-approval process, and look over your personal finances, and you figure out what you want to, or could, spend.
You start looking at locations, and taking Saturday drives or walks through various neighbourhoods.
You absorb as much information as you can about houses, the real estate market, and neighbourhoods, and you start to get a feel for the home-buying process, which in this hyper market, is easier said than done.
Then you start looking seriously at homes, and eventually, making offers.
You make an offer, and lose in competition. And then perhaps, you lose again.
Eventually, you’re successful. And having started this process in January/February, do you know what time it probably is?
May.
So when a person tells me, “I want to buy a house in May,” they’re crazy to think that on May 1st, they open their eyes, roll out of bed, and sign on the dotted-line that afternoon.
Sure, not everybody takes 3-5 months to buy. But from “I want to buy a house” to “I bought a house” is a process, and in this market, it can be a long and difficult one.
So to echo Appraiser’s thoughts, you can plan to buy a home in this month, or that month, but given the complexity of the market, and the current market conditions, plans can, and most often do, change.
I wanted to look at the “average home price” statistics from the past four years, and see if we can make any more conclusions about the timing of the real estate cycle.
I spent a while on this data, as you will see from the charts below, and call me a nerd – but I enjoyed this more than just about anything I did this week!
First, let’s look at the average home price, each month, for the past four years.
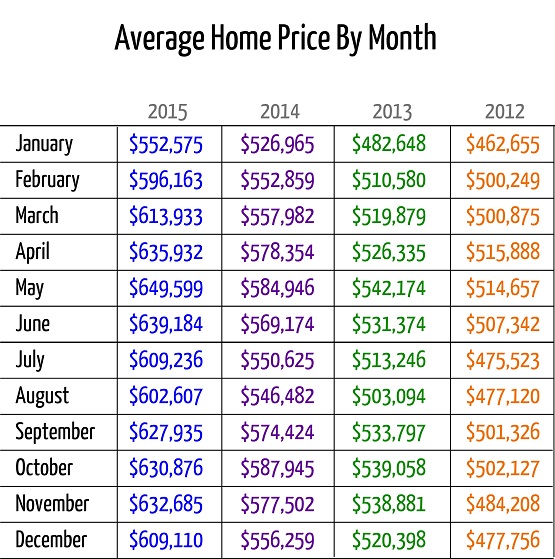
Okay, so nothing really exciting here, other than the colours I used in my charts, which now I kind of regret…
In any event, I used these as a baseline for the further charts, so don’t spend too much time on that one.
–
The next chart shows the “month-to-month” increase in the average home price.
Do not confuse this with the monthly “year-over-year” stats.
This is, in fact, the increase in the “average home price” from one month, to the next, in the same year. January 2015 to February 2015, and so on.

I find that chart absolutely fascinating.
Here are my biggest take-aways:
1) January is cheap, or February is expensive.
However you want to phrase that, it says the same thing.
The average home price went up 7.9% from January of 2015 to February 2015? Am I reading that right? Then 4.9%, 5.8%, and 8.1% in the previous three years respectively.
Now how do we explain that?
There are a LOT of “re-lists” in January for properties that didn’t sell in the fall. January is notorious for “junk” listings.
There are also traditionally fewer “luxury” homes sold.
January of 2015 saw 44 homes sell over $2,000,000, out of 4,355 sales – or 1.01%.
June of 2015 saw 240 homes sell over $2,000,000, out of 11,706 sales – or 2.05%.
Call it a small difference, but the proportion is more than DOUBLE.
Maybe January really is the best time to buy a home, although so far in 2016, it ain’t cheap!
There were twenty-four offers on 271 Monarch Park Ave on Tuesday night. And eighteen offers, I’m told, on 19 Marlow Ave.
So maybe 2016 is where this trend ends?
2) The market is hot in the spring and fall, but cools in the summer.
Well no kidding.
I don’t think we needed statistics to tell us that.
3) May is hotter than June.
This might come as a surprise to some people, as common perception is that the market gets progressively hotter as we approach July, but the numbers show a decrease from May to June in all four years.
4) September looks hot, but only compared to the summer.
In all four years, September saw a massive increase in the average home price compared to August: 4.2%, 5.1%, 6.1%, and 5.1%, which are numbers reminiscent of February.
But in all four years, the average home price dropped from May to June, June to July, and in 3 out of 4 years, it dropped from July to August.
So in all four years, the average home price in September, was actually less than May.
5) The fall market increases at a slower pace than the spring.
The increase from September to October is quite modest, whereas the increase from February to March, March to April, and April to May is quite pronounced.
Granted, the fall market is 3 months, and the spring is 6.
–
The next chart looks at the average home price, by month, year-over-year.
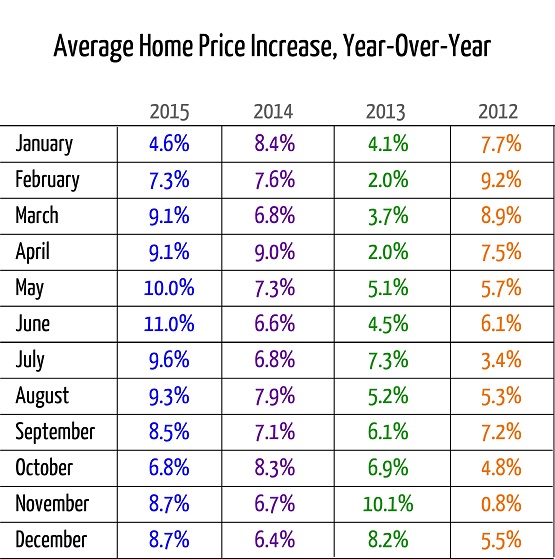
This tells a bit of the same story.
The only outlier here is October of 2013, which for some reason saw a massive spike in year-over-year value at 10.1%, which was odd, given the average increase in home price in 2013 on the whole was only 5.2%
But perhaps 2013 was an outlier altogether.
The market increased 9.8% in 2015, 8.3% in 2014, and 6.9% in 2012.
So the “modest” 5.2% increase in 2013 explains why April was only a 2% year-over-year increase, up against the 9.1%, 9.0%, and 7.5% of 2015, 2014, and 2012 respectively.
The other massive outlier here is November of 2012, which saw only a 0.8% year-over-year increase in house price, up against 8.7%, 6.7%, and 10.1% in the other years, and sandwiched in between 4.8% in the October that preceded it, and the 5.5% in December that followed.
–
So that chart leads into the next one, which I thought was really cool.
Here, I took the average increase in home price for the month, and subtracted the average home price for the year.
The average home prices for the years are shown in grey with the + symbols.
This is effectively the “net” value to the home-buyer.
If the market went up 9.8% in 2015, but the market only went up 4.6% in January, then in theory, the buyer got a relative discount of 5.2% in that month.
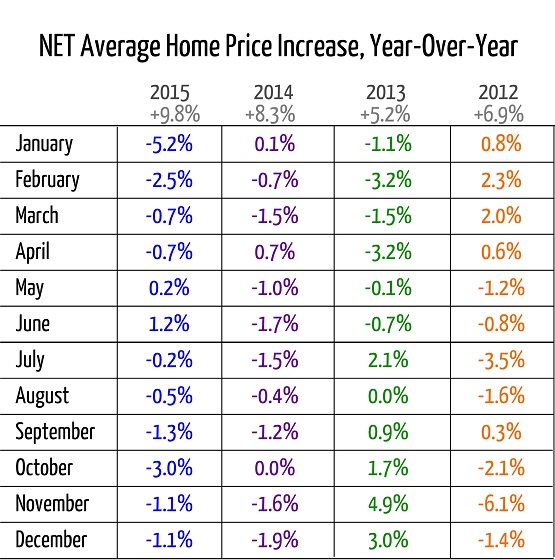
These numbers are quite interesting, because while the two charts above tell pretty much the same stories across the board, save for a couple outliers, this data isn’t that clear.
Anything with a positive percentage shows that, in theory, the buyer paid at a higher increase relative to that year’s average.
And anything with a negative percentage shows, in theory, that the buyer may have got a deal.
Notice how these numbers aren’t nearly as large as the numbers from the other chart.
28 of the 48 months are less than +/-1.5%.
“Big” swings occur only three times – January of 2015 at -5.2%, November 2013 at +4.9%, and November 2012 at -6.1%.
And even then, we can’t really draw any conclusions, since those two November numbers tell opposite stories!
In November of 2012, a year when the average home price went up 6.9%, the average home price that month was only up 0.8%, so buyers seemingly got an incredible deal.
But then next November, in 2013, a year when the average home price went up 5.2%, the average home price that month was up 10.1%, so buyers seemingly overpaid.
I suppose not being able to draw any patters, or conclusions, from these numbers, tells us one thing:
You absolutely, positively, can not “time” the market.
With erratic statistics, month-to-month, there’s no telling when the best “deals” will come.
So stick to what “Appraiser” said on Wednesday, and buy a home, when you find the right home.


Marina
at 8:59 am
Appraiser was 100% correct.
The reality is, houses are not commodities. Unless you are a very special person, you won’t have the same life in one house as another. Timing the market assumes that a house you want will come up for sale in any of the above months. And then, wow, you pay 5% less for the same house in January than in May! What a deal!
Yeah, no.
If you are in the market for a house like Monarch Park, I would think you would pay more regardless of timing. Actually you may pay MORE in January simply because of an even bigger lack of comparable inventory. There are 23 people out there still searching. Who would think that 23 people will sit back and let them walk away with a bargain?
tony
at 9:13 am
David,
Great read, thanks for putting together all of this info.
Not that I am trying to pick you apart, but your “Net average home price chart YoY” makes little sense. I don’t have the time to dig-in as to the why, but just look at the numbers..
Also – the later in the year you buy, the more appreciation has taken place.
In any event, thanks for the interesting read!
Have a nice weekend.
Best,
tony
Appraiser
at 5:42 pm
“For every complex problem there is an answer that is clear, simple, and wrong.”
H.L. Menken
Ch.T
at 7:48 am
Thumbs up for the amount of work you put in this… However I have to agree with tony.
That chart says that with the exception of two months in 2015 the average buyer got a deal? I doubt that.
There are lies, damned lies and statistics. (Someone smart and famous said that – not me)
Wut
at 3:10 pm
Surprised so few comments on this, this is the kind of blog posts that I find most useful. Maybe the wrong question was asked. If the best time to buy a house is whenever you find the one you want, maybe the better question is, when is the best time to sell a house?
Looking at the average home price by month, it seems like mid-May is the best time and the worst time to sell your house is mid-November to mid-March and July-August. It seems like people don’t want to shop when it’s too cold or on summer vacation. Is every market as seasonal as ours?
I take from that it’s better to sell even when there’s more competition in the market because there’s more shoppers and more shoppers will always overpay as they’re put into a bidding situation.
Appraiser
at 12:28 pm
I would argue that if you have a low-rise property to sell in Toronto and it shows reasonably well, any time of the year will do. Multiple offers are happening every day of the week.
Jonnathan
at 9:03 pm
Great article David!