You all remember Thomas, don’t you?
While I’m sure Thomas prefers seabass or beef tenderloin to standard fowl, I’m sure he enjoyed his metaphoric chicken dinner in 2020 with a side of McCain Smiles…
Newer readers won’t know what I’m talking about, but the veterans do, and they’re already debating whether to skim this part.
After all, this would be, what, like, the fourth or fifth victory lap for Thomas?
But it adds context to both today’s blog, today’s blog challenge, and of course, blog reader Derek‘s comment from last Friday.
Back in April of 2018, it was blog reader Derek himself that posed a question to the readership:
Should we try to amuse ourselves with a game? I don’t know what metric would be best to use, i.e., avg price or HPI or freehold or condo or GTA or 416 etc., etc., (David or the other smart people can decide the goal posts) Do we take the Feb numbers as the top and work from there? Anyway, someone could define the parameters and we could post our guesses as to how much, if any, prices will change for the chosen metric(s) between top and bottom. Maybe even guess the month the bottom comes?
The challenge was accepted!
We decided to look at the pre-pandemic peak average home price of $910,290 from February of 2020, and place our bets on when the TRREB average would surpass that figure again.
After all, it had plummeted to $821,392 in April!
Many market bears thought this price would continue to decline.
We spent the next few days placing our bets and then blog reader Chris, once a TRB staple but whom we haven’t heard from in quite some time, summarized all of our predictions:
Thomas: June or July 2020
Kyle: Fall 2020 or April 2021
Tony: January or February 2021
David: April 2021
J G: April 2021
Derek: April 2022
Condodweller: Feb 2023
Mxyzptlk: April 2023
Chris: April 2024
Pragma: 2028
Potato: Sometime in the 2030s
Jeff: Never (adjusted for inflation)Did we ever figure out where Ben’s guess landed? He was a bit non-committal on that one, but sounded like a few years.
As history shows, the TRREB average home price did not take “years” to regain its former glory, but rather only months.
June of 2020, the TRREB average home price came in at $930,869, and blog reader Thomas won the contest.
That, of course, spawned this post:
July 8th, 2020: “Winner, Winner, Chicken Dinner”
And it explains my fowl reference above, for those that had no clue why I was talking about steak and fish…
Last Friday, when I wrote about the economists’ predictions from RBC and Desjardins respectively, blog reader Derek made the following suggestion:

Oh, Derek, the timing is most definitely right!
Not only that, Derek has given us multiple angles for this wager.
So here’s were I’m at with this: I want to know how people feel not just about when we will surpass last year’s peak, but also whether or not we have hit bottom.
So keeping mind that the TRREB average home price in February was $1,095,617, our new bet will go like this:
1) Does the $1,038,668 TRREB average home price from January represent the market bottom?
2) If “no” for the above, which month will prove lower than $1,038,668?
3) When will the TRREB average home price surpass the peak of $1,334,554 from February of 2022?
Before we answer, let’s take a look at a few periods of market decline.
Do you remember 2008?
I do.
I was 28-years-old. I was in great shape, had my whole life ahead of me, was optimistic about the Maple Leafs’ chances…
….wait, I got off track there. I meant, “Do you remember the market in 2008.” Right. Right…
There was a worldwide financial meltdown in 2008 and while Canada proved to have the safest banking system in the world, eventually the crisis made its way to Canada and had an effect on the real estate market here.
The TRREB average home price peaked in April of 2008 at $398,687.
From there, it declined in May, June, July, and August, before slightly rising in September, but then declining in October again.
The price hit bottom in January of 2009 at $343,632.
That was a decline of 13.8%.
While the absolute decline doesn’t seem like much to you – from $398,687 to $343,632, the relative decline of 13.8% was significant.
So the question is: how many months did it take for the market to recover?
Here’s a chart:

It took fourteen months.
Not a long time, right?
Hardly!
And as our next chart will prove, that 2008 decline-to-recovery was impressive.
Do you remember 2017?
I do.
I was 37-years-old. I was……wait…..we’re not doing that again.
Do you remember the market in 2017?
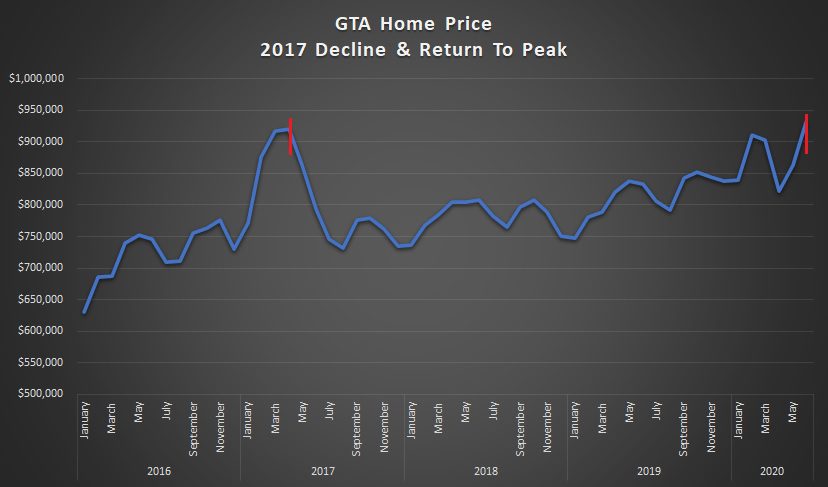
The average home price skyrocketed from the high-$700’s in the fall of 2016 to over $900,000 in the spring of 2017.
Then the federal government, provincial government, and municipal government all joined forces to “combat housing prices” and absolutely crushed the market. Sound familiar?
The TRREB average home price was $920,791 in April of 2017. It declined to $863,910 in May, then $793,915 in June.
The results of the government’s “plan” were incredible, and not in a good way.
The average home price hit a low of $732,292 in August of 2017.
That was a decline of 20.4%.
So the question again is: how many months did it take for the market to recover?
Here’s a chart:

It took thirty-eight months.
This decline was far more impactful than the one from 2008, although ironically, it provided “stability” in the market for 2 1/2 years or so. That was still a seller’s market, but it wasn’t insane like some of the booms we’ve seen in the past two decades. The chart above clearly shows that, from the fall of 2017 through the end of 2019, where you have seasonal volitility but no incredible peaks or valleys.
Now, do you remember early-2020?
I do.
I was clinging to my 30’s for dear life. My son was just born and had the audacity to arrive in the first quarter of the SuperBowl, and the world was concerned about this crazy new virus on the other side of the world.
Also, the real estate market was on fire!
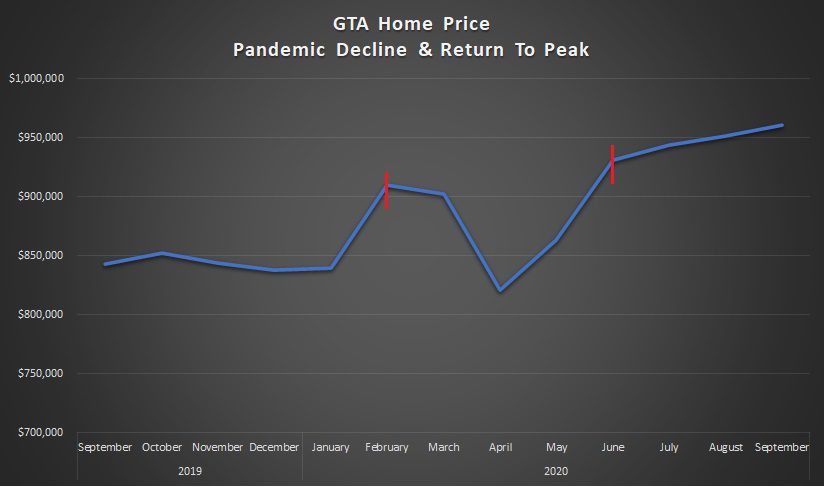
The TRREB average home price was hanging out in the mid-$800’s in the fall of 2019 but then shot up from $839,363 in January of 2020 to $910,290 in February.
This felt like 2017 all over again.
But then came the Coronavirus, we were all told to stay at home, and market activity died.
Sales and listings were down by 80%.
And the average home price plummeted to $821,392 in April of 2020.
That was a decline of “only” 9.8%, but it seemed like the market was in freefall.
This is when we started our game here on TRB, as I showed you above.
And while we all know that Thomas won our contest, does anybody remember how long it took for the market to recover?
Here’s a chart:

It took two months. 😂
Not much of a chart there, but also not much of a “downturn.”
The downturn, as history proved, was based more on the lack of sales and the quality of sales, since I’m pretty sure most of the properties to sell in April and May were lower-end as opposed to higher-end.
And as we all know, the TRREB average home price continued to grow from there.
It climbed in July, August, September, and October.
It broke the $1,000,000 mark with authority in February of 2021, hitting $1,045,488.
And the rest, we know.
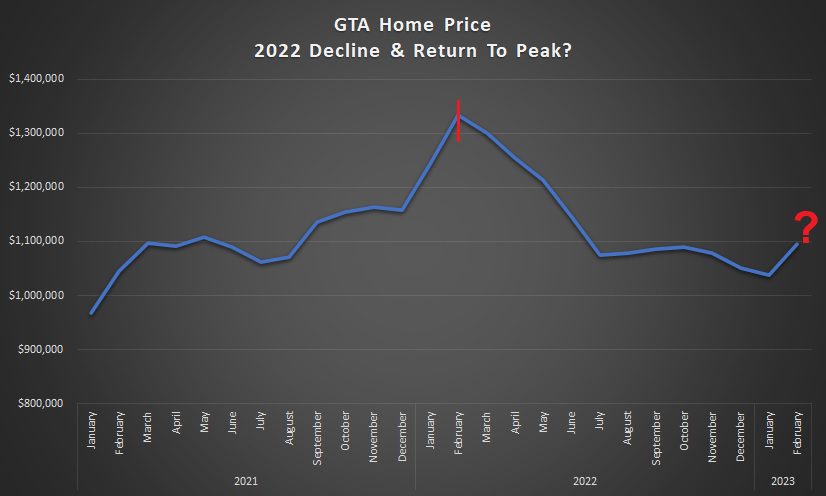
We peaked in February of 2022 at a whopping $1,334,554.
We bottomed in January of 2023 at $1,038,668.
Here’s a chart:

Five years from now, that peak-and-valley wont look nearly as sharp.
But for now, it’s hard to ignore.
So, let me pose my three questions again:
1) Does the $1,038,668 TRREB average home price from January represent the market bottom?
2) If “no” for the above, which month will prove lower than $1,038,668?
3) When will the TRREB average home price surpass the peak of $1,334,554 from February of 2022?
Please post your answers in the chat below.
We might come back to this in five years. But we might come back to this in eight months.
But we won’t be coming back to this in two months a la Thomas, circa 2020.
Will we?


JF007
at 7:17 am
#1- Yes
#3- Jun’25
Bankersorta
at 11:01 am
1 – No
2 – November 2024
3 – May 2026
Francesca
at 8:14 am
Being older than you I remember all the years you reference. We sold in and bought in the spring of 2009 and thought we got relatively good value on buying but wish we had made more money upon selling. The 2017 boom was insane. I remember how quickly prices dropped and how it seemed like in 2018 and 2019 it was taking forever for anything to sell and how sellers were hanging on to 2017 prices like mad men. I personally think January of this year was the bottom. Why? Cause in my north york area condos that were sitting for months and then being terminated for almost a year are now selling pretty fast for closer to asking and some even over asking. To me it seems like buyers are now used to the higher mortgage rates and seeing the inventory is still not huge it’s effecting prices. I think it will take at least a year to surpass last February peak prices. If something unexpected happens like a recession or further rate hikes or huge increases in inventory maybe longer so I want to wager middle of 2024 possibly even spring 2025. But if I have to be more specific I would say may-July of 24 is when we may be back to February 22 peak prices. Am interested to see what others think!
Appraiser
at 9:14 am
1) Yes.
2) May, 2025.
Kyle
at 9:32 am
1. Yes, the bottom is behind us
3. April 2024
London Agent
at 9:48 am
1) Yes
3) Spurred forward by rates dropping sooner rather than later: February 2024
Ed
at 10:10 am
1- Yes
3- Feb 2025
Anwar
at 10:18 am
1) For sure we have hit bottom but there are still a lot of persistent bears.
2) Long recovery ahead, like 2017-2020. My prediction is May of 2025.
Adrian
at 10:56 am
1) yes
3) Oct 2024
Bryan
at 12:33 pm
1. Yes we hit bottom in January
2. Because I think guessing different than others is fun, I will say October 2023
The argument: As a caveat, I would not put any money on this, but as I think putting out the same mid-2024/early 2025 guess as others would be boring, here is the case for Fall 23′. I think it is reasonable to believe that the market will continue its gentle upward slope if rates stay the same, so my guess is predicated on an early cut. Why would/could that happen? Simply put, inflation peaked in June 2022. Since then, CPI has risen just 0.6% in 7 months… that is an annualized increase of a mere 0.98%. In the US, the financial sector just got a pretty good slap that will likely reverberate here to some extent as well (and will almost certainly mean the fed can’t raise rates to where they might have a week or two ago), making it more likely that the 7 month trend holds. So what happens in June if it does? Well for starters, YoY inflation will suddenly drop from the ~6% it is now to <1%. People will freak out and the BoC will be forced to cut rates over the summer. Buyers will jump off the sidelines faster than sellers can, and combined with the gentle increase in activity up to that point, and the general fall frenzy, prices will start to move up triggering the usual Toronto FOMO and hitting something close to the February peak and…. then hopefully relaxing a little after that once sellers catch up in the race off the sidelines.
Bryan
at 2:05 pm
*3 not 2
Derek
at 1:13 pm
1) No
2) December 2023
3) March 2026
Good luck and may the rosier outlooks prove to be true!!
Mary Keller
at 1:25 pm
1. Yes, this was the bottom.
2. n/a
3. April 2024
My guess is based on our local market here in Kitchener Waterloo. Our prices peaked in Feb 2022 and now our prices are back to where they were 2 years ago.
Mary, K-W Realtor
By the way, I love your blogs and posts!
Alex
at 2:48 pm
January 2023 was bottom.
May 2025 will see new peak near 1.4 mil
Lily
at 4:31 pm
1. Yes
3. May 2024
Daniel
at 5:08 pm
1) Yes
2) See above
3) 2027. It’s tougher to go up than down. We have to see a 23% gain to surpass the February peak. 6% per year takes us to 2027. Why should we expect more than 6% per year?
JL
at 7:25 pm
I feel like the key to predicting this is to map out interest rates, as all other factors seem minor in comparison.
For contest purposes I’ll say:
1) No
2) December 2023 (albeit flat or at comparable level to Jan number, not much lower)
3) March 2026
I sort of see a mini spike this spring/summer, another mild drop down, and then a gradual climb back up in stagnant economic conditions. But it all really depends on interest rates in my mind; if BoC in their infinite wisdom decides the world is ending (again) and we need free money and rates back down to 0% by July, that would naturally change the equation.
Sirgruper
at 9:08 pm
I hope I am wrong but we haven’t had a 1989-1994 since, well,1994. I think this is a dead cat bounce but who the hell really knows as there are black swans and good surprises anytime. Even if someone is right it will probably be due to circumstances not foreseen. So, just like Fred Flintstone on the Price is Pride guessed his 2 cents, here is mine:
1. No
2. Feb 2027;
3. Mar, 2029
Trent
at 10:05 pm
Yes,
Nov, 2024
Ace Goodheart
at 11:19 pm
Market bottom: Unfortunately, yes. It would appear that we are going to take the “devalue the currency to save the economy” route, and you can’t print houses.
When will the February 2022 peak be surpassed? – by my calculations, if inflation is allowed to run hot, then 300,000 / two inflation peaks at a six month interval = we should hit a new high in about two years. I would say February 2024.
That also allows for the inevitable recession which should hit at some point this summer (recessions are short, usually less than two years – we should be at the tail end of it around Feb – March 2024).
Joel
at 4:53 pm
Yes
March 2026
Dan
at 7:54 pm
Yes, mid-end 2023.
Driven by credit and money supply.
Global economy breaking. Cracks appearing.
Expect credit crisis by end of 2023/early 2024, driven by US.
Slow grind upward of prices until then.
Sizeable interest rate reductions (to combat cascading effects of ongoing solvency & emerging banking crisis) will be rocket fuel to all assets, including real estate.
Then a brief but impactful price drop due to credit crisis.
Extraordinary, immediate stimulus (QE infinity) deployed to resolve credit crisis.
All assets rise, hard assets rise faster.
Real estate prices accelerate, fast.
This is the new normal, until the next, just-around-the-corner local/global financial crisis hits.
Dan
at 7:57 pm
Yes, mid-end 2023.
Driven by credit and money supply.
Global economy breaking. Cracks appearing.
Expect credit crisis by end of 2023/early 2024, driven by US.
Slow grind upward of prices until then.
Sizeable interest rate reductions (to combat cascading effects of ongoing solvency & emerging banking crisis) will be rocket fuel to all assets, including real estate.
Then a brief but impactful price drop due to credit crisis.
Extraordinary, immediate stimulus (QE infinity) deployed to resolve credit crisis.
All assets rise, hard assets rise faster.
Real estate prices accelerate, fast.
This is the new normal, until the next, just-around-the-corner local/global financial crisis hits.
cyber
at 12:25 am
1) Yes
2) Jun 2024
Last “run up” took ~6 months (from July 2021 price, where we were roughly in January of 2023), to the Jan 2022 peak. So did the 2017 one ahead of the tightened stress testing rules.
I believe the next one may be primarily timed by the OSFI rule tightening again. The timeline for this is a little bit uncertain. In 2017, new rules came into effect ~4.5 months after the public comment period ended. The current public comment period on revised B-20 ends mid April, so earliest that the new rules could come into effect is Sept 2023. On the other hand, in Jan 2023, when kicking off the consultaton period, OSFI announced they expect it will take ~1.5 years for these changes to make their way into mortgage products.
The “FOMO clock” will likely start ticking once people learn OSFI is serious about the changes, and which changes, specifically, will be implemented. I’m taking a stab here, but end of the year makes sense as the timeline for at least OSFI deciding what to do or implement. (Even if they know a bit earlier, they’ll likely wait to announce so that the timeline matches with first BoC interest rate cuts – i.e. until there’s a combo of bad B20 news and good interest rate news for OSFI’s big bank friends.)
In the meantime, I’m guesstimating that the GTA average prices will grow but not stupenduously. We still have the remaining “wait and see” individual buyers and investors who will sit out on the sidelines until there’s more certainty around trough being behind us, and more indication that the rates are not going further up or starting to get cut.
With most forecasts projecting some version of a recession in Canada in the second half of 2023, interest rate cuts are maybe 6 months away.
‘Real assets’ like housing become more attractive in a recessionary and inflationary environments (which we’re bound to be in, with BoC already diverging from the Fed on interest rates). Especially if combined with decreasing interest rates, which financials markets are already ‘pricing in’ for end of 2023 in Canada.
David Fleming
at 3:56 pm
Just realized that I never made my prediction!
1) Yes
2) N/A
3) October, 2025
AT555
at 2:41 pm
1) Yes
2) N/A
3) April 2025
Marina
at 3:12 pm
1. yes
2. April 2025
I think we will have an up/down zig zag for a while, maybe even another dip next winter. But barring any massive changes, I think the exuberance bubble of Feb 2022 has been retracted and we are back on course to keep growing based on demand.
Also, given inflation numbers, prices can’t fall much more. At least not without some other major economic event.