

I realize that what had become an unofficial monthly feature here on Toronto Realty Blog – some sort of “stats roundup” or post about the numbers from the past month, had fallen by the wayside of late.
March was busy, April was busier, and May is just nuts so far.
But I’d be remiss if I didn’t sit down and examine the recent TREB numbers, thus allowing the readers to debate and fling a little mud, and so I set some time aside on Tuesday morning to ensure I don’t miss yet another month with this feature.
Anecdotally, I can tell you that this might be the busiest month I’ve ever had.
I’m not a “listing agent” per se, in that I don’t have billboards and garbage cans in a neighbourhood, and sit on the PTA, while handing out ice cream in the park in attempts to woo the area residents, and yet l still find myself with some 13 listings this month.
Where did all the activity come from?
A few of the listings are coming from clients who bought, and now need to sell.
But the majority of listings are merely “sellers” in the traditional sense.
Tis the season for selling, as the real estate calendar goes.
Ask anybody with an iota of real estate knowledge, “What do you think is the busiest month of the year in the real estate market?” and I would hazard a guess that an overhwelming majority of folks would answer, “May.”
Some might suspect it’s June, which is warmer, prettier, and people might be marginally happier, and ready to transact. Some might suspect it’s September or October, which are typically very busy months in a shortened Fall “season” for real estate. April is a good month, as is March, but May, historically, has been something otherworldly.
I told my wife toward the end of April, “We need to be on the same page for the month upcoming,” and warned her about what lay ahead. Anywhere from 12-15 listings, which means upwards of 15 “offer nights,” plus somewhere in the neighbourhood of 10-20 offers for buyers. That means one full Saturday of work, the odd half-day on Sunday, and a lot of nights where our dog, Bella, will have to stand in for me.
I felt as though 2019 started slowly, even though the numbers pointed towards a busier-than-usual few months to start a year, and now I see the market ramping up big-time.
I don’t know if it’s going to top out in May, or continue into June, but what I’m seeing, and certainly what I’m experiencing with myself and my team, points to a potentially chaotic month.
When I sat down to look at the April numbers, my eyes first went to where they always go: price.
How can a person not start there? It would be like taking a bite of your side-salad before you cut into your steak.
But after looking through sales, active listings, new listings, days on market, and looking at the Home Price Indexes as well as some of the 905 data, what I’m seeing, in my humble opinion, is a month of April that showed a re-energized real estate market.
Let’s leave the sales and listings for another day and rather focus on price, although it bears mentioning that with sales up year-over-year, and active listings down year-over-year, it’s no wonder prices increased.
The average home price in Toronto in April was $820,148.
This is significant for two reasons, with the second being far more important than the first.
For starters, this represents a 4.0% increase, month-over-month, in the Toronto average home price from March.
Monthly fluctuations aren’t the best measure of the market, but it’s somewhat hard to ignore.
For those that want to suggest it’s meaningless, you can, and you might be correct.
The average home price increased from $748,328 in January to $820,148 in April – an increase of 9.6%.
The average home price increased, during the same time period in 2018, from $736,783 to $804,584 – an increase of 9.2%.
But the second reason why I think this $820,148 number is significant, is because it’s the highest average home price we’ve seen in quite some time.
How long is “quite some time?”
Just ponder it, for a moment.
How about………..23 months?
Really? Does that sound right to you? The $820,148 average home price we saw this past month is the highest in 23 months?
Yes, it is. Since May of 2017, which was the sub-peak of that incredible spring, 2017 market that we all remember.
Now here’s where the bulls and the bears both get to make arguments.
The bulls will say that, as I have described above, this is the highest point in 23 months.
The bears will say that the $820,148 average sale price is an absolute joke, when you consider the “peak” was $920,791 in April of 2017.
And I believe that both have a case.
Let’s look back at the average sale price since the start of 2017:
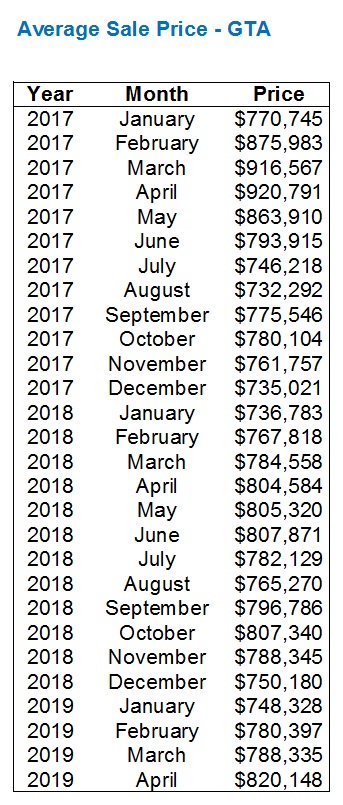
Yes, a far cry from the spring of 2017, indeed.
We all know where the market was back then, although even the most vicious market bear must admit that it sure doesn’t “feel” like we’re off by 10.9%.
In the 905? Sure, and probably more so.
But in the GTA? On average? I don’t feel it. I don’t see it. And while the numbers tell me I’m positively incorrect, my point is that this chart is a classic case of your eyes playing tricks on you, because it’s not telling an accurate story of where the market is today.
Now the other point I would make, or rather number(s) that I want to highlight, is with respect to the $800,000+ number.
Every year starts slow, and low, so the $748,328 average sale price we saw in January came as no surprise.
But the market has worked, and worked, to get over the $800,000 number – a number that seems insignificant, relative to the $920,791 peak, but actually holds more value than you might think.
Let me re-colour the same chart above, as follows:

The line under May-2017 shows us the last time that the average home price was over $800,000.
The yellow highlights show us the months that were over $800,000.
And if you count up the months in between May of 2017, and this past April of 2019, you’ll note that in the span of twenty-two months, only FOUR times was the average home price above $800,000.
And now we return, once again.
The spring of 2018 showed us a very flat market – $804,584, $805,320, and $807,871 in April, May, and June respectively, which is the busiest 3-month stretch of the year, as well as likely three of the busiest four months of the year as well.
What I’m curious to see, with respect to this April, May, and June, is whether:
a) The “flat growth” trend will continue, and we’ll see $823,129 and $825,270 in May and June, or
b) We’ll see a May-spike, something along the lines of $840,000
After looking at the average sale price in Toronto, I wanted to look specifically at the 416.
As noted in this space many times before, and as I would believe is common knowledge, the 416 has not been hit anywhere near as hard as the 905 since prices dropped in early 2017, and with condo prices in the 416 up substantially, as well as many other freehold pockets, some might argue the 416 has been a wash in the past two years.
The numbers don’t back that up, but they do come close.
The average 416 home price in April was $903,992, although this actually does top May of 2017, and only falls short of April, unlike with respect to the overall GTA-wide average.
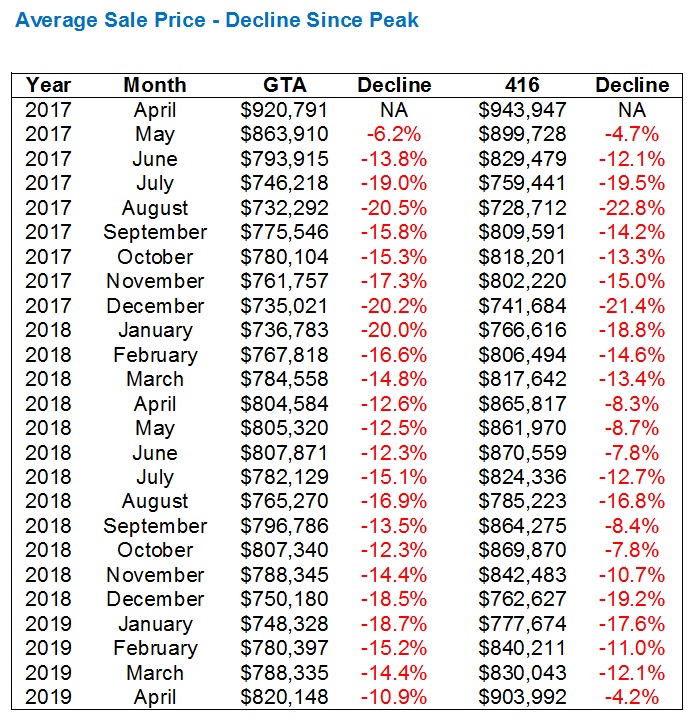
But I wanted to compare the 416 to the GTA, in terms of a “decline since the peak” just to hone in on where things really stand. So I put this together:
Lots of red! Like blood in the water!
And maybe a little redundant, but it paints a pretty picture.
The average home price is down in every month since the “peak,” otherwise it wouldn’t be the peak!
But with a return to the highest average home price in the GTA since May of 2017, we can see that the decline is now “only” 10.9%, and that’s probably made up of some 30% declines and 15% gains. It’s an average, after all.
Specifically in the 416, we see that the decline is less than half as large, as we’re now off only 4.2% since the peak.
More notable is a comparison between April’s.
The GTA-wide decline of 10.9% in April of 2019 is only 1.7% less than the 12.6% in April of 2018.
But the Toronto-wide decline of 4.2% in April of 2019 is 4.1% less than the 8.6% figure in April of 2018.
This tells us that not only has the 416 experienced a much lower decline, but it’s recovering at a far faster pace.
I would show you the 905 stats, if only TREB tracked them in an easy-to-find number, like those above. But just know that if the 416 is down 4.2%, and the GTA, which is partially made up of that 416, is down 10.9%, then the 905 must be somewhere in the 15% neighbourhood.
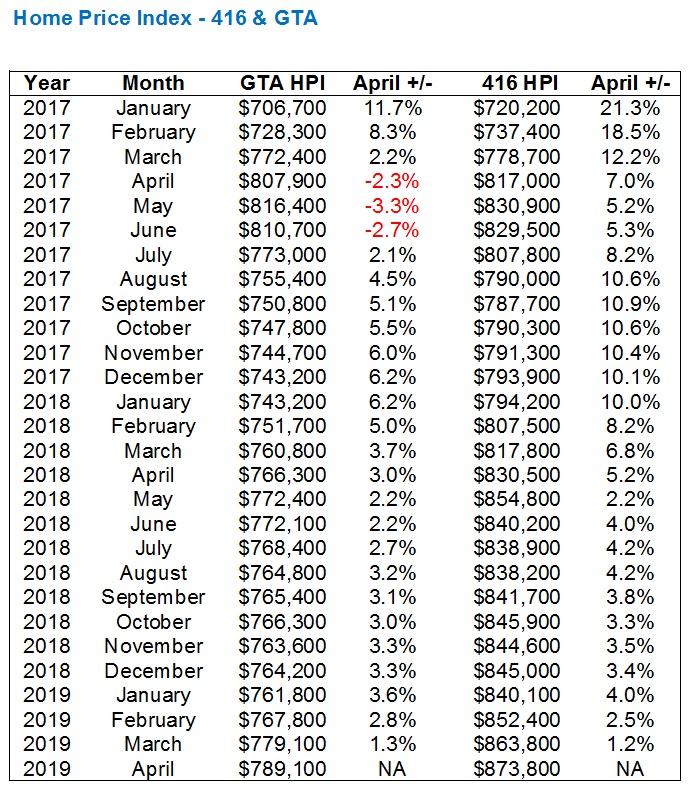
My last examination of price is going to be through the TREB Home Price Index, or “HPI.”
For those of you that don’t know what the HPI is, this video will explain it better than I can:
The TREB HPI is essentially a “smoother” average, with the volatility removed, while still painting an accurate picture of the market.
You could compare it to how a “simple moving average” is a cleaner, smoother line than simply a day-to-day closing price in the stock market.
In this chart, I’m going to look at the increase/decrease in each month, relative to April of 2019:
The first thing you will undoubtedly see here is just how much less blood-red there is!
But also note just how much smoother these figures are.
Working backwards, you’ll note that the two HPI figures move in tandem: 1.3% and 1.2%, 2.8% and 2.5%, and so on. In fact, the GTA-HPI increase is actually higher in the past two months than the 416.
But as you start to move into last fall, you can see how the numbers start to move apart.
Once you get into 2017, you’ll notice that the HPI in the 416 is has essentially increased at twice the rate of the GTA.
If you’re wondering why the April, 2019 416-HPI is higher than the “peak” back in 2017, then you need to watch the video above. As I said, this is a less volatile figure, and some say a better measure of the market than the overall average sale price.
Some may disagree on that last point, and you can go as far as to suggest it’s cherry-picking data.
But you can’t disagree with the fact that the larger the data pool, the less volatility, and thus a month-over-month increase or decrease isn’t as reliable, and doesn’t paint as realistic a picture, as a year-over-year figure. From that logic, it’s not unreasonable to suggest that the HPI paints a fair picture of the overall real estate market and it’s conditions.
Are real estate prices up 7.0% since April of 2017? No. But that’s not what the HPI is saying, so let’s be clear about the two figures, and what they demonstrate.
All in all, I would say that unlike in January and February when my feelings about the market were not backed up by the statistics, I’d say that these figures are exactly what I expected to see for April.
In case it’s not obvious already, I expect prices to continue to push upward into May, and even into June.


Appraiser
at 8:43 am
I have to concur. The GTA market has proven to be remarkably resilient.
I did a little number crunching myself, that supports your thesis about averages and prices.
For the first 4 months of this year, the number of freehold sales from $3-4 million are down 15% and sales from $4-5 million are down 9%, compared to last year.
Interestingly, the number of sales over $5 million is down by only 3%.
Meanwhile, sales volumes for homes between $500K – 1million are up 7%, and those between $1- 2 million are up 5% versus 2018.
It’s easy to see how averages can be skewed.
Professional Shanker
at 12:11 pm
“This tells us that not only has the 416 experienced a much lower decline, but it’s recovering at a far faster pace.”
If you analyze the data of detached houses in the 416 and 905, the average price decline from April 2017 to April 2019 is 15% in each area. This does not support the 416 recovering faster than the 905. What the analysis does support is that condo prices/low end segment in Toronto has appreciated significantly, no debate there.
What has happened has been a push to condos, via B-20, higher interest rates and Airbnb making it very attractive to short term investors/speculators. The new spec instrument is condos whether it be pre-con or existing.
That said just so people do not think I am not all bear, the pent up demand many spoke of last year which I was slightly on the fence about, seems to be showing it’s force in the 905, transactions are climbing and places are selling albeit with negative to no appreciation over the past 12 to 20 months. I think the rest of the spring market will follow suit and volumes of detached sales will improve and hence prices will stabilize into summer.
Professional Shanker
at 12:15 pm
If you analyze the data of detached houses in the 416 and 905, the average price decline from April 2017 to April 2019 is 15% in each area.
14.1% (416 detached) & 16.8% (905 detached) to be exact….a rounding/mix difference possibly.
Jimbo
at 8:16 pm
We can call it the heaviside function and denote it H(t-April) and it’s rate of change can be a Dirac function δ(t-April)
Joel
at 9:29 am
I am seeing the same on the mortgage end of things. The last 45 days I have seen more than double the amount of purchases than average over the time.
Many buyers that have been looking for months or more than a year have been actively bidding and buying properties.
The buyers are there and we are finally seeing the inventory.
Kyle
at 10:10 am
Regardless of what the Active Inventory number is, there has been a dearth of desirable listings up until now. And now that a few of those have transacted it should help break up the log jam.
The other thing i think is happening is that flippers are not as active in the market anymore. Which is good, since it has been them bidding up a lot of the fixer upper properties and then listing, re-listing, under-listing, then over-listing, etc after doing their rubbish renovations, which inflates all the various Inventory numbers with their unsellable garbage listings.
I think right now, buyers could do well, buying properties that need a bit of work, now that there’s less buying competition from flippers.
Professional Shanker
at 5:29 pm
Glad you pointed that out…flippers had a big hand driving up the prices of houses (2015 to 2017) not only from a competition stand point but also from a capital sunk perspective – they jammed in anywhere from $50k to $500k (arbitrary figures) of renovations per house which created an temporary increase in house prices as money spent to upgrade/sustain the structure was accelerated compared to historical averages.
Appraiser
at 5:41 pm
Upgrading, modernizing and improving the housing stock is also a solid long-term investment in the economy, as well as the environment.
Kyle
at 8:52 am
@PS
I agree flippers, developers and home owners have all invested in the housing stock, increasing the base value. Not sure why you would consider these increases to be temporary though? using an extreme example, when someone converts a bungalow to a two-storey home, i think the value created is permanent, i don’t see the value of the two-storey home eventually reverting back to the value of a bunglaow.
Chris
at 9:46 am
I think Shanker was referring to the pace of price increases being temporary, and subsiding as a result of less flipping activity. Not the value created being temporary. At least that’s how I read his comment.
Kyle
at 9:53 am
I still don’t see why it’s temporary. Maybe if flippers were the only ones upgrading houses, and they disappeared from the market….maybe. But even in the absence of flippers, everyone is upgrading their homes. No one buys a fixer upper to live in “as-is”. If anything people (i.e. end users) are renovating more than they’re moving nowadays. People like nice things, i don’t see that going away.
Chris
at 9:59 am
I agree, I think home-owners will continue to renovate and upgrade their properties, as they always have.
But, if flippers go from being very active, to much less so, that is one source of upgrading that will subside. I don’t presume to know the extent of the impact they had, but presumably, it will slow price growth if this type of buyer is investing less in renovations.
I took this as Shanker’s point. But maybe he meant something else. I’ll leave it to him to clarify for certain.
Professional Shanker
at 9:55 am
Kyle – Completely agree on the functional change you mentioned, I was more speaking to the cosmetic changes (floors, countertops, cabinets, etc.) involved which end users would NOT have opted to spend up front but over time. Quantifying that is impossible but I do not doubt the impact it had is pushing up prices.
Kyle
at 10:08 am
Let’s agree that even in the absence of flippers, a run down house is going to be bought to be renovated. No end user is buying a gutter to live in “as-is”.
Here’s where I disagree, IMO an end user is going to opt to invest and renovate to a far higher standard than a flipper, who needs to contain costs in order to protect his margin. So the amount invested in the housing stock as upgrades could very well increase in the absence of flippers.
Professional Shanker
at 11:31 am
If we are talking specifically run down gut jobs – yes they would be renovated either way. But in 2018/2019, in the absence of guaranteed appreciation in the detached markets developers are very conscious of profit margins and activity has reduced, this does have an impact on house prices.
The other aspect of the 2015 to 2017 run up were pure cosmetic flips which took 5 to 10 year old finishes in a home and upgraded them……this is more what my point was. This activity has all but dried up especially in the GTA burbs and it has already had an impact on house prices.