

How about those Toronto Maple Leafs, eh?
Raise your hand if you were alive the last time the Toronto Maple Leafs won the Stanley Cup.
I see……..maybe……six of you with your hands raised?
Appraiser?
East Yorker?
Who else?
The funny thing about being a Leafs fan is that you can say, “This is our year” over and over, and when the Leafs finally do win a Stanley Cup, a lot of those fans are going to say, “I told you so.”
How long can you claim, “The Leafs are going to break the curse and win the Cup,” before you lose credit when they do so?
Five weeks ago, I wrote this in a TRB blog post:
Raise your hand if you think that $1,095,617 average sale price from February is going to surge? I’m predicting it’s up at least 4.0%, month-over-month, which would take it to $1,140,000. Yes, a far cry from the peak in February of 2022, but substantially higher than the fall of 2022.
That proved to be incorrect, of course.
The average home price in Toronto only increased by 1.2% from February to March; not 4.0% as I predicted.
It made no sense to me, as I wrote in a subsequent blog post as well as my eNewsletter.
The market changed substantially somewhere around mid-February.
Those of us who live and breathe the market can tell you what it’s like to just “feel” the market move.
The number of offers on “offer nights” started increasing.
More of the sale prices the day after raised eyebrows.
The small percentage of freeholds being listed with “offers anytime” disappeared, and we started to far more offer nights on condos.
By March, the market was somewhere between “hot” and “red-hot,” as it wasn’t exactly peak insanity, and yet hot would be an understatement.
At the end of the month, I figured we had just experienced a 4% jump in prices, but I was wrong.
Only 1.2%.
(womp womp)
So now le me ask the (not so) obvious question: if the market goes up 4.0% the next month, may I claim credit?
In the same way that people were celebrating, “The Leafs won the first round of the playoffs, I told you they would,” having said that for years and years, may I claim credit for the statistical movement in the market?
Last month, the average home price clocked in at $1,153,269. Perhaps that’s a good place to start.
A refresher, as always:
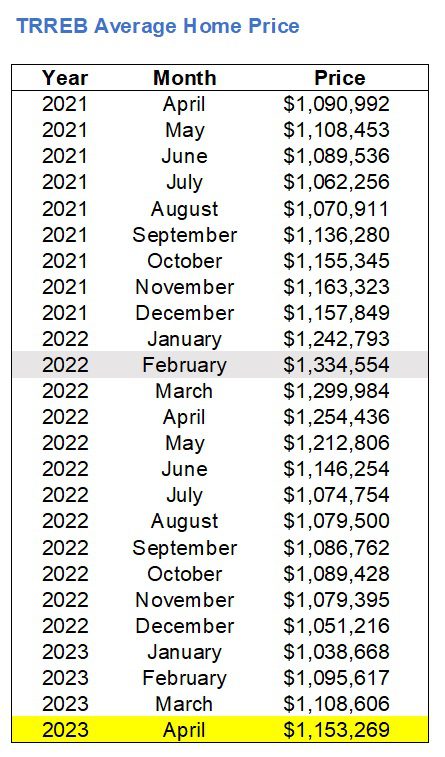
The shaded area, in case it’s not obvious, is the peak in February of last year.
So now let me ask the (should be) obvious question: have we hit bottom?
When I asked this question in a March blog post, the answers were not all in the affirmative.
Bankersorta said November, 2024.
Anwar said May, 2025.
Derek said December, 2023.
JL said December, 2023.
Last, but not least, Sigruper said February of 2027.
But when I look at the average home price of $1,153,269 up against a January trough of 1,038,668, I want to double-down on the idea that we have hit bottom, and that the average home price will never drop below $1,038,668 again.
Sheesh. 2027. Sigruper, come on!
Now, to be fair, we should come to expect that the average home price in April would increase from March, since history would tell us as much.
Have a look:
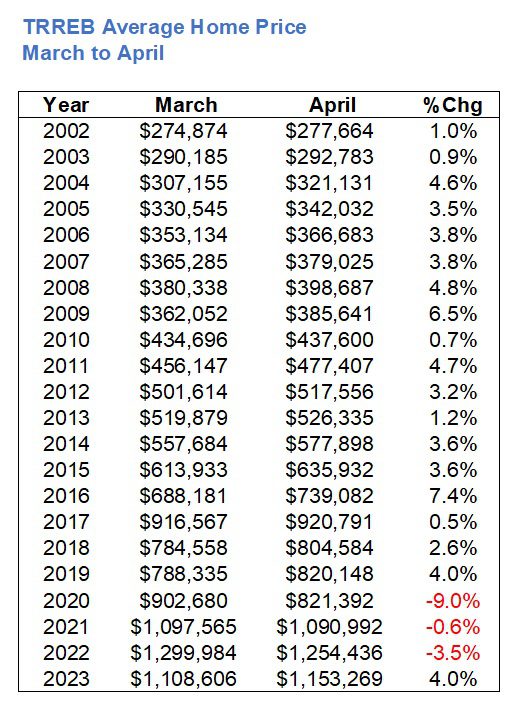
Only three times since 2002 has the average home price decreased from March to April, and one of those years was the pandemic-stricken spring of 2020 where the average home price, on paper, dropped a stupid 9.0%!
If history is any indication, we should expect to see an increase in April.
Although if recent history is any indication, specifically the past three years, then perhaps this could be defined as a surprise.
Either way, I think the 4.0% increase is in line with what buyers, agents, and even sellers are “feeling” out there in the market, and I think this is a truer representation of value than the depressed numbers we saw to star the year.
Much of the reason for the increase, of course, is because of supply and demand. Notably that supply is low and demand is high!
If we want to be pessimists, we can point to the 7,531 sales recorded in April and note that this is the third-fewest since 2002:
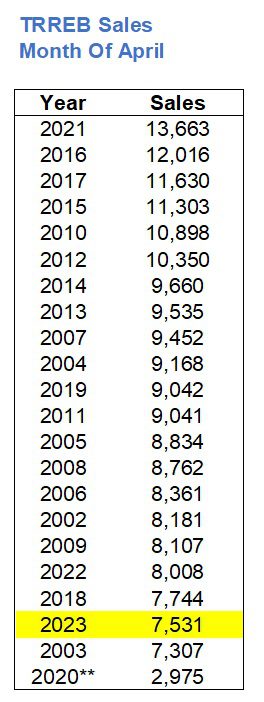
Of course, 2020 doesn’t count, so this could be viewed as the second-fewest.
It’s worth noting that there were only 8,008 in 2022.
But as we saw last month, and probably the month before, the number of new listings is even more dire:

Take out the pandemic-stricken month of April, 2020, and we just witnessed the fewest listings in April in the history of TRREB stats!
Year-over-year, new listings were down 38.3% and sales were down 5.2%.
Think about that for a moment:
There’s 38.3% less being offered for sale but only 5.2% less is selling.
Surely this has to be the single-most telling statistic from the month of April, no?
Surely this has to sum up our market more than any other statement, right?
Then again, if we look at the interaction between supply and demand, specifically between sales and listings, it gives us another data point worth exploring.
Here’s a look at the SNLR in April from 2002 onwards:
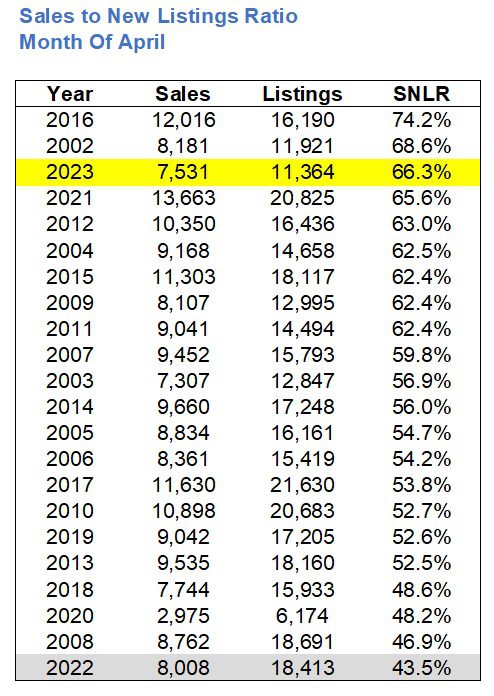
Despite the lowest number of sales in the month of April, ever, save for the pandemic-affected year of 2020, the SNLR or “absorption rate” is the third highest ever.
That’s a crazy stat.
And it’s even crazier when you look to the bottom of the chart and see that the lowest SNLR ever was last year.
What a difference a year can make!
So, we know that the lack of supply and the absurd demand is causing prices to increase, but where are the prices increasing? And how much?
The average home price in the GTA increased by 4.0% from March to April. But if we break things down and look at the “big five” TRREB districts, we can see which districts are lagging the 4.0% increase and which are outperforming:
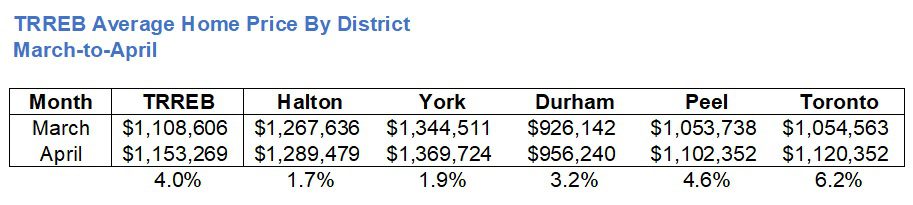
Peel and Toronto seem to be carrying the rest.
Actually, Toronto seems to be doing the heavy lifting here, and that 6.2%, month-over-month increase explains why the overall TRREB figure is up 4.0%, on account of how heavily weighted the 416 is.
Here’s the number of sales in each district:
Halton: 817
York: 1,370
Durham: 903
Peel: 1,384
Toronto: 2,735
Toronto represents one-out-of-five districts, or 20%, but the sales accounted for 38% last month.
Sometimes, the TRREB average goes as the 416-Toronto average goes.
Having said that, if we break down the sales-to-new-listings ratio, which was 66.3% in April, into districts, we see the opposite of what we might expect:
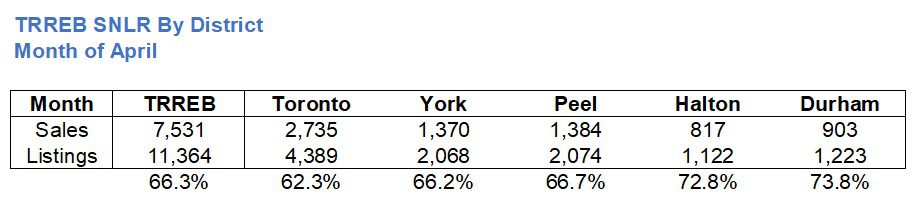
I don’t know about you, but I find this fascinating.
Toronto-416 led the big-five with a 6.2%, month-over-month increase in price, however, the SNLR in Toronto was the lowest of the five districts.
The TRREB average was 66.3% and yet Toronto-416 was merely 62.3%.
Can you imagine what would happen to prices in Toronto if the SNLR was on par with that of Halton or Duhram?
Staying on the subject of SNLR, I think putting the April figures in true context requires seeing what they were last month as well, so let’s do that.
Here’s the percentage change increase in SNLR from March to April:
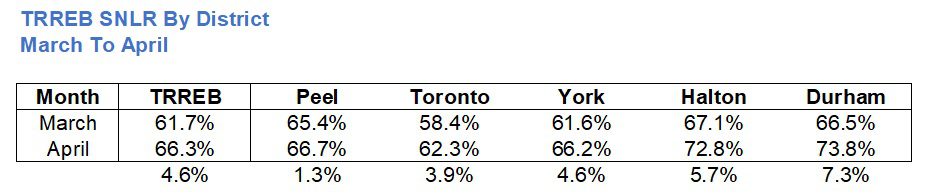
Overall, the absorption rate in TRREB increased by 4.6%, as we know.
Durham led with a whopping 7.3% increase and Peel lagged with a modest 1.3% increase.
Seeing Halton and Durham over the 70% threshold tells me that those markets are making a comeback, and again, I want to mention again that seeing Toronto-416 coming off a sub-60% SNLR and only sitting at 62.3% tells us just how much prices could increase if this market got any tighter.
For those who still think there’s another “bottom” coming, let me show you a chart.
We saw a drop in 2017.
We saw a drop in 2022.
But here’s the TRREB average home price, monthly, from January of 2016 through April of 2023:
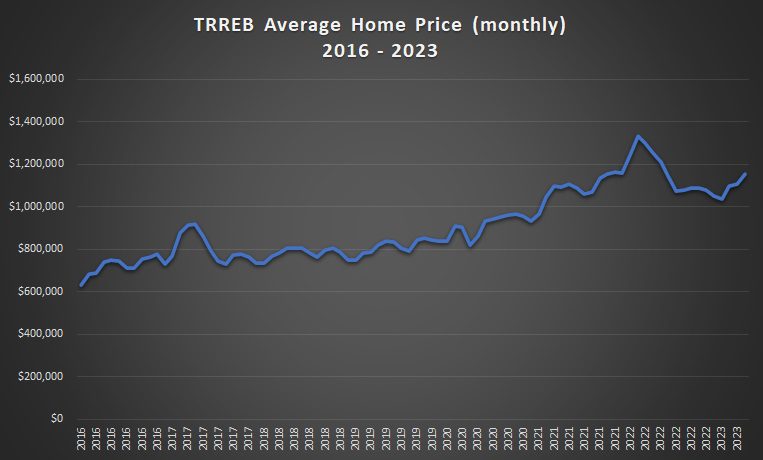
I’m sure the 2017 drop looked steep in 2018, just as the 2022 drop looks steep today.
But the further back you go, the sillier the idea of a long-term decline becomes.
Here’s the monthly data from 2002 to current:
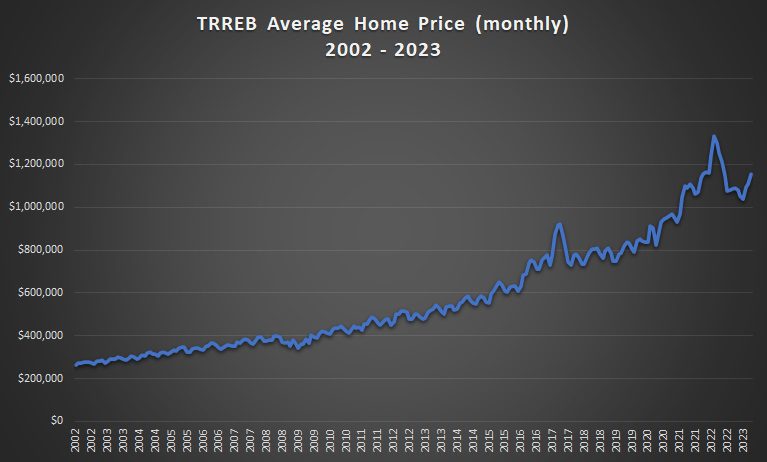
Note that 2008 doesn’t even register.
And within a few years, 2017 and 2022 will be blips as well.
But this is still the proverbial “45-degree angle, left-to-right” that we’d expect in an ever-increasing market.
Alright, I think I’m entering cheerleader territory, so I’m going to stop there.
Any thoughts or opinions to the contrary, I would love to hear from you.


JF007
at 6:45 am
What more I want..hmmm..Another stat post Wednesday further breaking down the numbers by housing type David..maybe 😊
Appraiser
at 7:03 am
May 2, 1967. I was a few weeks shy of my tenth birthday when I watched George Armstrong score a goal into an empty net late in the third period to clinch the Stanley Cup for the Toronto Maple Leafs. On a black and white TV of course.
London Agent
at 7:32 am
In 3-4 years when prices start skyrocketing again, me to client:
“Sometime in the near future, the government or some other regulatory body is going to do something to squash housing prices in the short term. The next 6-12 months will be your best opportunity to buy”
Rinse and repeat for the next 30 years
Nick
at 7:55 am
It’s amazing that people don’t notice this trend. We have become a bit of BBC a boom and bust especially some of the suburbs.
Kyle
at 9:28 am
@London Agent, you are bang on. In structurally under-supplied markets, this is pretty much a rule you can bank on. Sellers are never in a rush, but buyers always are. Short of a deep, deep recession, every single time something happens (i.e. GFC, mortgage rule tightening, FBT, Covid, rising interest rates, etc) to send buyers and sellers to the sidelines, buyers retreat first creating a short window of opportunity. But buyers also come back way ahead of sellers. So when those buyers return, it is always to a supply constrained market, creating FOMO and more reason for sellers to remain patient.
Appraiser
at 9:15 am
The trend is your friend. Don’t bet against real estate in Canada. You heard it here first.
Sirgruper
at 9:39 am
I remember not the game in 1967 so much but the parade. Like Appraiser on our black and white Zenith. But it wasn’t that big a deal for the Leafs to win back then with only 6 teams.
As for my depressing Price is Right prediction, I took the low road hoping to be wrong, but remember we haven’t had a good recession (sans Covid) and if it hits, I may just we’ll win the game (and be down in reality).
Finally, a friend sold April, 2017 and the same house resold a month ago with improvements and still didn’t sell for the 2017 price. It was in the $4M range and high end suburbs have not fully come back.
JL
at 11:02 am
I don’t think anyone doubts the perpetual climb up at some rate; its the potential reversion to that mean over some future time period that may occur though. Notice the nice predictable trend line for nearly two decades, and then things go off the rails beginning 2017 and start increasing at double the rate if not more, and in a much more volatile manner. Is this the new trend line to infinity and beyond, or is that whole 2017-present period a blip that (while never getting cancelled out) does gradually over time swing back (or grow more slowly and consistently) to allow underlying economic fundamentals like income to catch up (a bit)? Showing earlier historic periods on this chart might show whether rapid rises in prior periods stuck around or re-adjusted somewhat in future periods.
Appraiser
at 4:15 am
If you are you referring to a reversion to the line of best fit you may have a point. I don’t believe that prices will be galloping ahead in the manner of 7% per month (ala January – February 2022.)
Without a substantial increase in housing supply and a rental vacancy rate somewhere above zero, all roads lead to higher prices.
QuietBard
at 12:22 pm
This might sound silly, but I think we haven’t hit an equilibrium that will be the trend for the next 5ish years or so. I wonder if the fall stats for this year will offer a glimpse into the future. While David mentions there is a ton of demand (which I agree with). I would argue this demand is different that of the last few years. I.e the people buying these homes are very financially “secure”. And the people who arent “secure” are standing on the side lines. Thats why we are seeing the historically low sales accompanied with low number of listings and still prices are slightly rising. Time will tell all I suppose
Vancouver Keith
at 2:02 pm
Now that interest rates have paused, and inflation is on a downward trend, the real estate market will lead the recovery, barring a black swan style reversal of those trends. Stable and then falling interest rates, coupled with a red hot employment market spells increasing real estate prices.
The government has again over bail out the economy in a crisis, pouring vast amounts of money into the economy and revising the mortgage rules to prevent any kind of foreclosure crisis/opportunity.
Here’s the problems of these policies. They are costly in terms of running up debt. They favor real estate owners over renters excessively. They forestall the necessary capitalist processes of creative destruction, where enough people suffer the consequences of excess borrowing to remove overleverage as a strategy to get ahead in life. It also creates a Toronto with way fewer than 70,000 real estate agents, clearing out the weak hands in the industry and leaving more business behind for the most professional and most successful.
If the financial universe unfolds in the way that investor are clearly predicting, we could be in another overheated real estate market in Toronto in a year from now, with all the immigration coming. Clearly no government wants to be in power during a proper extended real estate crash, and they will go to extraordinary lengths to prevent it.
JL
at 8:30 pm
Yup. Although there’s a glimmer of hope that if the markets stay as hot as you predict, inflation wont in fact be dropping, and neither should interest rates. We can’t have it both ways, one or the other, somethings gotta give somewhere…
And yes, I also am beginning to feel that the prediction game we play here each week is futile if the government and institutions continue to change the rules of the game to enforce a single outcome. Capitalist economic theory does not envision a system with no risk, failure, or loss, but that seems to be what governments around the world are targeting, and using increasingly excessive and drastic monetary manipulation to do it.