

Quite the interesting week on Toronto Realty Blog! Well, for me, at least…
The main character of Monday’s blog found my post, took issue with it, and then told me, “You have one hour to take that down, or I’ll file a RECO complaint.”
Imagine that, eh?
I go out of my way, and put my neck on the line (more on that in a moment…) to tell the stories that nobody else wants to tell, to help educate the general public, and I’m going to have to explain myself to the Real Estate Council of Ontario. That story had no property address, no names of buyers/sellers/agents, and the prices and locations were slightly altered.
As the agent told me on the phone, “You’re going to be the RECO test case.”
Perfect.
See you there…
I’m not sure if you read them, but I had about twenty really nasty messages posted in the comments section with words so bad that I don’t care to repeat them for fear that your work computers would censor this site. Monday’s blog was picked up by a lot of other sites, some of whom described me as “bragging about manipulating buyers,” as well as some other choice descriptions. I make it a point to never delete comments but ones that call names, use disgusting words, and threaten bodily harm are not welcome here.
Friday’s blog resulted in a phone call from a reporter I know who told me, off the record, “The people writing the headlines are relying on interns and assistants to feed them stats, and these people aren’t qualified to make sense of those stats.”
I suppose that’s why we saw this:

As I pointed out in Friday’s blog, Toronto home prices did NOT experience their sharpest drop since the start of the pandemic.
My reporter friend said, “They won’t print a retraction because nobody cares. And people would probably feel better if this was true anyways, so few will take issue.”
But I’m taking issue.
As are a lot of my colleagues, and both buyer-clients and seller-clients who read Friday’s blog, saw my analysis, and then asked, “How can this be?”
For those that missed Friday’s blog, this is simple:
The average Toronto home price dropped 0.6% from March to April.
But the average Toronto home price also dropped 1.3% from October to November, and 2.5% from November to December.
So this Financial Post headline is 100% untrue, and there’s no way to defend the inaccuracy.
With last week’s news out of the way, let’s talk about the month of April.
As noted above, the average TRREB home price was down 0.6%, from $1,097,565 to $1,090,992.
Here’s what I wrote in this space last month:
So here’s what I think is going to happen: we’re going to see the April average home price come in around the same as March, and then we’ll see a modest pullback in May and June. When the average home price declines from $1,097,565, or whatever it comes in at in April, to, say, $1,040,000, the market bears will say, “See, the market is dropping!” while ignoring the massive gains made since the fall of last year.
I don’t make a habit out of launching predictions into the air and then circling back to humble-brag about them, but what I’m feeling out there in the market seems to be in line with the statistics. I wasn’t cheerleading this market last month, predicting another 4-5% month-over-month gain, but rather i said, “we’re going to see the April average home price come in around the same as March.”
And that’s what happened.
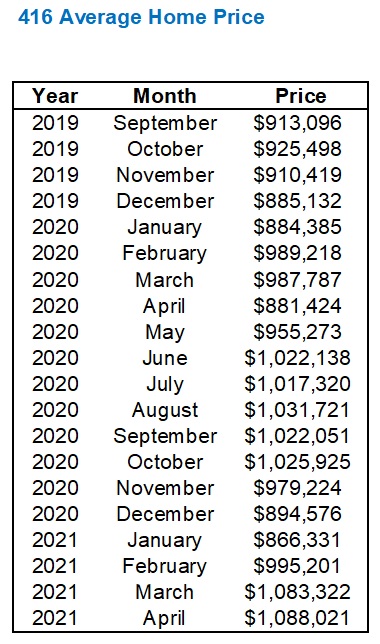
Here’s a refresher on TRREB average home price:

In the 416, average home price actually increased, ever-so-modestly, from $1,083,332 to $1,088,021.
That’s a 0.4% increase.
So the TRREB figure is down 0.6% and the 416 figure is up 0.4%.
Feels pretty much like a flat month to me!
Here’s a refresher on the 416 average home price:
Another issue I ranted about during Friday’s blog was the fact that the media were using the 12.7% month-over-month decline in sales to suggest that “the market is cooling.”
As noted on Friday, March’s 15,652 sales were the most in a single month in the history of Toronto.
And the 13,663 sales recorded in April?
Second-most.
Here’s how the top-ten all-time months stack up:

I would say the month of April is in good company, wouldn’t you?
Is it fair to say “the market is slowing” based on a 12.7% drop in sales activity from March to April?
Maybe. Just maybe.
The fact that April saw the second-highest number of sales in any single month in Toronto history is a sign that the market is still as active as ever, but did the market slow even a touch?
Well, first let’s compare April to April:
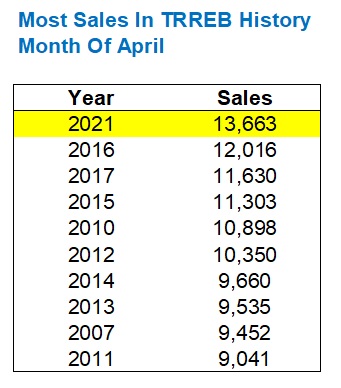
April 2021 beat the old record, set in 2016, by 13.7%
In March, that all-time high of 15,652 beat out the previous high in the month of March, back in 2017, by 29.6%.
So is there a take-away here? That we might have seen things “cool” as a result of these figures?
I don’t think this is how we measure the relative temperature of the market.
I’d much prefer to know, if sales are declining, what’s happening with inventory. The relationship between supply and demand will ultimatley tell us what’s happening in the market, so let’s look at “Sales To New Listings,” aka SNLR:

Sales were down 12.7% from March to April.
New listings were down 8.3% from March to April.
If sales are declining, it doesn’t necessarily mean the market is “cooling.” To come to that conclusion, we need to ensure that inventory didn’t decline at a higher rate!
The SNLR dropped from 69% to 66% from March to April which, if one were inclined to do so, could be used as a metric to suggest “the market has cooled.”
But before somebody makes that claim, I would further ask this: how does the SNLR typically move from March to April?
Because if it declines 3% every year, then the market isn’t cooling, is it?
Take a look at this:
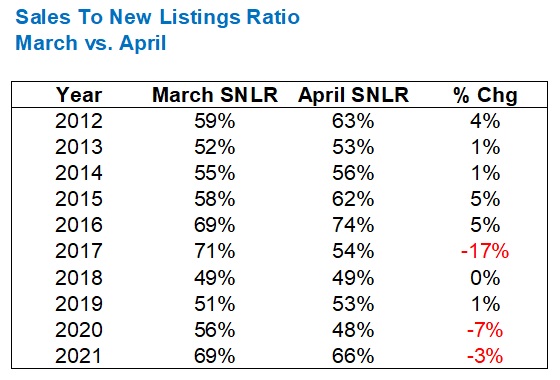
Over the last ten years, we’ve grown accustomed to seeing the the market “tighten” in April, with the SNLR increasing in six years, decreasing in three years, and remaining flat in one.
2020 was the pandemic, so you can throw that figure out.
2017 was the government-induced fall from a tall building, so you can almost throw that out too.
What’s left is that 2021 is the only year in the past ten where SNLR has declined from March to April, which tells me that, perhaps, the market is taking a moment to catch its breath.
The issue I had with the headlines in last week’s newspaper is that obviously nobody crunched the numbers as we’ve done here, but rather they sought out a statistic to go along with their narrative – that the market was cooling. They used the month-over-month statistic for sales, when they usually use year-over-year, and then found a bunch of real estate agents to give quotes that fit the story they had already written.
The newspaper editors don’t even know what SNLR is. They just know which headlines will get the most clicks.
For what it’s worth, the 66% SNLR in April is the second-highest in the last decade.
So is the market cooling?
Honestly, we could throw out “yes” and “no” all day long.
Internally, I heard a lot of chatter about how the condo market was affecting sales and prices, so I set out to see if there were any conclusions to be drawn.
Here’s how 416 condo sales looked compared to the previous decade:
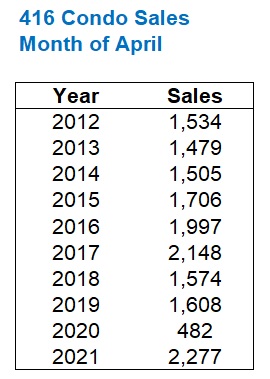
Another all-time high.
Go figure!
Again, we see the pandemic-induced 2020 figure, so pay no mind there.
And in 2017, that figure would have been far higher if the government didn’t step on the market’s throat in mid-April, so I’m tempted to call this the second-hottest April for condos.
In the 905, the trend continued:

Slightly behind 2019, which is interesting. But I’ll admit that the 905 isn’t my forte.
But I heard all this chatter about the 905 “carrying” condo sales, and I wanted to know if that was true.
Here’s the percentage of total condo sales for each of the 416 and the 905 in the past decade:
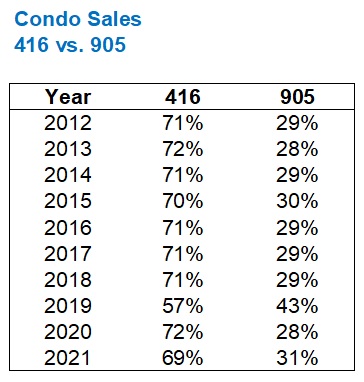
So while we’re seeing a slightly higher proportion of sales this year than in 2020, overall, the trend is actually down!
This is why you need to look at numbers.
The rumour mill had this completely backwards!
One more stat I wanted to look at was condo sales as a percentage of overall sales.
Here’s how that looks:
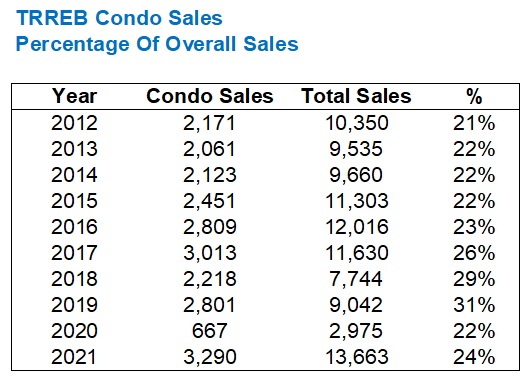
Again, we see that condo sales are actually down relative to previous years, if we kick out the pandemic-affected year of 2020.
Condos represented less than one-quarter of all sales in April, whereas we averaged 30% in 2018 and 2019.
As for how 416 and 905 did respectively:

This is a wash.
Not much to take-away here, as the 17% figure is neither up nor down when compared to the decade average.
Then in the 905:
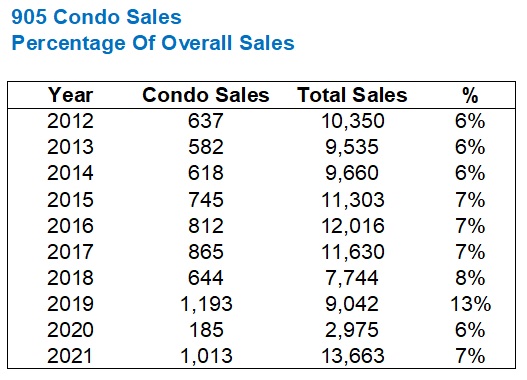
You can read as well as I can, and 2019 was the obvious outlier.
Kick out 2019, and we’re pretty well aligned throughout the decade, averaging about 7%.
Conclusion?
Anybody who thinks that condo sales are pushing overall sales is dead wrong.
Condo sales, whether 416, 905, or overall, are pretty much where they’ve always been.
Last, but not least, when it comes to condo prices, raise your hand if you thought that April would represent an all-time high for the City of Toronto?
The average condo price in the 416 increased 2.7%, month-over-month, from $707,835 in March to $727,137 in April.
That $727,137 number beats out the pre-pandemic record of $722,675 set in February of last year:

It took a full year, but condo prices have officially recovered from the effects of the pandemic.
While freehold prices bounced back within 2-3 months, and have since made substantial price gains, condo prices languished for a year.
Look at the following chart and pay attention to the red and yellow boxed time periods:

The red box is the time period affected by the pandemic.
Halfway through March, the stay-at-home order began, and the real estate market came to a screeching halt. It wasn’t until June that we were back up and running again.
But as I have written before, the fall condo market was abysmal.
The yellow box shows condo prices from post-Labour Day through the start of 2021.
The drop in average condo price seemed to come out of nowhere! Last fall, I had listings I practically couldn’t give away. And as soon as the page turned to 2021, the condo market bounced back.
From $624,886 in January to $727,137 in April.
It’s a 16.4% gain inside of three months, on paper, at least.
In practice, I’ve seen the same model unit sell for 20% more two months later, but I’ve also seen some units faring worse. Not everything is up in price, out there.
Overall, I think the condo market surprised a lot of us!
And I, for one, will be surprised if the condo market remains this hot through the summer. Things always calm down in July and August, but I think the condo market will fade a month early, as we see less action in June. It’s just a matter of whether or not we see this in May as well.
That’s it for Monday, enjoy the week!


Marty
at 7:53 am
Well, first and foremost THANK YOU for that Monday post that may or may not get you in some trouble.
Most of you will not know the business that I’m in (David does), but I’ll say that most of my work week is spent talking to and occasionally meeting firstly mostly Realtors, then also homeowners in the process of selling, or about to sell their homes, and lastly homeowners with no intention of selling. In that order of frequency – I’ll talk to Realtors most each week. And I’ll say that I have no contact with condo sellers or buyers, my business is only in conjunction with houses and very occasionally freehold type townhouses.
And I will say that all last week, EVERYONE I spoke to had something to say about those headlines that David have pointed out, and it was very clear some had read further into the articles, and some hadn’t. Probably what you would expect. But people WERE talking, much more so than I’d normally notice. Those headlines drove talk on the streets I frequent.
Ed
at 8:23 am
The main character of Monday’s blog found my post, took issue with it, and then told me, “You have one hour to take that down, or I’ll file a RECO complaint.”
??????????????
How would he or she know that the story was about them unless they had an idea of what the other bids were? Just because you had the winning bid does not any info on what the other offers were for.
Libertarian
at 10:17 am
Is it that agent or the would-be buyer near the top of the blog (the article link) that David sort of ridiculed?
Because I agree with you – how would anybody know who that agent is? People have too much time on their hands to dig up all that information to figure out who it is.
Verbal Kint
at 2:16 pm
The main character of David’s blog posts is always… David. He referred to himself (“I …”) 64 times in last Monday’s post. It’s not unthinkable that he reported HIMSELF to RECO, just for the drama.
Marty
at 2:31 pm
That’s not a bad theory.
DDofG
at 10:28 pm
Right. It’s a freaking ridiculous theory, from a commenter who always lamely tries to be “controversial” but just comes off as a laughing stock.
RPG
at 9:48 am
Ralph Cramdown: back from his hiatus!
Libertarian
at 3:54 pm
Raplh wasn’t as bad as this guy.
Ralph just offered a different perspective. I miss his commentary.
Jenn
at 8:33 am
Hmmm Verbal was gone for about six months by my count. Maybe he’s a snowbird? Or maybe he was doing a quick six months in prison. Neither would surprise me.
daniel b
at 11:25 am
reminds me a bit of this story
https://www.npr.org/2019/03/10/702063209/man-inadvertently-proves-that-hipsters-look-alike-by-mistaking-photo-as-himself
arthur
at 2:22 pm
you can pay your client property taxes fool give instead tajind people to the new car lot and lose 20 pts the minute they move in as if frugality and integrity matters to a schill