
I don’t know much about sunflowers, but I’m guessing that August is “prime sunflower season.”
I won’t lie, folks; I often have no idea what feature photo I’m going to use for a given blog post.
Every so often, I’ll just search a word and see what comes up. And when I searched “August,” hot-diggity-damn was I inundated with a lot of photos of sunflowers!
I’ve never really understood the attraction, if I’m being honest.
They look cool in a photo, sure.
But in reality, these things are big! They don’t really go on your kitchen counter, nor do they look right on the breakfast table.
Not only that, the stems are like three-feet long. What do you do with all that?
And when you’re cutting those stems, it’s not like giving a fresh ‘clip’ to roses. You need a meat cleaver to get through the sunflower stems. These things are as thick as a can of tuna!
In a completely unrelated story, my wife’s favourite flowers are sunflowers.
Pingle’s Farm is a good place to pick them, in case you’re wondering…
I had planned to talk about Mark Carney’s affordable housing plan today, or this thing called a “seller property information statement,” but I’m not sure.
Maybe I was going to post a guest blog from Chris, Tara, Lucie, or Tony.
Or maybe today was going to be my blog about the history of pre-construction condos?
Well, in any event, all that is moot because of a blog reader you know as Derek, who said:
“It looks like you never do an August TRREB stats post.”
Great.
I was just minding my own business, relaxing on a beach, on a park bench, or in a ball-pit at McDonald’s, and then I read his comment.
“TO THE BLOG ARCHIVES!” I shouted to nobody in particular.
It would seem that Derek is right.
I never do an August TRREB stats post and I wonder why that is.
Maybe it’s because August stats are meaningless? No, that’s not entirely fair, especially as I think they’re the gateway to the fall market over the last couple of years.
Maybe it’s because we routinely do two-part or three-part blog posts to start September, and by the time we’re through, it’s mid-month and August stats have no meaning?
Perhaps.
But with Labour Day falling on the first of the month this year (aren’t our children happy?) it means we can accomplish everything we wanted to in the first two weeks of September.
Last week, we looked at our “Burning Questions” for the fall market and covered the following:
-Interest rates
-Sales
-Inventory
-Home prices
-Resale condos
-New homes and the government
At the risk of trying to fit a round peg into a square hole, I do think that many of the questions I asked last week, and many of the answers I provided, could be expanded upon by looking at the August TRREB stats. Specifically, when it comes to inventory, home prices, and the resale condo market.
So today, let’s look at the same charts and metrics that we always do, and at the end, we’ll return to our “Burning Questions” and add a bit more fuel to the fire. Pardon the pun…
First up, average home price, which declined 2.8% month-over-month:

I think we’re just about at the point where we need to get rid of the 2023 data. I can’t imagine how this looks for those of you scrolling on your phone.
That $1,022,143 price is notable for several reasons, but let’s start with one that nobody seems to be talking about:
This is the lowest average home price, in any month, post-peak.
If you’ll recall, our market peak was in February of 2022 and was $1,334,554. I just typed that from memory as I’ve written this so many times over the past three years…
When we recorded a price of $1,038,668 in January of 2023, I remember saying “This is the trough,” only to see the following January, in 2024, deliver an average home price of $1,026,703.
But that was the new trough! January of 2025 saw an average home price of $1,040,994 which was higher than both January of 2023 and January of 2024, so the conversation about a trough was behind us.
Until now, that is.
The average home price in August is always seasonally-depressed, so I could offer that the idea of a “new trough” is misguided. Talk to me in January, I would suggest.
But many will disagree, and I understand why. I’m just shocked that I haven’t seen this written anywhere yet. It’s like nobody noticed.
For what it’s worth, that 2.8% decline is on par with the same period in 2023 and 2024:
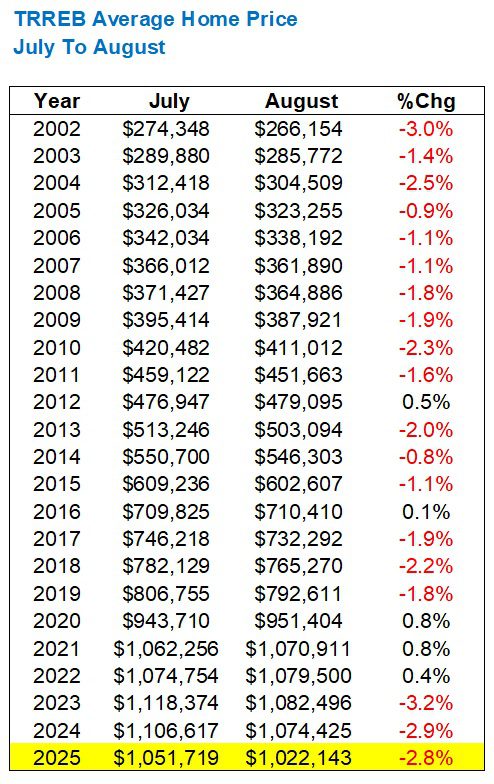
In fact, we’re trailing the pace from 2023 and 2024!
But overall, from 2002 to 2024, the average movement from July to August shows a decline of 1.3%.
So do you put a positive spin on the average home price or a negative spin?
Pick your poison.
The one thing that I will say in the face of those who are bearish is: the average home price is down year-over-year, but it’s consistent:
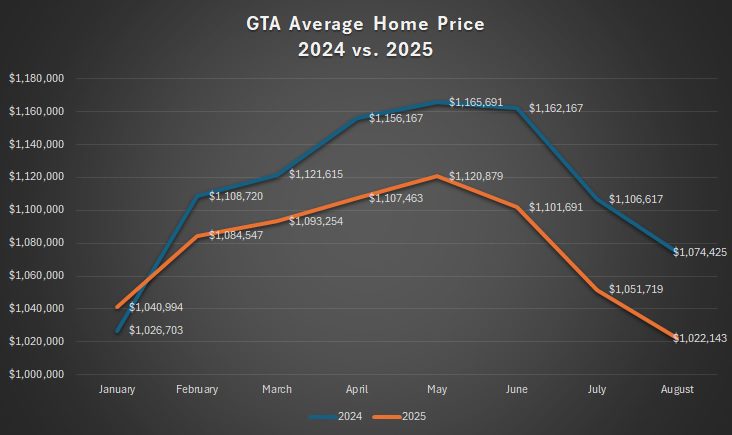
As we noted last month in this space, January seemed to be an outlier in the above chart.
Or, perhaps we can plot the moment Donald Trump took office and started a trade war with Canada on the chart above, and have it directly correspond with the reversal of January’s trend?
The gap between 2024 and 2025 is shrinking, albeit modestly:
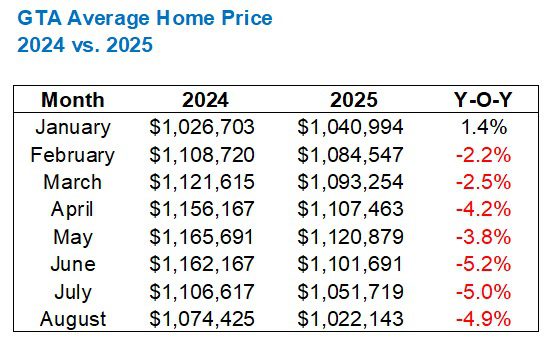
I think it’s fair to say that we’re “about five percent” off the pace from 2024.
Where that goes from here is anybody’s guess, and I think the next thirty days will tell us a lot about the trajectory of the market through the end of 2025.
Last month, we were fed this idea that sales were robust by the Toronto Regional Real Estate Board, as they noted a year-over-year increase of 10.9%, but as I wrote here on TRB, they failed to mention that the 10.9% increase was over the lowest number of sales in any month of July, ever.
Sales declined by 14.6% on a month-over-month basis, and the 5,211 sales recorded in August were the second-fewest in any month of August:
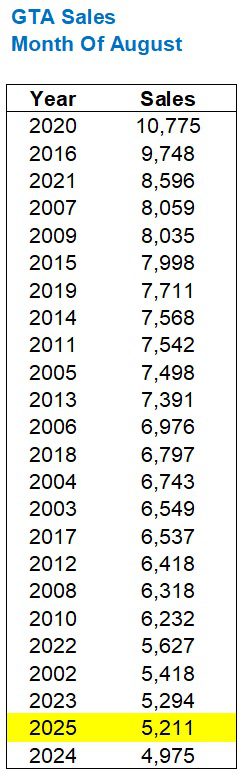
Look at the bottom three on the list!
2023, 2025, and 2024.
Make it the bottom five and suddenly we have each of the last four years in that grouping.
That 14.6% month-over-month decline in sales is the largest from July-to-August since 2015:
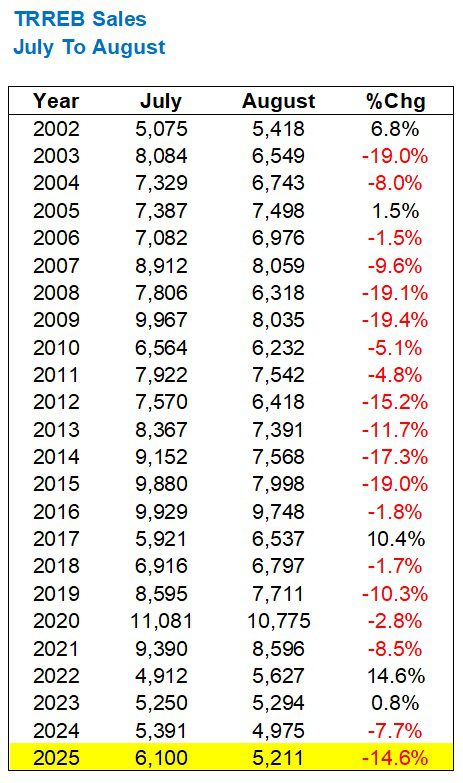
If July was robust, then August was relatively sluggish.
Personally, I’ve always felt that you can’t really glean much from the month of August as it’s the slowest time of year, save for Christmas and into New Years, but blog reader Derek put me up to this, so I’m just reporting what I see…
While total sales were the second-lowest in any August, all time, new listings were the second-highest:
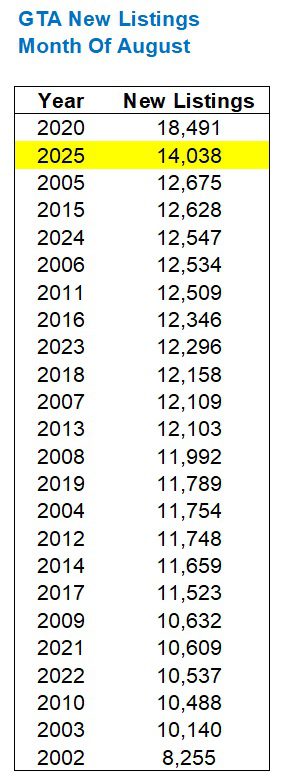
If I were a prospective home seller and my home was seemingly ready for market in August, I would likely wait until September to list.
There are exceptions to the rule, of course.
I listed a home for sale in Mississauga in August because a very similar home had just sold, and we wanted to immediately piggyback that sale.
But for everybody else out there, it seems to reason that waiting for the fall market which is right around the corner might be a better play.
For this reason, I’m surprised by the number of new listings last month.
That brings us to the sales-to-new-listings ratio, which has been waning all year.
Last month was no different.
With 5,211 sales in August and 14,038 new listings, we saw an absorption rate of 37.1%.
This is the lowest in August since 2002:
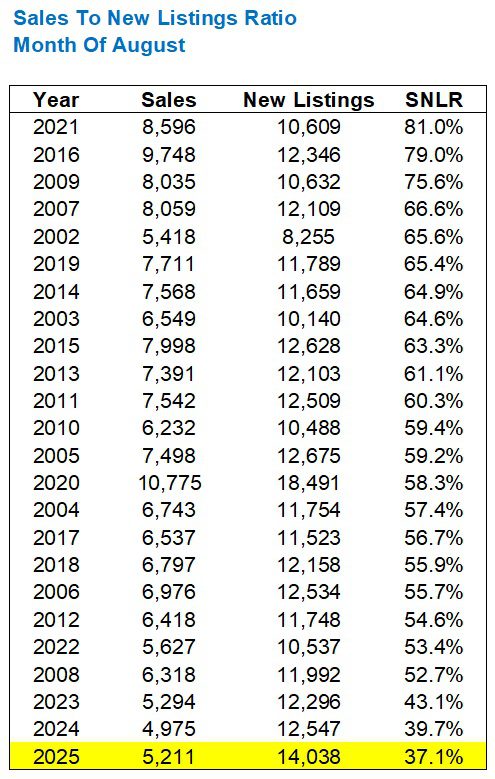
The irony is, despite the absorption rate in August ranking last place for every August since 2002, this is actually the highest absorption rate thus far in any month in 2025.
Have a look:
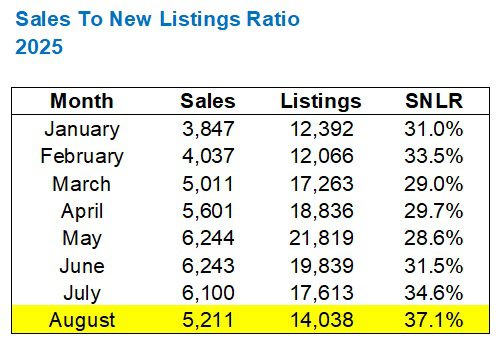
Alright, so this could mean that after tough spring, the market is “tightening” as inventory is absorbed faster, and the absorption rate continues to increase.
But it could also just mean that since the absorption rate increases every year at this time, the market is just following suit.
Have a look:
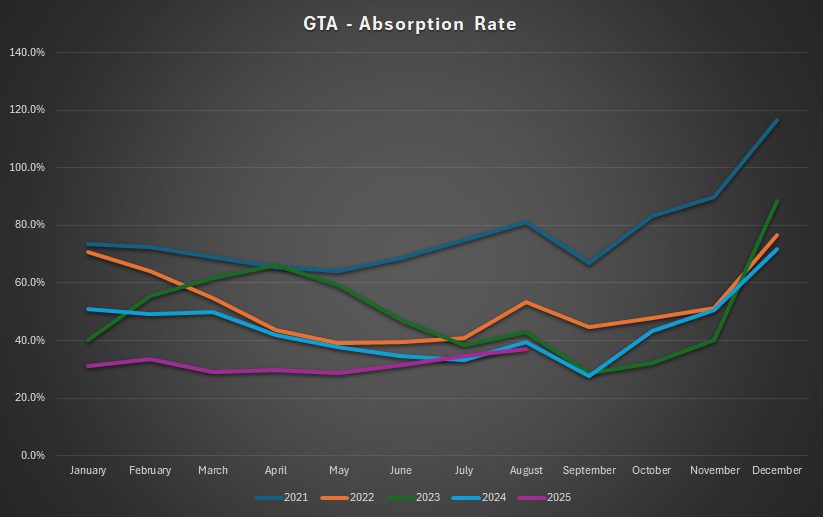
Yes, the absorption rate has increased from July to August every year for the last five years.
Here’s where the saying, “You can make number say anything you want” comes into play.
But it is worth noting that the absorption rate in 2024 (light blue line in the above chart) was declining from March through July in 2024, whereas in 2025, it was increasing.
It’s also worth noting that the lowest absorption rate in any month in the past five years was in September of last year.
September of 2023, wasn’t far behind.
Let me highlight the lowest three absorption rates in the last five years:
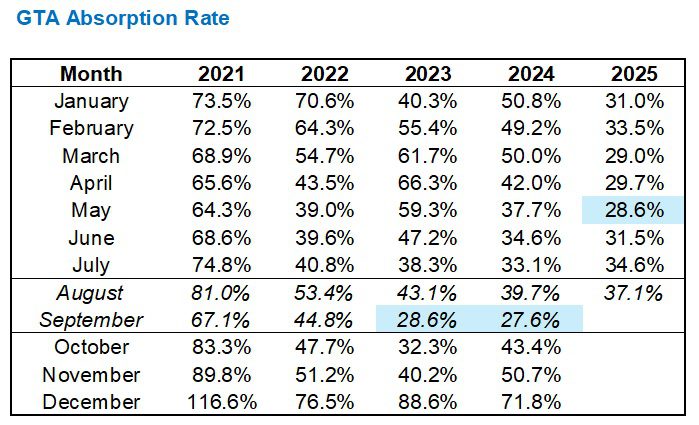
There are a few things I want to show here…
First, note that the last two Septembers have been brutal.
Second, note that the absorption rate always inreases from July to August and that it always decreases from August to September.
Third, note that the absorption rate dropped from August to September by 14.5% and 12.1% respectively in 2023 and 2024.
If we follow that trend this fall, then we’re looking at a new record low absorption rate in September.
Can that happen? Can we see an absorption rate in the GTA market of 25%?
I wouldn’t think so, but the above chart tells me to expect it.
Last, but not least, in case you’re wondering if the 905 is bringing the overall absorption rate down, let me show you the ratio by district:

I might suggest that the absorption rate in the condo market is bringing the absorption rate down, but that’s a conversation for another day.
As I sat here writing this on Sunday night, I received a notification that an offer is registered on a $3M house that I just showed this morning. Not only that, I put up my “Coming Soon” sign on a lawn in Moore Park on Friday at 1:00pm, and I just received my fifth email from an agent asking for information.
I dunno, folks.
The stats don’t look great but I’m feeling a positive “vibe” in the market out there. Or at least in some market segments.
I’ll keep you posted as we move along!


Serge
at 8:37 am
One thing that this stats is missing, it it how many sales are soming from new listings. If people are buying indiscriminately or cherry-pick from new listings?
Serge
at 8:39 am
Sorry for typos, but there is no editor to correct them 🙁
JF007
at 9:31 am
@DavidF can I make one suggestion for your stats charts. Can you go with one color for the year legend all throughout a blog. At times it can get confusing if in one chart Orange is for 2025 and the next one it denotes 2022 😀 .
Overall I feel markets will take some time to get back to their peak. Speaking to friends a broken trust in the system seems to be the biggest gripe, followed by still high interest rates, decrease in immigration and college enrollments cited as some of the reasons for continued downturn.
David Fleming
at 3:10 pm
@ JF007
Duly noted!
Yellow is always used for “current.”
I’ve changed the absorption rate chart to a light blue.
Derek
at 11:17 am
Did anyone have August 2025 for “new low” in the “when will we peak again” contest?
QUIETBARD
at 11:34 am
I wonder if the reason the absorption rate falls every September is due to the fact that perhaps everyone saves their re-lists for the fall market and suddenly lists in the month of September. That could explain the falling SNLR, although cant say for sure without further investigation
Ace Goodheart
at 9:52 am
You can grow a sunflower by putting a sunflower seed in soil, anywhere in your backyard. The following year you will have hundreds of them, as the seeds drop everywhere. They are easy to grow. Like Dandelions. They just come up by themselves once you start one out.
So the whole “price low and sell high” strategy seems to be working very well in our neighbourhood again. A total gut job house on Willard Avenue, in the coveted Runnymede school zone, listed for $1,299,000.00 just sold for a cool $1,725,000.00, a full $426,000 over asking.
This realtor tried out the offer night strategy, and it worked out marvellously for them. Almost half a mil over the list price. Not bad.
The house, if you look at the pics, was pretty bad inside, though it appears mostly intact outside. I see evidence of water leaking through the roof in the upstairs rooms, which means it probably needs a new flat roof. The electrical and HVAC seem to be original from what I can see (it even has the old, 1940s style push button light switches).
It appears to have an oil burning furnace (I can see the old oil tank in the basement in the pictures).
I do see some evidence of updated wiring and a breaker panel. The wooden addition on the right side at the back might need some work or may have to be torn down.
It does appear to have a two car garage, which looks to be in OK shape but it needs a paint job. There is grass in front of it. I don’t know how possible it would be to get a car down the driveway between the houses.
So by the looks of it, you probably have to put about 500K into this thing to make it live-able, at a minimum, so total layout is around 2.5 mil including land transfer tax and legals.
Things are heating up again if someone thought this is worth 2.5 mil. It may well be.
We may be headed back into another crazy run up in pricing. 2.5 mil seems a lot for that house, but maybe it isn’t? There is a lot of demand around here right now, as there is very little for sale. But that is pretty normal. When I moved down here, when a house came up, there was the equivalent of a festival with lines for open houses and an offer night with many offers being registered and bidding going on late into the night.