As you know, I don’t promote “Guest Blogs” here on TRB, but from time to time, I’ll ask my mortgage broker to pen something. Occasionally I’ll re-publish well-written journal articles. And a couple times in the past, I have used blogs from a website called Point2Homes.
The following article was sent to me a few weeks ago, but I didn’t do anything with it.
You’d be shocked at what I get in my inbox. While I recognize that much of it represents drip-campaigns or automated contacts, when combined with the actual people, and marketing/advertising/public-relations companies, I get about 20 soliciations per week to post on TRB.
I also get about 10-15 contacts for advertising on TRB, which I find odd, since I’ve never put advertising on my site. Why would somebody even ask? I turned down a five-figure fee from a well-known developer a couple years ago. They wanted to advertise pre-construction condos on TRB. Had they ever actually visited my blog?
In any event, I certainly hope my publishing this today doesn’t feed that fire, but I really feel like based on the conversation we had on Monday, about the average home price in Toronto, market cycles, and the continued price apprecation since the short “correction” back in 2008, this article is really, really timely.
It also contains several statistics that we might spend a good amount of time researching on our own, so at the very least, I figured it would give both the bears and bulls among the commenters some more fuel for their respective arguments.
So have a read, I welcome your thoughts.
Buying a home or finding a rental you can afford is becoming more of a challenge both in Canada and the U.S. Compared to ten years ago, securing shelter is increasingly more financially burdening north and south of the border.
But are housing costs more overwhelming in Canada or in America? After both countries experienced their own share of economic troubles, where are their housing markets heading now and what does that mean for the average American and the average Canadian looking for a home?
To compare the evolution of the two housing markets and to assess their current status, our analysts extracted historical data on market trends and examined numbers from 2008 and 2018. They looked at key metrics including average home price, rent, homeownership rates, changes in the countries’ median incomes, and the countries’ evolution on the affordability scale for a side-by-side comparison.
Here are the main findings:
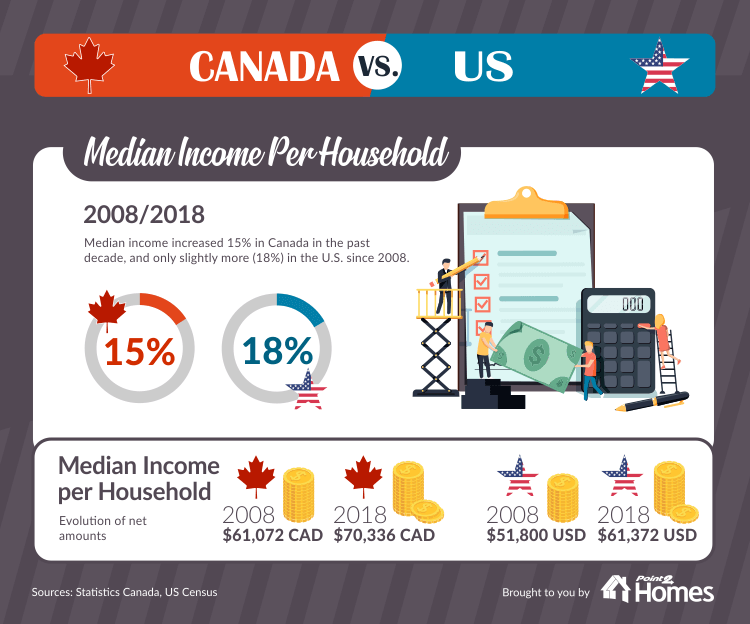
- The average Canadian has to dish out a whopping 56% more to buy a home, or 25% more to rent one compared to ten years ago, but the median wage in Canada only went up 15%.
- The average home price in the U.S. increased at a much slower rate (24%), while the median income went up by 18%.
- Since 2008, the Canadian dollar lost approximately 25% of its power compared to the American dollar, going from almost perfect parity to a much lower exchange rate.
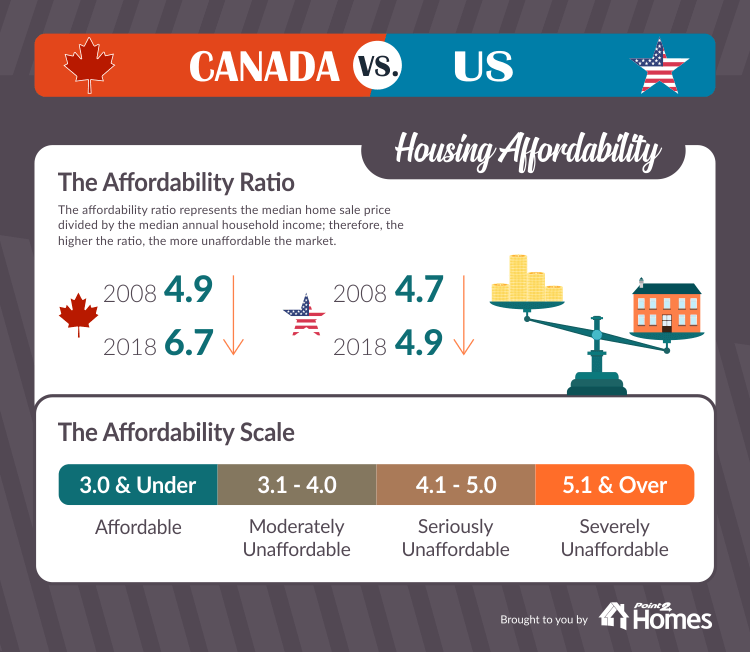
- The affordability crisis worsened in Canada, where the housing market went from “seriously unaffordable” to “severely unaffordable”, but the American housing market remained in the “seriously unaffordable” category.
Eight years into the new millennium, the U.S. marched head first into one of the worst economic crises in its history following the bursting of the housing bubble. Canada’s real estate bubble hasn’t yet popped and the country has not yet seen a major decline in home prices, but the Canadian economy experienced its own share of turbulence following the oil price crash from 2014 and the burst of China’s speculative bubble.
And now, 10 years after the housing crisis that destabilized the U.S., some analysts claim that Canada faces a similar scenario if it stays the course: household debt currently exceeds 100% of GDP, according to data released by the Bank for International Settlements, the average home price went up 56% in ten years, while the median wage per household only increased 15% during the same period, and loose lending is on the rise.
In the past six years, the Canadian dollar has lost 25% of its power compared to the American dollar, going from almost perfect parity to a much lower exchange rate. Therefore, in this study, the median wages, the average home prices, and average rents in both countries are expressed in the respective country’s currency, to avoid distortions and inaccuracies in percentage changes.
Research on homeownership reveals the extensive economic, social, and psychological benefits associated with owning a home. And although it is the Americans who consider homeownership an integral part of the American Dream, Canadians have equally strong aspirations of homeowners, as well as higher ownership rates.
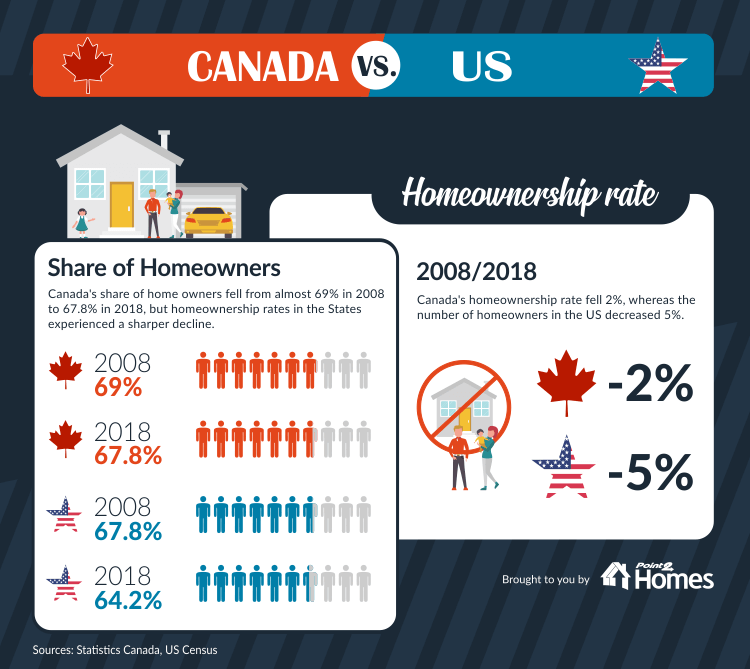
In the U.S., homeownership rates reached a peak towards the end of 2004, when the percentage of homeowners settled at 69.2%, only to start decreasing in 2007. By 2015, the share of homeowners in the U.S. fell to 62.9%, a level that hasn’t been seen since 1965, when data gathering was just starting. After three years of recovery, the share of homeowners in the U.S. is currently pegged at 64.2%.
In Canada, homeownership rates rose at a steady pace for more than four decades, hitting an all-time high of 69% in 2011, but that percentage went down to 67.8% following the economic downturn from 2014. This is the first time the share of homeowners declined in Canada in almost half a century.
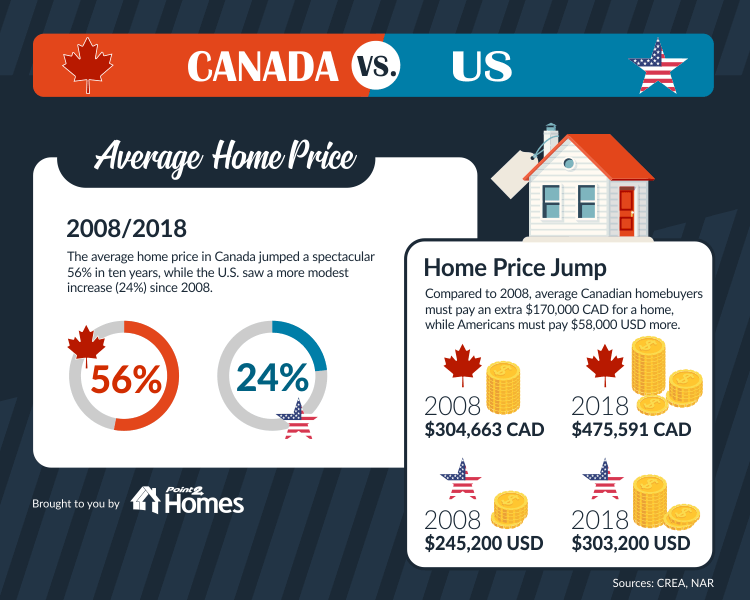
And with average home prices rising at an alarming pace north of the border, it is no wonder the average Canadian can no longer easily commit to a mortgage. Due to a staggering 56% jump since 2008, Canada’s average home price went from $304,663 CAD to $475,591 CAD in just ten years.
The U.S. market’s increases have been more contained: after a 24% increase, the average home price went from $245,200 USD in 2008 to $303,200 USD in 2018.
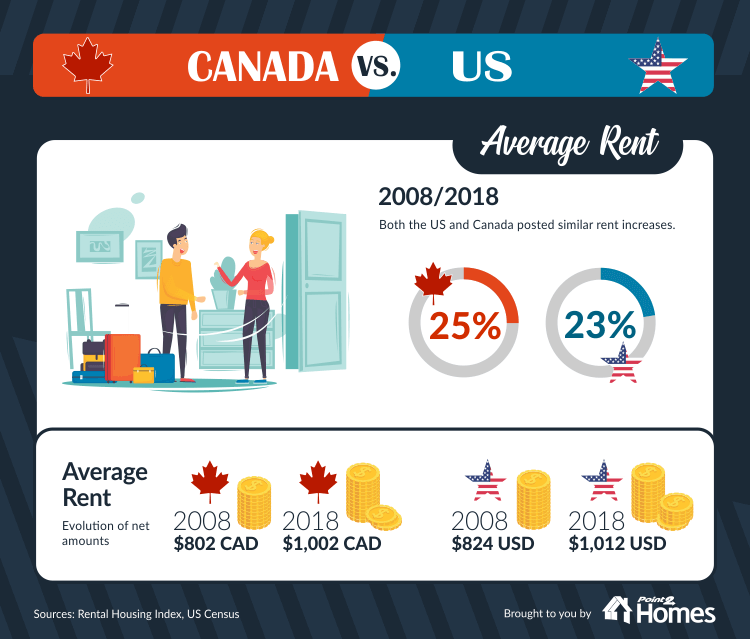
The alternative to homeownership, renting has been on the rise in both Canada and the U.S. in the past decade. And so has the average rent in both countries. In Canada, the average amount went up 25% in ten years, and the U.S. had a similar trajectory, posting a 23% increase since 2008. However, all cities are not created equal.
According to RENTCafé.com, average rents in New York and San Francisco are way ahead of all the other American urban centres: in Manhattan, renters pay $4,119 USD, and even in Brooklyn, they face average rents of $2,801 USD. Four other cities post average rents above $3,000 USD: San Francisco, CA ($3,590 USD), Boston, MA ($3,379 USD), San Mateo, CA ($3,234 USD), and Cambridge, MA ($3,112 USD).
In Canada, it is Vancouver and especially Toronto that boast the highest rents, but they are well below the highest rental rates in the U.S. – in both cities, the average rent hovers around $2,000 CAD. And Vancouver doesn’t show any signs of slowing down: the provincial government agreed to a 4.5% maximum allowable rent increase for 2019, which is the largest rent increase since 2004 when the ceiling was set at 4.6%.
Although incomes also rose in Canada over the past decade, they were easily outpaced by growth in home prices. The average Canadian is currently looking at home prices 56% higher but has an income only 15% larger.
Compare that to the situation in the U.S., where the median income per household increased by 18%, while home prices went up by 24%.
So while it’s true that average home prices and rents are increasing faster than wages in both countries, Canadians are at a clear disadvantage.
Closely linked to the median wage issue, housing affordability has a major impact on standard of living. And looking at the evolution of the Median Multiple – the median house price divided by the median household income – in the U.S. and Canada’s largest cities, it is the Canadians’ standard of living that is hit the hardest.
While in 2008 the national unaffordability ratio in Canada was pegged at 4.9, which placed the country in the “seriously unaffordable” category, in 2018 it climbed to 6.7, which is far into the “severely unaffordable” end of the spectrum. As RBC‘s latest report also points out, “Canadian housing affordability is now at its worst level since 1990.”
The U.S., on the other hand, remained in the “seriously unaffordable” category, going from a ratio of 4.7 in 2008 to 4.9 in 2018.
According to a previous Point2 Homes study, housing affordability varies wildly in Canada and the U.S., from province to province and state to state, but it’s mostly individual markets in both countries that are pushing these rates higher and higher.
So what are the main markets that are making such an impact on national affordability, forcing owners with a mortgage and renters to spend more and more of their income just to cover housing costs? Vancouver, BC comes first, with a staggering 17.3 on the affordability scale, followed by Manhattan, NY with 15.6. San Francisco, Los Angeles, and Boston all scored 10 and above; Canada doesn’t have any other markets in the top 10, although the Toronto and Mississauga housing markets come in at No. 13 and 14.
Given the significant discrepancy between the evolution of home prices and wages, Canadians might be headed for a rough ride. There are many other factors, including an increase in subprime lending, that suggest the Canadian housing market may be following the same path Americans did a few years back.
Currently, there is a healthy debate between bullish market analysts, who claim that all is well in Canadian residential real estate, and the bearish prognosticators, who see a storm on the horizon. The optimists point to a solid 2% increase in GDP for 2018 and increased sales activity after a fairly soft spring market. Some bulls also say that the rising popularity of condominiums and other multi-family dwellings in Canada, especially by immigrant buyers, will act as a cushion for the tight housing market.
However, the pessimists emphasize five important factors suggesting that Canadian home prices probably face a decline in the years ahead: high housing price-to-income ratios, rising interest rates, 5-year balloon payments and adjustable rate mortgages, suppressed economic activity in the U.S., China, and Canada due to tariffs, and sky-high valuations in some of Canada’s most expensive urban centers.




Izzy Bedibida
at 9:06 am
I’m surprised that the mortgage interest deduction available to Americans and not Canadians wasn’t mentioned. I would like to know how it affects the finances/affordably of the average American buyer vs the average Canadian buyer.
Geoff
at 4:30 pm
Perhaps offset by Canadians capital gains exemption in primary residence sales?
Chris
at 9:20 am
Good article with some interesting data. Looking at things on a national level, however, can miss a lot of the regional details.
This interactive graph allows comparisons to be made between cities:
https://www.economist.com/graphic-detail/2018/08/09/global-cities-house-price-index
As an aside, while this article claims it is more affordable than them, The Economist has Toronto as less affordable (price to income ratio) than San Francisco, Boston, New York.
With regards to what this means for bears, bulls, or the market as a whole, well, I think I will defer once again to Nobel Laureate economist Robert Shiller:
“It can’t go on forever, of course. But when it will end isn’t knowable. The data can’t tell us when prices will level off, or whether they will plunge catastrophically. All we do know is that prices have been roaring higher at a speed rarely seen in American history.”
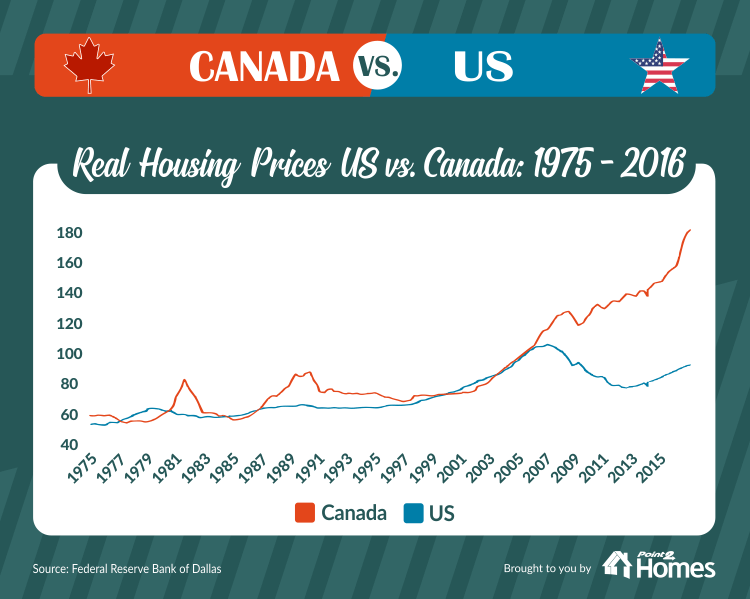
Replace “American” with “Canadian”, and glance at 2009 onward in the first graph.
Lauren
at 10:52 am
Meh. This guest post lacks your folksy intro! 🙂
Housing Bear
at 11:24 am
Good article. A couple more comparison points between us today and the US back in 2007/2008
Household debt to GDP
USA peaked at about 96%
We are now over 100%
Household debt to disposable income
US peaked at 128%
We are at 170%
Heloc % of GDP
USA peaked at 4.5%
We are at about 12-14%
HELOC one looks really bad but its a result of how we fund subprime mortgages here. Borrow against your inflated equity at 3-4% then lend it to someone who can’t get a bank mortgage at 12-18%, so that they can buy an inflated asset too.
Another good comparison is interest rates following the bubble blowing up. in 2007 the Fed got their rate back up to 5%, and then were able to cut almost 500 bps when the crash was in full effect. Looks like our rates will peak somewhere between 2- 2.5% so BOC will not be able to provide the same cut stimulus if/when SHTF
crazyegg
at 1:48 pm
Hi,
Interesting point about the over indexing of HELOCs in Canada.
May be related to the fact that interest on homes are not tax deductible in Canada as many have indicated.
As such, one legal way to get back that interest is to borrow against your home’s equity to invest on other dividend generating instruments or investment real estate . Frankly, I am surprised the HELOC rate is not even higher…
Regards,
ed…
Izzy Bedibida
at 6:23 pm
I did that when I bought my condo many years ago after I read about the Smith maneuver. It made my mortgage tax deductible.
maha
at 12:08 pm
Some things that I wish were taken into account more often when comparing housing affordability between Canada and the U.S.
1. as mentioned above, the mortgage interest tax deduction in the U.S.
2. higher costs for health care costs/insurance in U.S. reducing available family spend for housing
3. the extreme amount of student indebtedness reducing the ability of young Americans to buy their first homes while post-secondary education is generally less expensive in Canada.
4. Canada has a smaller population with fewer large cities and comparatively less job mobility. The most expensive cities, Vancouver and Toronto also have arguably the best’ (or ‘least dreadful’) weather, leaving Canadians with fewer options to relocate elsewhere and further driving up prices in the cities where people most want to live.
And when it comes to comparisons between now and the U.S. in 2008, there is a much stronger banking regulations and lending culture in Canada. I wouldn’t underestimate the tight grip of OSFI in Canadian banking. So if we do in fact have a crisis coming, it will be a unique one of our own making.
Professional Shanker
at 12:50 pm
Typically all studies compare pre-tax income, therefore adjusting for (mortgage interest, health care, etc.) is moot and shouldn’t be included in order to get a more apples to apples comparison.
When you have a valuation difference which is this stark/significant, no amount of factors/adjustments will make up for the simple conclusion that the valuation gap will close over time.
Your #3 point is interesting.
Not Harold
at 10:44 pm
Affordability is all a matter of post tax and not pre tax income.
If you have the same income but much higher income &/or consumption taxes in one jurisdiction, then with the same risk appetite and interest rate environment you’ll see different stable debt-income ratios. Similarly other debt and mandatory spending will see more or less money available. #1 used to push up price and debt: income in the US, recent tax changes are moving it in the other direction. #2 and #3 are also pushing stable price and debt to income ratios down in the US compared to historical. Canada is seeing much less change on all three factors, so you would expect that Canada and the US would see a widening gap between their respective safe price levels, if you looked at the percentage change in ratios since 2003.
As to point 4, difference in prominence of certain urban centers is one of the biggest issues in economic geography. An economy that is highly centralized will have its statistics dominated by that city, while a distributed economy won’t be overwhelmed by the largest city or two.
Countries like the UK and France are absolutely dominated by their capitals. Metro London has 22% of the UK population and 30% of its GDP. As a global city its economy and prices are more tied to the world economy than to the success of Northern Ireland or Cumbria. With such a concentration of GDP it will make the UK’s overall affordability seem lower.
The US has always been a multi-polar nation. Many states have multiple large cities and the eastern seabord has many important ports close together, even when one city dominates its state.
Canada has typically been multipolar, with similar settlement patterns and geography to the US. It has recently been evolving into a much more centralized model, with Toronto rocketing up in size and importance. Toronto now has roughly the economy of the province of Quebec or Alberta.
Greater NYC is 10x larger than the US’ 34th largest metro area Indianapolis. Toronto is 10x larger than the 10th largest metro with the 9th and 10th metros arguably being part of the GTA (Hamilton-Burlington and KW). Put Hamilton and KW into the GTA and Toronto is 10x larger than the 8th largest metro, Winnipeg.
Using that adjusted Toronto number, Toronto is 3x larger than Vancouver, #3 metro in Canada. Greater NYC is about 3x the size of the 5th and 6th largest metros, Houston and DC. Using GDP Toronto is 2x larger than Montreal and NYC is 1.7x larger than LA.
So Canada is dramatically more centralized than the US. ..
To see the differences in ranks – Boston is the 10th largest city in the US with a median home price of $699k US, median home price in Indianapolis is $150k US vs $828k US in NYC. Toronto is $824k CAD, $314k CAD in Winnipeg, and $246k CAD in Belleville (34th largest CMA in Canada after adjusting Toronto).
This gives you a power law relationship – it’s like half a bell curve. Since Canada is much more centralized than the US, the curve is much sharper in Canada. This is true in terms of population, GDP, and house prices.
So we’re seeing national numbers in Canada absolutely dominated by Toronto and Vancouver, cities that we would expect to be decoupled from national economic statistics. It is much more worthwhile to lever up so that you can participate in the Toronto economy than to be part of Winnipeg. Things have gone too far and prices are moving far more on the economics of other countries than is healthy. But #4 is another reason why we should expect that the safe ratios in Canada are different than they were 30 years ago and that the safe ratios are changing as compared to the US.
I think that prices in Toronto and Vancouver especially are out of line and need to retrace. The ratios are in a bad place. I just want to highlight how the stable level is likely different than it was 30 years ago and that there are good reasons to believe that our stable ratio would be moving in a different direction than the US’
One thing to also account for is the 25% depreciation in the dollar. Since global demand is in USD, we would expect to see this depreciation reflected in internationalized housing markets. It’s on the higher end of the market and concentrated in our most accessible cities – Toronto, Vancouver, Montreal. These are also places where many local people’s earnings are tied to foreign currency, adding more price support from a falling currency. This may be worth 2-4% increase in the overall price level. Not earth shattering, but when you add it to the other 4 factors you start to get a major influence – we would be 20% overvalued rather than 35-40%.
But oil can go to zero and interest rates to 6% tomorrow and none of this matters.
Kyle
at 2:22 pm
@ Maha
These are all perfect reasons that explain why trying to compare real estate in Canada vs US is a useless exercise, especially your point number 4.
“The three biggest metropolitan areas in the country — Toronto, Montreal and Vancouver — are now home to more than one-third of all Canadians with a combined population of 12.5 million, with almost one half living in Toronto and its suburban neighbours, the data shows.”
https://www.cbc.ca/news/politics/cities-population-census-2016-1.3972062
If 1/3 of Americans lived in New York, Los Angeles and Chicago, their affordability numbers would look way worse than ours.
Chris
at 3:13 pm
Perhaps there is some truth to this. If we look to Australia, their three largest cities (Sydney, Melbourne, and Brisbane) constitute over 50% of the nation’s population.
All three are fairly un-affordable, Sydney and Melbourne especially so, with both ranking as less affordable than Toronto.
Yet, the Australian property market seems to be heading into increasingly choppy waters:
https://www.businesstimes.com.sg/real-estate/be-prepared-for-housing-price-dive-australia-told
Sydney’s market has already fallen 10.1% from its peak.
“We are obviously past the cycle peak in housing and prices naturally are coming off,” Craig Vardy, BlackRock Inc’s head of fixed income for Australia, said at a briefing in Sydney on Tuesday. “Moderation in the housing market is expected to continue.”
So, while a nation’s population concentrating into fewer cities may exacerbate un-affordability, at least in Australia’s case, it doesn’t seem to prevent downturns. Indeed, this may be what we’re beginning to witness in Vancouver; sales volumes have tumbled, MOI is a hair below 8.0, and prices are starting to move ever so slightly downwards (HPI down 1.4% from Nov. 2017).
Professional Shanker
at 4:32 pm
I left #4 as I presumed most people would think it is a massive reach. In a country that is roughly 9 times the size of Canada you should not compare the 3 largest cities in Canada to the largest 3 cities in the US in order to draw a comparison on urban densification. US being larger will have more urban centers. If you compared the 20 to 30 largest metro areas in the US to it’s population, roughly the same density would exist.
Kyle
at 4:48 pm
I don’t see how it is a reach. Canada’s population is VERY highly clustered, and outside of those clusters, it is very sparse – like wilderness sparse. US is not like this at all.
Professional Shanker
at 5:25 pm
Simply untrue, large metro areas in the US are densely populated as a comparison to overall population similar to Canada. This isn’t a reason for higher prices, but really just used currently as a justification for a widen price gap over the past decade.
Feel free to compare the top metro areas in the US as I referenced in the previous response.
We likely won’t see eye to eye on this as I am taking an objective statistical approach to the comparison.
If you want to argue that the Northern parts of our country are sparse, sure that is true but not sure how this at all factors into house prices.
Kyle
at 7:46 pm
It’s not about density it’s about distribution. A quarter of our Country live in the two most expensive Cities in the Country. So averaging out the whole Country makes no sense.
And even if you’ve convinced yourself that they are comparable, not sure how this Country-level analysis is useful for anything. Are we to assume from these findings that all of Canada from Victoria to Charlottetown is overpriced compared to the whole of US? Like i said country vs country is a useless exercise.
Housing Bear
at 10:04 am
@kyle
The whole country is not overpriced. In fact it is really just two markets, ,which even when averaged out across the whole population, bring our national household debt metrics well above those of our american peers ten years ago. The average decline across the US was 35%. But the ground zero markets like Vegas, AZ, Florida all fell by over 50%.
Yes there are key differences (good and bad from a real estate standpoint) between our two countries, but debt metrics are pretty unbiased.
How much of you income goes to debt. Total debt vs your total income. Household debt to GDP. All of these are help determine the likelihood a borrow or an economy is in over their head. Yes US households have to pay for more services themselves, they also for the most part pay lower taxes and earn higher incomes.
Kyle
at 11:11 am
Sure talking about Debt metrics (which was not one of the metrics provided in the above article) can be constructive, but not at a Country vs Country level without understanding what the key differences are and how distribution differences skew the metrics.
Conclusions made on Avg Canadian Debt to income ratio vis a vis real estate is going to suffer from the same skew effect (2 large expensive cities are vastly over-represented in the numerator, while the denominator is evenly collected from across the whole Country). So comparing against the US levels, relative to times when their markets crashed (not saying you do, but there are people who do) is nonsense.
As well there are very different banking and tax rules that further render such comparisons even more useless. Comparing debt levels over time are more useful, but ultimately come down to one’s own opinion of how key debt is to house prices.
I understand you think debt and interest rates are the primary long term driver of house prices. I think it’s a factor, but not the main driver. In my view it is more a catalyst than the fuel. Jobs are the fuel.
Jimbo
at 9:42 pm
2. Only superstar insurance is more expensive than what we pay in Canada. $1,600 a month for a family of 4 and includes all possible treatments. For a level of insurance equal to Canadians most government workers and a good portion of private sector don’t pay a cent above what their employer pays. Business owners, doctors, entrepreneur etc. $400-$1200 a month for a family of 4. I am basing this off of family so it is a limited analysis but I don’t think it is too far off. Don’t know anyone that has suffered a major illness so don’t really know how payment increases work. At 65 you qaulify for medi government plan.
3. Most state schools are just as cheap as Canadian universities for in state population. Private/Catholic and ivy League universities can get very expensive very quickly. Ivy League looks at family income and a good percentage of students go for free.
1 and 4 are bang on. It amazes me how little we know of the US and how little they know about us. I don’t think you can compare the two real estate markets as the way we qaulify for financing is different, our banks are mostly national, the level of choice in where to live and make a good wage etc. etc.
Not Harold
at 11:06 pm
Penn State in-state tuition is $17k USD, out of state $31k USD. University of Western Ontario is $7k CAD. Bishop’s is about $7k for Ontario residents and $2.3k for Quebec ones, Dalhousie is $9k.
You can get different numbers by program but that’s a HUGE gap for in state students.
As to insurance – you really haven’t used American health insurance. You are looking at LARGE annual deductibles (5-8k at least with your $400 a month plan), as well as co-pays. Then there are issues of out of network suppliers in a hospital (big new issue – you go to Hospital A and Doctor B who are covered by insurance, but Anaesthesiologist C that you don’t choose or even interact with isn’t in network and BAM massive charges. Even has been happening with emerg doctors… ER is in network but the doctor is a contractor and you don’t find out until your insurance denies coverage).
Classic insurance where it is “free” to employees is becoming rarer as it becomes much more expensive. Even for government workers. If you work at Goldman or Google it’s free and you’re making $400k++ so you wouldn’t notice even if it cost $3k a month. If you’re working for the city and making $60k it’s definitely not free and that $1k a month HURTS.
Jimbo
at 1:11 pm
Florida State is $6,505 for in state and $22,000 out of state. I believe if you average out all state universities you would come in between $8k and $12k. But there are some states that are high. University of Pittsburgh comes in at the same price as Penn State.
Comparing to Quebec isn’t even fair lol
I do understand that you can run into problems with some hospital networks but at least you are getting timely care, the large deductibles really only come into affect if you contract cancer or are involved in a large trauma etc. I’m pretty sure Obama care was addressing some of these issues. Very complex issue to discuss and I’m in no way qaulifed to debate the whole issue. I do know of one hospital in an area with a population of 80,000 in WV was writing off $1.6 million in care a month in the late 90s. I believe they received $60k each month from creditors for the right to collect (60k may be low but it was pennies on the dollar)…. Uncle was the CEO of the hospital (He prefers our system, every other family member that has lived in Canada does not). In the end health care will bankrupt you if you don’t pay for the correct plan in the US, it will only bankrupt you here if you want the latest treatment and not what you are covered for.
My wife and I pay $45k in tax not including CPP, EI etc. They say 40% of tax goes towards health care in Canada, so that works out to $1,500 a month for a family of 3.
You make valid points but I disagree the $1k a month hurts of that $60k is the family income with a single income household. That family tax rate is very favourable
Appraiser
at 8:24 am
You bears all seem to be on a crusade.
Over a decade of wandering, feverishly theorizing, nay fervently praying… In search of the Holy Crash?
Chris
at 9:19 am
Ah good, another appraiser rant, adding absolutely nothing of substance to the conversation.
Not only is your bloviating useless, it’s also just plain wrong.
Those who consider Toronto real estate overvalued today did not necessarily all consider it overvalued in 2008. It is not a case of picking a side between two warring factions, but rather a shifting perspective of valuation based on price and other factors.
Take Housing Bear as a perfect example of this; he claims to have only recently sold his Toronto home. If he was a bear on a decade long crusade, wouldn’t he have sold back in 2008? And presumably, he will buy back into the housing market if prices drop to a point where he once again sees value.
Appraiser
at 6:08 pm
I find your your argument(s) weak and borderline laughable.
The same tropes and memes trotted out over the years by the likes of Garth Turner, Ben Rabidoux, David Madani, and many others…
…whom by the way nobody quotes anymore.
Yikes! Yeah Laughable.
Chris
at 6:26 pm
That’s nice, appraiser. Your opinion doesn’t matter to me, so it’s no skin off my back what you think.
Next time, perhaps try contributing something substantive to the discussion, rather than the usual juvenile trolling and personal attacks?
Appraiser
at 6:40 pm
Your level of debate is still amateurish and laughable; full of empty theorizing, outdated ratios and armchair analysis – same as most of your heroes and predecessors.
Move out of the basement and get a job already.
Appraiser
at 6:52 pm
P.S.
I’ve been right for far longer than you’ve been wrong – and I put my money where my mouth is. You on the other hand, are clearly mired in perpetual academic theory mode, with no real world experience to guide you.
…a little sad, bordering on pathetic.
Chris
at 8:17 pm
More personal attacks, this time interspersed with wild-eyed speculation about me. Interesting.
As David said the other day:
“And then when they’re wrong, they double-down, get ruder, meaner, and provide less evidence for their prediction.”
Once again, I would suggest you try contributing to discussions like an adult.
Have yourself a great evening, appraiser.
Chris
at 11:38 am
More bullish news out today:
https://www.bnnbloomberg.ca/toronto-and-vancouver-most-vulnerable-to-rate-hikes-cmhc-1.1182948
https://business.financialpost.com/personal-finance/mortgages-real-estate/toronto-new-home-prices-post-biggest-12-month-drop-since-1996
Jimbo
at 10:42 pm
Statistics Canada’s price index for new Toronto homes fell 1.4 per cent in October from a year earlier, the most since September 1996.
That is like the Boston Celtics playing a bad quarter during the fifth game in a 20 game win streak.
Chris
at 9:13 am
So 1996 to 2018 represents the first five won games, and you’re anticipating a further 15 game win-streak for Toronto real estate?
It’s a bold prediction, I’ll give you that much.
Jimbo
at 9:13 pm
Not at all. Flat line or small fall. I’ve been a bear since 2007. Been wrong about Toronto for that long….
Large fall doesn’t help anyone, I’m hoping inflation kicks in and raises pay rate and we can survive the interest rate hikes.
Just don’t think the biggest fall since 1996 is anything worth taking about
Max
at 2:38 pm
Is it me, or a bunch or numbers in the graphs are off?
Graph 2: Share of Homeowners
1- Canada 2008 is Almost 69%. Why not 68.X%? It’s the only number not with decimals.
2- On the right side Canada’s home ownership rate fell 2%. Well… its really 1.2% and that is if you round up the first to 69%. In all likelihood it’s more like 68.8% which means it fell only 1% or even less.
3- How does a fall from 67.8% to 64.2% come up as -5% decrease? This is 3.6 in my books, or maybe 4 if you round up. Not 5.
Graph 3: Average home increase for Canada
Spectacular 56% for Canada and more modest increase in the US (24%)… ugh… looks like -24%
Graph 5: Median household income
Again (18%) for US… so wrong…
Graph 6: Affordability ratio
It’s worse sure… an arrow saying it dropped from 4.9 to 6.7… great way to explain it
Good thing they added text to explain the graphs.
Thanks for the article, but it says nothing new to the average reader of the post and the quality of the info-graphics is just not there either.
Jimbo
at 9:15 pm
3.6÷67.8=0.053 or 5.3% drop