“Because people don’t want to live in Ontario anymore, that’s why.”
Shelve that comment for a few moments, will you?
Just keep it in mind as we work through today’s blog post, because after all is said and done, and when I’m looking for an answer that explains today’s data, I think some of you will draw on that quote…
Raise your hand if you like looking at real estate outside of where you live.
Uh huh.
While I can’t see you, I’m willing to bet that your hand is raised.
This is one of my favourite pastimes, and even though I don’t travel very often, and I don’t really enjoy “vacationing” all that much, I still do dream.
The other day, I found myself looking at real estate in Prince Edward Island.
Have a look:
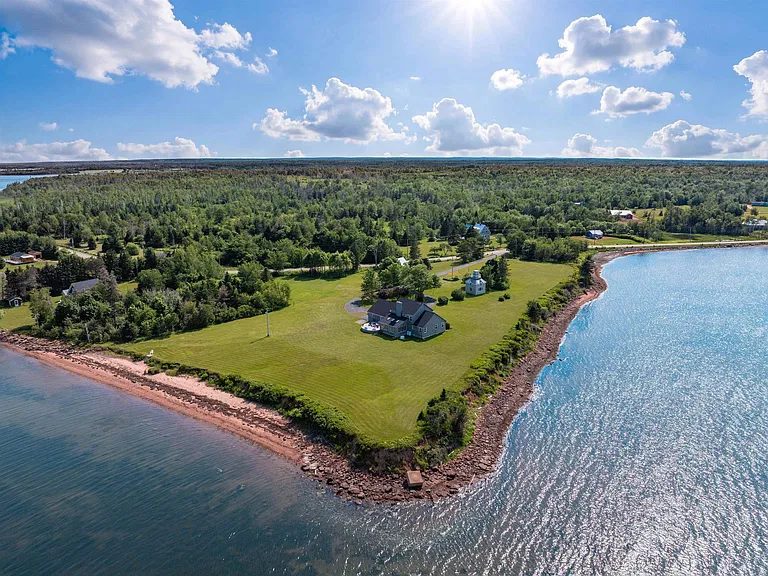
This is a three-acre lot with 900 feet of beachfront!
That beach ain’t a lake, by the way. We’re talking oceanfront!
Somewhere, one of you is saying, “Yeah, and due to climate change, this property will be underwater in two decades.”
Maybe.
But the listing description says that the house comes with a snorkel and swim fins, so I think we’re all set…
This 3,400-square-foot home with 5-bedrooms and 4-bathrooms is priced for a mere $1,375,000.
And it looks like the property has been sitting for a while and has been reduced a few times. HERE is the link to a video from 2024 when the house was listed for $1,850,000.
I don’t love the interior of the house, but rather it’s the property I’m fascinated by!
I’ve never been to Banff and yet, for some reason, I’m looking at houses like this:
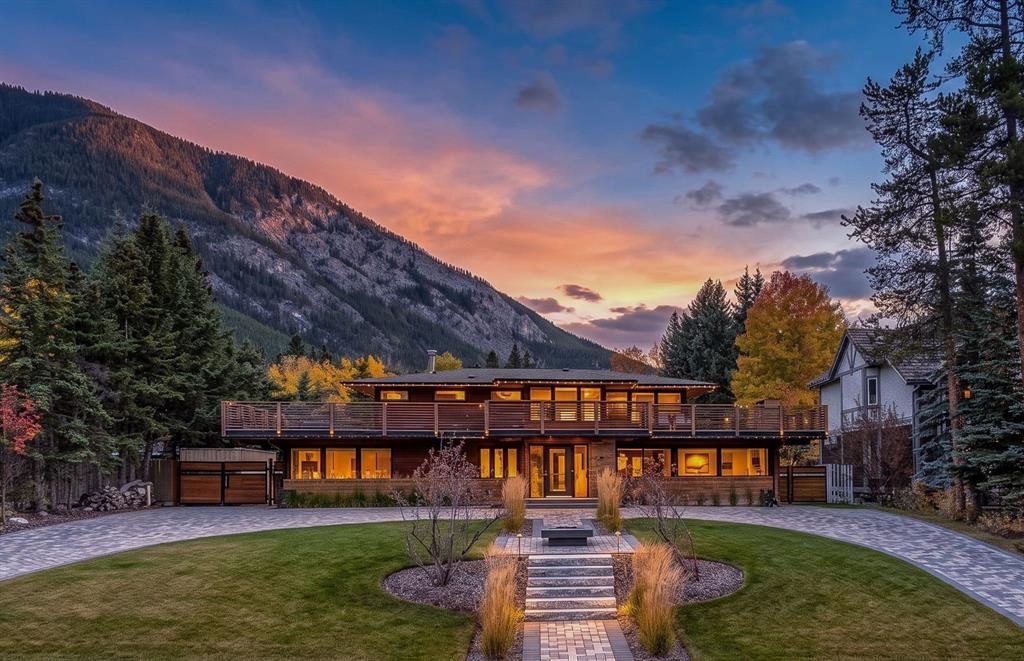
A mere $4,150,000 for this beauty!
Listing link HERE.
And while I know that it’s very unacceptable these days to talk about anything American, I would be remiss if I didn’t tantalize you with the current apple of my eye.
How about a cozy little cottage in Jackson, Wyoming?
She’s cute:
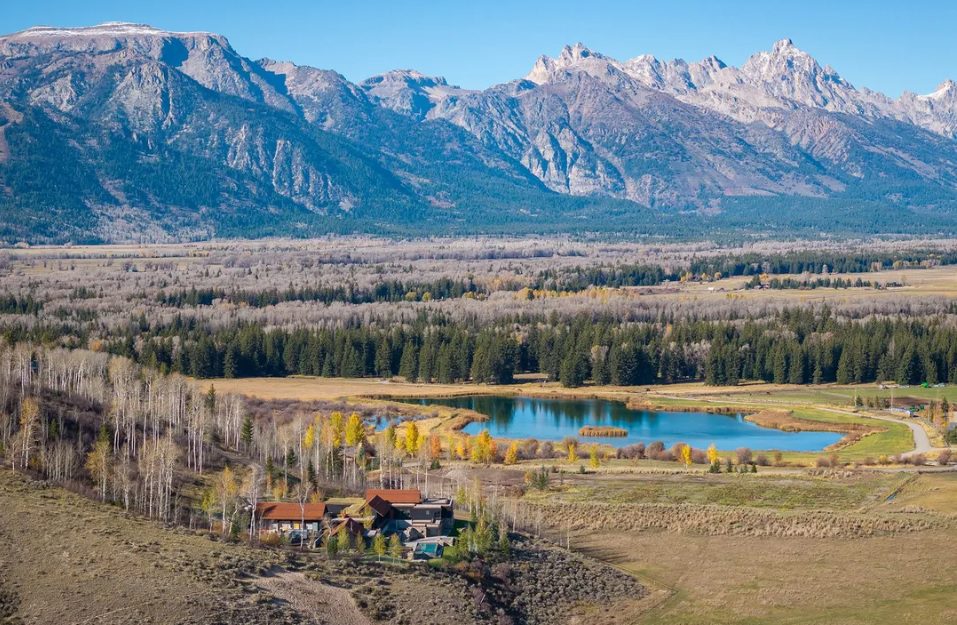
Don’t let the photos fool you.
This is a 10,000-square-foot house on over 35 acres of land.
A shoddy $49,000,000 USD.
Yikes, it might be tough to discuss real estate in Sault Ste. Marie after seeing that, but let’s get down to business.
It’s been almost exactly one year since I wrote a similar feature here on Toronto Realty Blog about Canada-wide real estate prices. We spend so much time talking about Toronto that once in a while, it’s nice to look outside the GTA, over the Ontario border, and check out what’s happening across the country.
Not only that, you can often tell a lot about a city by seeing what’s going on in a different one.
The Canadian Real Estate Association publishes its Home Price Index (HPI) statistic every month for nearly 60 provinces and cities across Canada.
From this, we look at the “Composite Benchmark,” which is not seasonally adjusted.
CREA does not provide data for Manitoba, Yukon, NWT, or Nunavut, although they do have data for Winnipeg, which you’ll see shortly.
So first, let’s look at the nine provinces that are tracked.
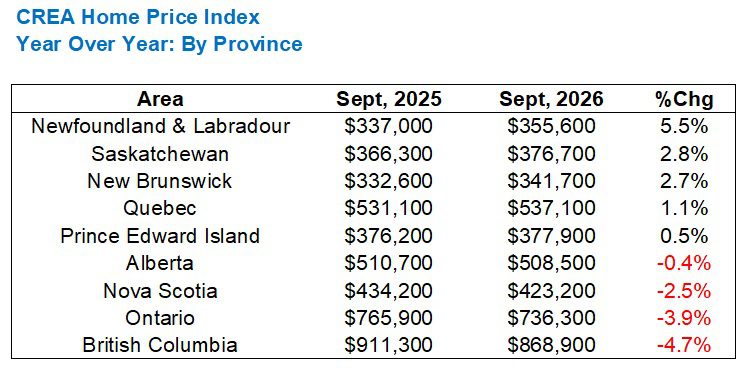
This is the HPI Composite Benchmark for September of 2025 and September of 2026:
Go on.
Is it what you expected?
I think most of us would have predicted that Ontario and British Columbia would be at the bottom of the list, although there’s a common misconception that Alberta is performing poorly, when that’s obviously not the case.
The decline in Nova Scotia surprises me, as this area was up substantially last year.
Speaking of which, I just had an idea!
How about I follow every chart with a look at how the year-over-year data in 2026 compares to 2025?
Like this:
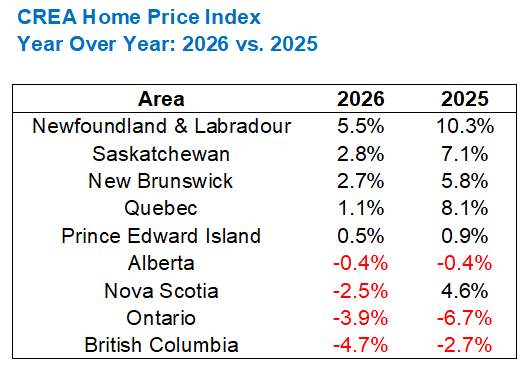
We’ll keep it sorted by the price increase in 2026 from here on out.
As you can see in the second column (2025), there’s a lot of consistency. In fact, Nova Scotia is really the only province where we’ve seen a significant change.
I would argue that we’ve seen a change in Quebec as well, as the year-over-year increase 2024-2025 of 8.1% was followed in 2025-2026 by “only” a 1.1% drop, but Nova Scotia is the only province to see a positive turn to a negative, or vice versa.
Newfoundland & Labradour and Saskatchewan continue to outperform.
If you happen to be reading this blog post from one of those provinces, please drop us a line!
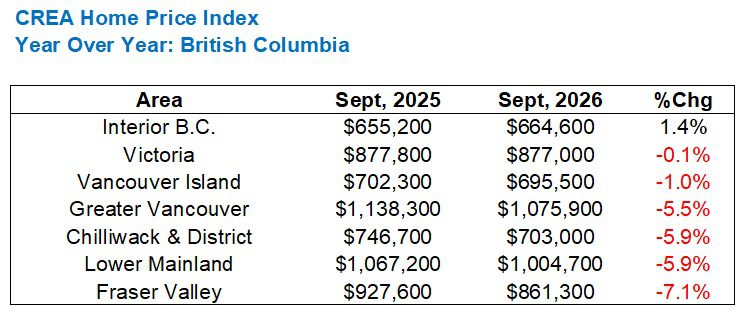
Now, let’s have a look at British Columbia, where CREA tracks seven geographic areas:
Yuck.
Six of the seven areas have seen a year-over-year decline, and in 2025, only three of the seven areas declined.
Lower Mainland is home to 60% of the population of British Columbia, and Fraser Valley is just outside of Vancouver. So suffice it to say, southwest B.C. has been hammered.
Here’s how 2026 and 2025 compare in British Columbia:
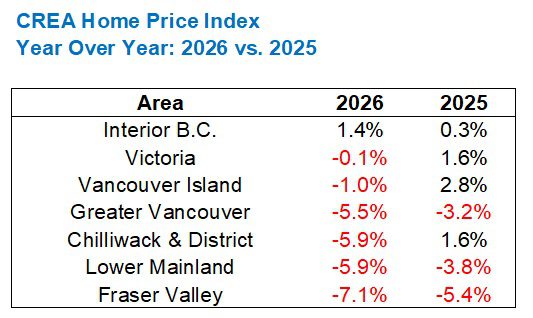
As I said, six of seven areas declined in 2026, which is up from 2025 when only three of seven areas declined.
Interior B.C. is the only region to see positive growth in two years.
Chilliwack & District is the only region to go from a positive to a negative.
Overall, British Columbia has been hit hard in 2026. Harder than in 2025.
Moving east, we’ll look next at the Prairies:
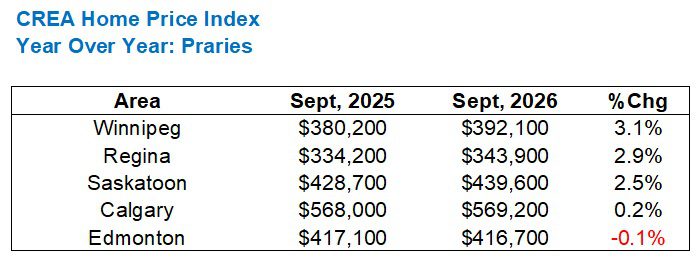
Not too shabby!
The change in HPI in Edmonton is “within the margin of error,” as pollsters would say. Sorry, I’m writing this during election time in Toronto, and the polls, percentages, and margins are all I’m hearing about.
Winnipeg, Regina, and Saskatoon have all been in positive territory over the last few years, and a quick look online says that net migration is positive in Winnipeg and Saskatoon, albeit negative in Regina.
Here’s how 2026 compares to 2025:
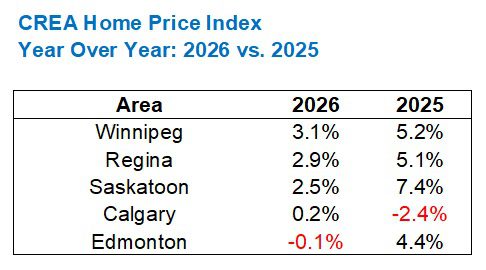
With the exception of the Calgary and Edmonton flip-flops, the Prairies look pretty consistent.
Prices continue to rise in affordable cities.
Speaking of “affordable,” shall we move on to Quebec?
The big story of this feature when we ran it in 2025 was how cities in Quebec had been moving!
Well, nothing seems to have changed:
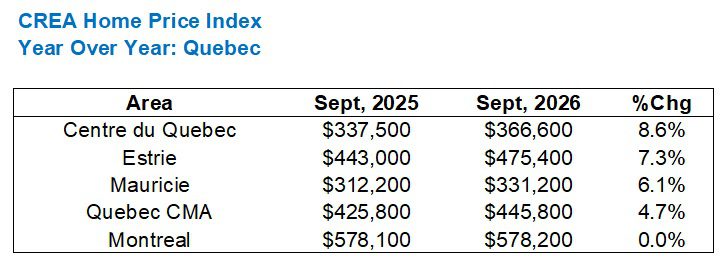
I’m tempted to say that the reason we’re seeing such incredible price gains in Quebec is that the real estate is so cheap to begin with, but there are a lot of affordable areas in Ontario which are down year-over-year, so throw that reasoning out the window.
What’s more incredible about these gains is that they come on the heels of a blistering 2025.
I was shocked by the price increases in Quebec in 2025, and the following chart is even more surprising:
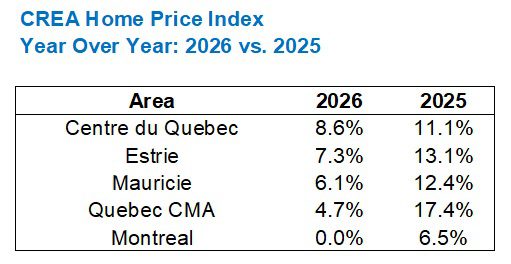
Those are massive two-year gains!
My mother is travelling in Quebec City as we speak. There have been no shortage of selfies on her Facebook and Instagram (she smiles from ear-to-ear when somebody comments on her photos…), and her daily reports are so enthusiastic.
omg I love it here…but very expensive
Very walkable, very safe.
Lots of tourists.
By the end of the week, I’ll know every inch of Old Quebec…
I just noticed that my mother uses ellipses just like I do. Perhaps that’s where I got it from?
Mom just sent me a photo from Château Frontenac:

More from Mom:
Oh boy, I’m having an early cocktail on a cruise boat…
St. Lawrence!
Mom, once you get to a certain age, you literally can’t do any wrong. Have another drink!
Let’s head further east now and check out what’s happening in the Maritimes:
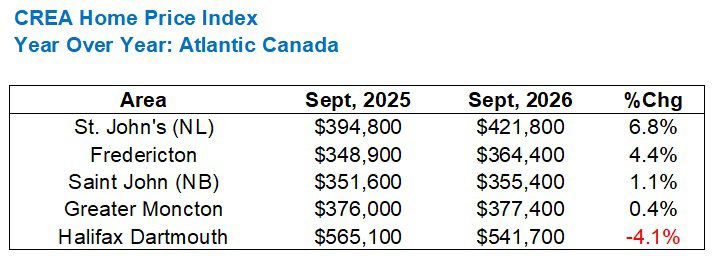
St. John’s.
Saint John.
This is sort of like when the Canadian Football League had eight teams, and two were called the “Roughriders.”
Personally, I think that once per year, a representative of our fine federal government should knock on your door and ask you which is “St. John’s” and which is “Saint John,” and if you get it wrong, you’re immediately deported. But that’s just me…
As for the running two-year tally, Atlantic Canada resembles Quebec in a way:
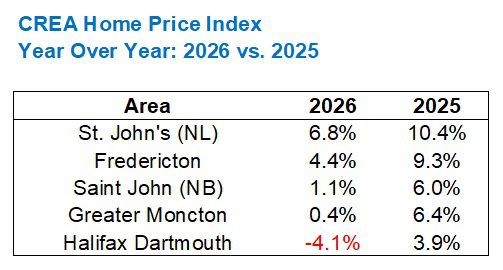
Halifax basically gave back the gains it made in 2025, but the other four on our list are all up significantly over the past two years.
St. John’s, eh?
Any blog readers out that way who can shed some light on all the action? Where are my Moncton transplants? Are you guys still reading TRB?
Well, we’ve saved the best for last, folks.
Hang on a moment while I look up Ontario’s motto.
Ut incepit fidelis sic permanet
Translation: “Loyal she began, loyal she remains.”
I’m shocked that this hasn’t been cancelled by society yet. Where are all the progressives? Why aren’t they protesting?
Maybe they have bigger fish to fry, based on how the Ontario real estate market has performed in the last year…
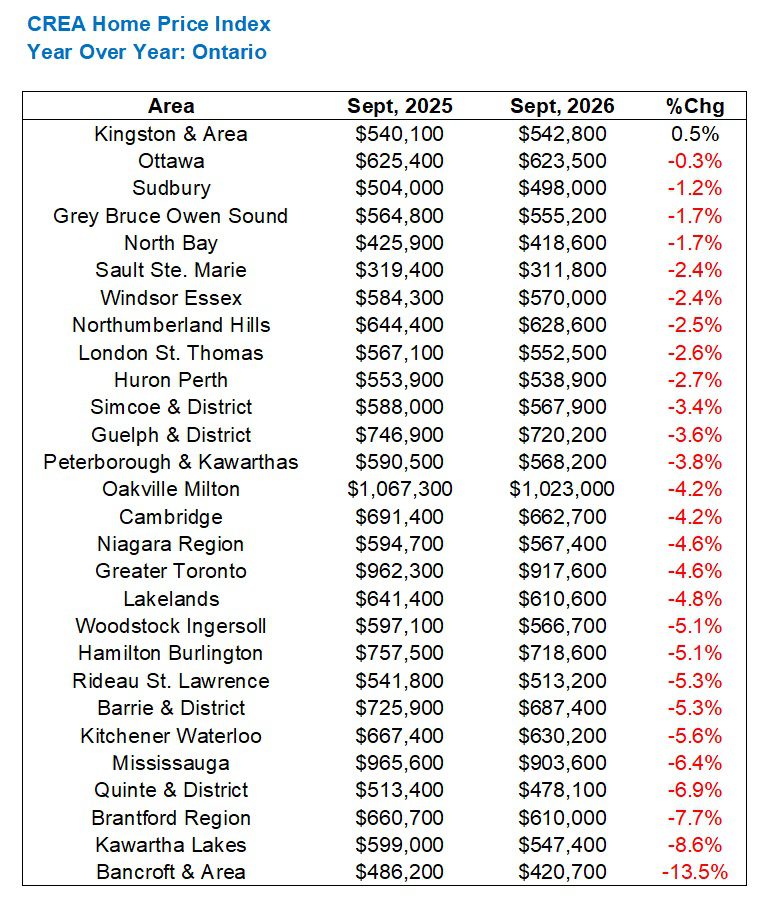
Eek!
Twenty-eight of twenty-nine areas tracked by CREA saw a decline in Home Price Index in 2026.
Only Kingston was immune, and that’s probably because my friend “Bubs” lives there. He’s a good vibe kind of guy, and I think his excessive positivity has paid off for everybody in town!
Seriously though, would any of you have been this bearish?
In 2025, six of twenty-nine areas were in positive territory, but I would have bet that we’d see at least that many in 2026.
Here’s the comparison:
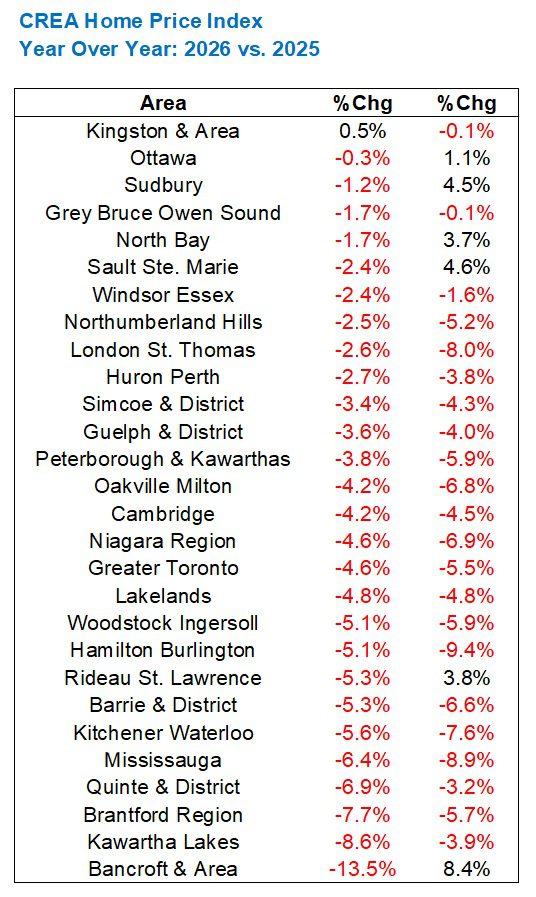
That’s awful. There’s no sugar-coating it.
So let me ask the burning question:
Why has Ontario been hit harder than any other province?
While I’m sure there’s an economic argument to be made here, I’m also interested in the “gut-reaction” answer as well. What’s the non-scientific take? What’s the water cooler answer?
In the meantime, it looks like it’s Happy Hour in Old Quebec…