

For those that don’t know Lord Peter Baelish, then perhaps the title of today’s blog post makes little sense. Pun fully intended.
Somebody told me to watch this show called “Game of Thrones” back in 2012, and I tried. I did. But it was awful. Almost unwatchable.
I tried again about a year later, but once again, I found myself not able to finish the first episode.
Later that year, I tried a third time, and guess what?
I was hooked.
I binge-watched the entire first season one lonely Friday evening while my wife was working an overnight shift, and then I ran out and bought the box set for Season 2 the next day.
Like many Game of Thrones fans, I absolutely hated Lord Peter Baelish. But then again, I actually quite liked him to.
At the very least, you have to respect his constant scheming, do you not?
Well, at least he gave us some memorable quotes…
On Wednesday afternoon, I sat in my office yelling, “Oh My God! Oh My God! over and over and over. This could have been for a seemingly-infinite number of reasons, but after a dozen people asked, “What is it? What’s the problem?” I revealed that the February TREB stats were out, and they were downright ridiculous.
I had made two not-so-formal predictions about the February stats:
1) Average home price would increase by a larger-than-normal amount
2) Average 416 condo price would be up 4-5% in only a single month
But when I laid my eyes on the stats, I was absolutely shocked.
Where do we begin?
The average home price in Toronto (GTA) in February was a whopping $910,290.
For those without any basis of comparison here, let me just say – this is a lot!
This is up 8.5% since January, when the average price checked in at $839,363.
And more to the point, this is the first time we’ve seen a price over $900,000 since the infamous month of April, 2017, when the average home price was at $920,791.
Perhaps we should start there?
We all know about the “peak” in April of 2017, which serves as such because after the government stepped in front of a podium in late-April, the real estate market fell off dramatically. Coming off that $920,791 peak in April, the average home price dropped below $800,000 in June, and it remained there for a full year, until April of 2018, when the price moved back across that $800K threshold and landed at $804,584.
Here’s what’s even more interesting: the average home price remained stagnant thereafter for a full year, never going higher than $808,000.
Since April of 2019, when the average home price hit $820,148, we’ve seen a steady increase, with a peak of $852,142 in October.
Then February happened.
And suddenly we find ourselves at a whopping $910,290.
I still can’t quite wrap my head around it.
From $839,363 in January to $910,290 in February – an 8.5% increase, is incredible.
Just how incredible?
I decided to look back at the top twenty month-over-month increases since January of 2012, and this is what I found:

The 8.5%, month-over-month increase that we just experienced from January to February represents the third-largest increase in a period of ninety-seven months, dating back to 2012.
But as you’ll clearly see, the top five months are ALL the month of February.
What does this tell us?
Well, I suppose it undermines that “huge” 8.5%, month-over-month statistic that I was just touting.
It looks as though February is, historically, a huge month for big month-over-month gains, since all nine years from 2012 to 2020 are present in the “Top 20” list above.
Perhaps this is because January is slow, or perhaps it’s because February is busy. Either way, I think it takes just a little bit of the lustre off our “huge” month.
I would be remiss if I didn’t also mention that of the 97 months examined, 41 months saw a decrease in month-over-month price, and 56 months saw an increase. So let’s not forget, prices go up in the long-run, but the market is cyclical. About 40% of months do see a decline from the previous month, and I would assume the usual suspects are July, August, November, and December.
Now the second big stat from February is that, year-over-year, we saw a 16.7% increase in the average home price, from $779,791 in February of 2019 to $910,290 this past month.
Let me run the same stats as I did above, this time for year-over-year, and we’ll look at the top-20:

This time around, the month of February, 2020 is “only” 11th on the list, but what do you notice about the months above?
Included in this list are: June, August, September, October, November, December, January, February, March, April – every single month, save for August, from June of 2016 to April of 2017. That is exactly when the market began its ascent.
The rest of the months below February of 2020 fill in the other blanks, ie. the “missing” month of July 2016, the preceding months of 2016 (Jan,Feb,Mar,Apr,May), the “after peak” month of May, 2017, and then one random, misplaced month of June, 2015.
Oh – and of course, January of 2020.
What does this tell you?
Well, if you’re asking me, I think this says we’re in the middle of a massive surge in prices, and I say this even after the incredible month we just had.
Anecdotally, the start to 2020 feels far busier and far more chaotic than the start to 2020.
On paper, it looks as though we’re trailing 2017, but still following the same pattern.
The condo market was honestly where I saw the most insanity, with 20+ offers on every unit for sale, whether it was a hot loft on Sorauren Avenue or a crappy 1-bedroom on Dan Leckie Way.
While I thought the average Toronto home price was set to increase substantially month-over-month in February, I thought the 416 condo price would probably double whatever appreciation we saw in the average Toronto home price.
Yes, the condo market was that hot in February.
In fact, I believe that it is the condo market that drove price gains in January and February, unlike 2017, when the freehold market was the driver and the condo market was just along for the ride.
So I ran the same stats for the 416 average condo price as above:
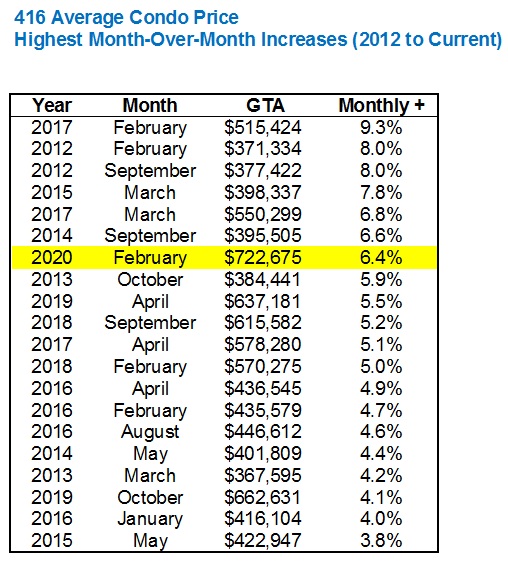
This time around, the 6.4%, month-over-month gain is “only” the seventh-highest monthly gain since January of 2012, and again, we see a pattern in the top figures, notably that the top-seven consist of February, March, and September. No matter how big these numbers are, as with the first chart that I displayed above, there are most definitely certain months of the year where we’re accustomed to seeing larger month-over-month increases, and therefore these must be taken at less than face value.
Note that February of 2017 is leading the way, with March of 2017 also in the top-five. The market in spring of 2017 was that hot! Even though freehold led the way, the condo market was appreciating rapidly as well.
So what do we make of this 6.4% figure in February?
The month of February seems to be the historical leader in month-over-month appreciation, but I suspect that this is going to continue into March. Even if we “only” saw a 3% appreciation this month, that would mean the average condo prices would increase to $744,355, and that’s just a downright crazy number.
This is one of those cases where the “feel” of the market out there (specifically how many offer nights of 20+ offers took place on downtown condos) doesn’t quite match what the numbers show. Then again, if the average 416 home price had only increased by 4%, then we’d be looking at this 6.4% appreciation in condos like it was the Holy Grail, so I guess it’s all relative…
As for sales, they were through the roof.
Up 58,4% over January (4,581 to 7,256), but when we look at the historical stats for the month of February, once again, the trend continues:
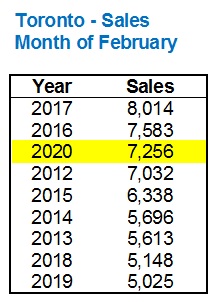
Does this feel like deja-vu yet?
At the top of the list, to nobody’s surprise, is 2017 at over 8,000 sales. Then the maid-of-honour, 2016, makes an appearance.
Tangential to this conversation – look at 2019, wow. I did not expect to see it at the bottom of the list. I certainly don’t remember last February being slow, but I digress.
So in a conversation about hyper-appreciation, with demand (sales) going up, can we assume that supply (listings) was low?
Yes, we can.
Have a look:
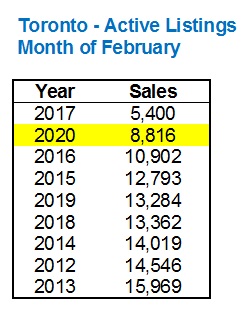
Oh, yup, there’s 2017 again, at the top of the list!
And this time, February of 2020 appears second, well ahead of 2016.
With an average of 12,121 active listings in the nine months of February from 2012 to 2020, we can simply not under-state how low 8,816 listings this past month truly is.
So for those playing along at home…
Active listings were the second-fewest in nine February’s.
Sales were the third-highest in nine February’s.
Is it any wonder why the average 416 home price is up 8.5% month-over-month, and 16.7% year-over-year?
Last but not least, I want to talk about the “gap” between detached and semi-detached homes.
You would think that as prices rise, the gap would widen. But in fact, it’s the opposite.
In January of 2017, the average detached home price in the 416 was $1,336,640 and the average semi-detached price was $902,688. That meant if you purchased a semi-detached home for $902,688, you would have to pay 48.1% more to obtain a detached home.
This figure peaked at 50.1% in July of 2017 when the average detached was at $1,304,288 and the average semi-detached was at $869,227.
Here’s a look at the two averages plotted together:
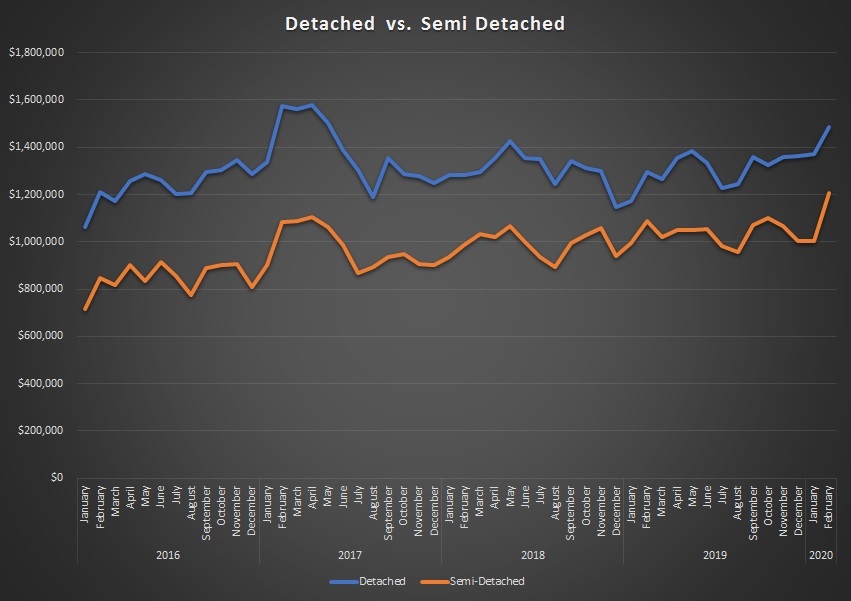
Don’t worry if you’re eyesight isn’t what it used to be, I’ll save you the trouble: the gap in February of 2020 was a mere 22.9%.
The average detached home price in February of 2020 was $1,485,304, still 5.9% below the peak of $1,578,542 reached in April of 2017.
The average semi-detached home price in February of 2020 was $1,208,073, which is 9.4% above the previous peak of $1,104,047 reached in April of 2017.
The gap between average detached and average semi-detached home prices continues to shrink as the entry-level and/or first-time buyers put pressure on that segment of the market.
February of 2020 will go down as one of the most chaotic months I’ve seen in my career.
Do we expect March to be any different?
Arguments could be made either way. Convincing ones too.
But if I were to place a friendly wager with a colleague or a client, I’d bet whatever’s in my wallet that we’ll see further price appreciation in all market segments in March. Even semi-detached, which is just hard to fathom…


Appraiser
at 9:00 am
Great number crunching David.
To add to the 2017 similarities, the sold over asking percentage in February 2020 came in at 57%, second only to 2017, when it surged to 73%. Thanks to Scott Ingram. https://twitter.com/areacode416/status/1235943905822154752/photo/1
I have to agree that the pattern is very similar to the 2016 market run-up prior to the peak of spring 2017.
Having said that, it has been my experience that patterns rarely run exactly parallel.
With the mortgage stress test set to be modified downward on April 6, and the active listing inventory so low (demand so high?), price increases are inevitable.
Unless of course, there is a recession.
Bal
at 9:45 am
With the strong job market….i don’t see a recession in near future
Joel
at 10:15 am
With mortgage rates dropping like crazy and the stress test relaxing a little (about 4% more qualifying power) I think we are set to break the 2017 highs within the next month or two.
The market is ridiculously busy tight now and I am seeing more places sold via bulky offer in 2-3 days from listing than I have in the last several years.
Batalha
at 11:03 am
I would not be nearly so sanguine with regard to the possibility of a recession. Canadian consumer confidence was looking fragile even before the recent Covid-19 induced stock market plunge, not to mention today’s plummeting oil prices brought on by an apparent (Saudi-Russian?) price war, which is almost certain to erode confidence further, particularly in the west. Not to mention the strong likelihood of job losses in the Canadian oil industry and the knock-on effects that would have. Frankly, I’d be surprised if we don’t experience at least a mild recession in perhaps even the next few months.
https://www.bnnbloomberg.ca/rail-blockades-curbed-canadian-confidence-even-before-virus-1.1398709
Appraiser
at 11:51 am
On the bright side I filled up at 95.5 / litre yesterday.
Could also be a much needed paradigm shift in the economy underway. The secret is out that the world is awash with oil and the Saudis can produce it for pennies on the dollar compared to almost everyone else.
Also we may see a permanent shift to work from home for more and more people. Every large corporation is currently putting contingency plans in place in that vein, in order to counter the pandemic. I predict that some of this “work from home stuff” is going to stick and grow, which means a lot less driving in the future.
Oil is so dead.
Joel
at 12:03 pm
It also means a lot less need to be in the city. If you can work from home many will go to where real estate is cheaper and views are greener.
Chris
at 12:05 pm
Give it a few days, you’ll be filling up for substantially less.
Agreed on a few points though; Canada, and Alberta in particular need to modernize their economies. Not sure I would say oil is dead, as there are still millions of ICE vehicles on the roads, and we haven’t found viable alternatives for airline and marine shipping fuels, as well our dependence on plastics and petrochemicals. But simply pumping the black stuff out of the ground is no longer a reliable foundation upon which to build.
More working from home would also be welcome. Not only would it reduce driving and congestion, but could also benefit smaller Canadian communities and ease the pressure on housing and infrastructure in larger urban areas, if you no longer need to reside in one for half-decent job prospects.
Jennifer
at 12:07 pm
sure.
Chris
at 10:26 am
“Unless of course, there is a recession.”
That seems like it is becoming increasing likely.
Between rail blockades, Covid-19 fears, Chinese and Italian quarantines, and oil prices plunging, it’s looking like the US Fed and BoC will be cutting rates before their next scheduled meetings. While even lower rates might provide a very short-term stimulus for housing prices, the overarching economic sentiment has turned decidedly negative.
Derek
at 10:10 am
Circling back to bully offers for a second, someone executed one at 83 Raymond Ave (in my neighbourhood), after the Thursday open house, which my wife went to, but before the Saturday open house. Blocked my wife from making me go see it (thank you, whoever you are!). Listed @ 1.6, sold for 2.0.
Julia
at 10:58 am
I’m sure like most of your readers, I follow the sales prices in my neighbourhood and it certainly feels like spring 2017 to me. The overall increases are one thing, but there are lots of examples to support your stats on the narrowing gap between detached and semi-detached too. My jaw dropped at the difference between 21 Flagman (detached 4 bed sold 7 days ago for $1.5) and 31 Enroutes (end unit freehold townhouse 3 bed sold 5 days ago for $1.4).
JL
at 1:15 pm
I would be interested to see a comparison of condos vs. freehold over time , and see if it is showing the same convergence as the detached vs. semi-detached chart. This would confirm that people are increasingly buying what is affordable to them, pushing those relatively cheaper market segments higher in the process and at a faster rate than freeholds (which had already became un-affordable to many people in the previous run-up and are not seeing the same level of demand).
Prices over time of large condos (2B+) vs. small condos (1B) could also be interested to see, but hard to get accurate data for that one.
Chris
at 1:37 pm
“Canada’s economic outlook has notably darkened after discord among major oil producers has led to an all-out price war that’s sent crude tumbling
“From a Canada perspective, the timing clearly couldn’t be much worse,” Benjamin Reitzes, Canadian rates and macro strategist at Bank of Montreal, said in a client note.
The Canadian economy nearly ground to a halt in the final quarter of 2019, although a rebound was expected this year as temporary disruptions faded. But with the emergence of COVID-19 and its rapid spread throughout the world, the economic outlook has worsened both at home and abroad, and lower crude prices deliver another headwind to growth prospects.
BMO updated its outlook for Canadian economic growth on Friday, projecting that real gross domestic product would decline by 0.5 per cent in the second quarter.
“Unfortunately, the updated forecasts may be due for another round of slicing due to the sharp drop in oil prices and ongoing broader market gyrations,” said Mr. Reitzes.
Bank of Canada Governor Stephen Poloz recently warned of the impact from lower commodity prices.
“Commodity prices are a very important channel for transmitting international shocks to the Canadian economy,” he said Thursday in a speech. “With the oil-producing regions of our economy already stressed, this shock can only deepen,” he added.”
https://www.theglobeandmail.com/business/article-canadas-economic-outlook-darkens-as-price-war-sends-oil-prices/
Meanwhile, south of the border, odds of a recession before the end of Trumps first term have hit a record high of 60%.
Chris
at 7:16 pm
“Rising coronavirus concerns prompted economists to start reducing gross domestic product estimates last week. Monday’s plunge in oil prices is sending them back to the drawing board to consider a much more dire situation. The country’s five largest banks will release updated forecasts in the next few days that will show a significantly weaker growth picture.
“It’s very possible that Canada in the first half of the year has no growth,” Beata Caranci, chief economist at Toronto-Dominion Bank, said in a phone interview. Besides the shock from lower oil prices, the financial market pressures and confidence impacts from coronavirus are “quite a lot to bear” if sustained, Caranci added.
The oil crisis could be the last straw for the Canadian economy which was already on soft footing at the end of 2019, after a drop in exports and business investment resulted in the slowest quarterly pace of growth in three years. Now the oil shock has created more downside risk.
Some economists are even flirting with the idea of a recession.
“Given market developments in the last couple of days, the likelihood of a recession has increased dramatically,” Jean-Francois Perrault, chief economist at Bank of Nova Scotia in Toronto, said by phone.”
https://business.financialpost.com/news/economy/oil-price-plunge-stokes-fears-of-a-recession-in-canada
condodweller
at 4:51 pm
Great update thank you!
I suspect the .05% interest rate drop along with the ease of the qualification rules helped achieve this run up. I’m also guessing that FOMO will take hold yet again that potential buyers will no doubt be concerned about ever increasing rices yet again.
It’s interesting to see that my theory of lower end types of housing is pushing up against freehold homes. Hopefully there will be 1 bed units sold in the buildings I watch to confirm this trend.
I’m also curious to see if number of listings will increase into the price increase as it did in 2017 for condos.
Jimbo
at 5:33 pm
Would you say a house or Condo sold in January 2020 is worth 8.5% more now than when it was purchased?
Geoff
at 5:39 pm
An average price is a far cry from a specific unit. Your question is exactly what the post above answers, in terms of averages. However, all real estate is local.
Professional Shanker
at 7:53 pm
Spectacular post, according to David we should ignore the increase just like we were told to ignore the drops in 2017.
How real estate prices and volumes respond to the virus and panic around the world will certainly be something to observe, I can’t fathom it not having an impact, no clue how this plays out.
Sirgruper
at 12:19 am
Unless with low interest rates and investors pulling out of stock markets and getting no returns on interest bearing investments and governments flooding the economy with liquidity, it just keeps rising.
Professional Shanker
at 9:27 am
That is certainly one side of the equation, the other being lower GDP causing job losses, etc.
Interest rate drops in anticipation of reduced economy activity hasn’t historically translated into higher RE prices, albeit 2015 was an outlier but rightly so given that it was more specific to oil prices not a potential global recession.
Clifford
at 8:06 pm
A recession is going to change everything.