

So, how was your long weekend?
And how long was it, pray tell?
Raise your hand if you saw the Thursday statutory holiday as an opportunity to take a four-day weekend? I’m not judging here, I just suspect there will be a lot of hands raised!
I had a nice little Canada Day with the family and it was a busy one! As I explained to friends and clients alike, “I’m basically in a day-long three-legged race,” because I was stuck to those kids like glue!
Guys – tell me if you can relate to this. When you’re at the park with your wife’s friends, do you find that she merely assumes you’ll hit it off with the other dads? I mean, maybe I’m anti-social, or boring, or both, but I don’t think we can simply assume that because we’re guys, and the other dads are guys, that we’ll immediately start talking about hockey, or cars, or steak, or power-tools, and then start laughing and fist-bumping.
I mean, maybe you feel like all Canadian hockey fans should cheer for the Montreal Canadiens in the Stanley Cup playoffs, and the other dad thinks that all Leafs fans have to hate other Canadian teams. Who knows, right? Maybe you talked about this? Maybe you failed to find common ground? What if there’s like four other dads and they all want to talk about cannabis stocks but you don’t care?
Also, does your wife tell you to change what you’re wearing before you go to the park? What’s wrong with wearing Under Armour jogging shorts and an “IRELAND” t-shirt with sockless running shoes? That says, “I’m a dad,” right?
My wife took one look at what I was wearing on Thursday and said, “Can you pleeeeease wear something a little nicer?” So I put on a full suit and said, “Is this better?” She did not find that amusing in the slightest…
Thankfully, Friday was a “work day” and I got into the office at 8:45am to drink my Tim Horton’s coffee and search for new listings……………….of graded 1920’s hockey cards!
Kidding, kidding. Sort of. There were very few new listings on MLS on Friday but it gave me an opportunity to catch-up on that “punch list” that never goes away, as well as sit down to look at a data set that I’ve been dying to dig into!
The problem with these statistics-based blog posts is that they take forever to write.
Not the writing per se, save for the “folksy intro” that 12.28% of readers skip, but rather the data entry and analysis.
Case in point: if I wanted to know how many listings in a given week, in a given area, were holding back offers, I have no choice but to read the MLS description (and often look at the listing history) to find out.
Since May-24 weekend, I’ve been thinking about a blog post that compares the current market climate to the market months earlier. Specifically, I want to know how many properties are being listed with offer dates, how many of those are selling, how many are being re-listed higher, and how many of those strategies are working.
So on Friday, I turned on some Our Lady Peace, sat down, and started inputting data…
I decided to compare April to June.
For reference, the overall Toronto market has had upward momentum from essentially the start of the year. I suspected, post-May-24, that the market would slow, partially due to buyer fatigue, partially due to an increase in listings, but also because there have already been record sales to start the year and at some point that has to end.
We saw the average 416 home price increase as follows:
January: $866,331
February: $995,201
March: $1,083,322
April: $1,088,021
May: $1,116,736
Every single month, the 416 average home price increased.
GTA-wide, we saw a modest drop from March to April, but overall, prices increased throughout the year.
The point I’m making is this: the market has been nothing but hot all year. Prices rose, sales set records, and whether you were in the market, or just standing outside and looking in, you’re aware that Toronto real estate is on fire.
But how long can it last?
And has the party officially ended, without us knowing?
The June TRREB stats won’t be released until the end of next week, and even if the average home price remains the same, and sales are at or near an all-time high for June, it won’t answer the question as to how real estate is being sold, specifically freeholds.
I decided to look at the third week in April and compare it to the third week in June.
I also decided to look at E01, E02, and E03, which is predictable for those of you regular readers, but it’s also my go-to in terms of a “market snapshot” since it encompasses entry-level houses as well as middle-tier, and the odd luxury home.
First and foremost, let’s simply look at the number of new listings and the percentage of sales:
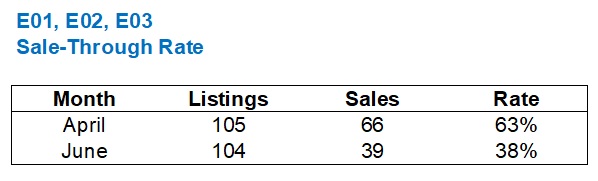
This data could be misleading since not all properties that are listed in Toronto will sell right away. It’s fair to assume that more properties listed in April will have sold by July than those listed in June.
But what about the strategy in selling?
How many properties listed in April versus June had a “holdback” on offers?
Here’s the answer to that question:
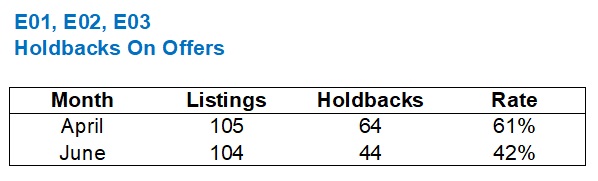
That tells us a lot!
It tells us that the market has changed significantly in terms of how sellers and agents plan to sell.
This change always happens gradually as the market can change overnight, but rarely does. Agents and sellers are usually slow to adapt, so my ‘feeling’ about the market slowing after May-24 weekend may be true. Perhaps it took a week, then another, and then another after that, for sellers and agents to change strategies. With 61% of listings in April coming out with a “holdback” on offers, compared to only 41% in June, it tells us with certainty that the strategies were different.
So how many of these listings were terminated?
And why are we asking this?
My thesis is that back in February, March, and April, more houses were selling on offer nights, or through bully offers, and fewer listings were being terminated after a “failed offer night.”
Here’s the termination rate for those listing periods:

Now, why can a listing be terminated?
On the one hand, you might list a property low, hold back offers, not sell on offer night, and then terminate to re-list with a different strategy. But you also might terminate a listing that is stale, say, after 30 days.
So in order to investigate my hypothesis, I’ll have to look specifically at the properties which had a holdback on offers, and which of those were terminated:

Once again, we have undeniable evidence that the market has changed.
Only 19% of those listings in April which had a “holdback” on offers were terminated, compared to a whopping 41% in June.
You could try to argue that not all of these terminations were for “failed offer nights,” but what other reason would there be? If you’re priced at $999,900 with an offer date, and then you terminate the next day, it means you didn’t sell. Hard stop. I only bring this up because a colleague of mine, looking over my shoulder, just did. And I told her that made no sense, so now I’m telling you.
Alright, so what percentage of these properties with a “holdback” on offers actually sold on offer night?
This is surprising:
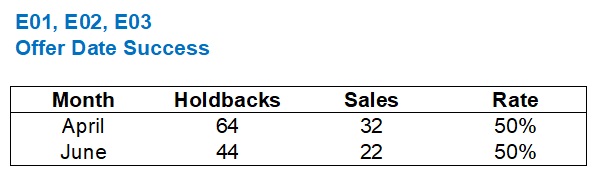
Wow!
The same percentage? Half for each?
Yes, and if you feel that’s confusing, based on the much higher rate of terminations in June, there’s a reason.
How else could a property, for which there is a “holdback” on offers, sell?
Any ideas?
What about via bully offer?
How does that data look?

Ah!
So 27% of those 64 listings in April with a holdback on offers sold before the offer date, meaning that 77% sold either on offer night or through a bully. If you continue to do the math, add in the 19% that were terminated, and that leaves 4% that remained on the market.
In June, we saw half the number of successful bully offers!
That’s only 54% of properties listed with a holdback on offers selling via bully offer before the listing date or on the listing date.
Without a doubt, the freehold market in June has changed since April.
As for the properties that were terminated, what happened?
Well, there are essentially three options:
1) Re-list higher. If you were at $899,900 with expectations of $1,200,000, and you only got two offers on your “offer night,” the highest of which was $978,000, you’re not selling. So you’re probably re-listing at $1,199,900 the following day.
2) Re-list lower. Some sellers elect to take another kick at the can. If they didn’t get the response they wanted by slightly under-listing, maybe they go for broke and drastically under-list?
3) Don’t re-list at all. Goes without saying.
Let’s look at the properties that were re-listed higher:=

Way more properties in June, than April, failed to sell on offer night and were then re-listed higher.
This comes as no surprise, based on the data above.
As for those re-lists, the “strategy” worked in April, but not so far in June:

Again, the third week of June ended merely two weeks ago, so one of these properties that were re-listed higher in April has had a much longer time period in which to sell than those re-listed in June. But we typically see this “strategy” of re-listing higher after a failed offer night bear fruit merely days after the re-list.
Now, what about the other side of the coin?
What about re-listing lower?
I think this is stupid, FYI.
You’ve listed at $899,900 with a target of $1,200,000. You get two offers on your scheduled offer night, and the highest is $978,000.
So you then re-list at $749,900, thinking that more buyers will see the listing? Right?
I don’t like this at all. I think it’s ridiculous. I think the buyer pool has to be really unintelligent for this to work.
So how many times did we see this in April versus June?
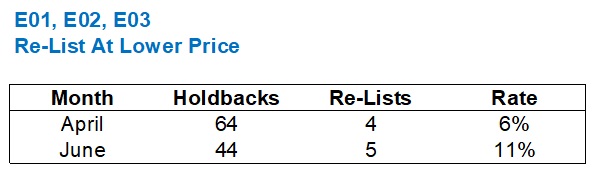
That’s fair. It happened more in June, percentage-wise, because it was a tougher market, and listing agents and sellers were grasping for straws.
How well did it work?

Very well in April, it seems.
Not so well in June, I might add.
–
So let’s regroup here.
In the third week of June, compared to the third week of April, we saw a virtually identical number of properties listed for sale on the east side. That could be a coincidence or it could be a trend. We’ll know when the June TRREB data is released next week.
In June, fewer properties are being listed with an offer date.
However, the same percentage of properties are selling on offer date, in June, compared to April.
The big difference, however, is that far more bully offers were accepted in April, thus resulting in more properties selling before/on the offer date in April compared to June.
More properties are being terminated and re-listed in June, versus April.
But the success rate of properties being terminated and re-listed, both higher and lower, was higher in April.
Overall, I’d say that the market hasn’t quite “cooled,” however the way houses are selling has certainly changed.
With any change comes opportunity.
For those buyers out there who plan to be active in the upcoming summer market, it’s important to identify that change as early as possible and then take advantage of it as soon as possible too…


Bal
at 8:56 am
I feel market is picked up again …..Not sure what happened middle of the June but I am seeing multiple offers again. Or may be the house i am interested in getting multiple…lol ….lol..Now i am convinced that this Market will never slow down…or prices will never correct…it is sad but that is the reality…I also don;t think the Bank of Canada will ever increase the interest rates…once Covid is over they will find some other excuse to keep interest rates low…it is been going on since 2009
Appraiser
at 10:37 am
“In the average year between 1976 and 2011, there were 67,000 households formed and 65,000 home completions. Not identical, but pretty close, and the two series move in tandem relatively well…
That has not held true, however, since the population started growing in 2015–16:
Over the past four years, Ontario built 100,000 fewer homes than it should have, given our population growth.”
https://mikepmoffatt.medium.com/ontarians-on-the-move-2021-edition-16-housing-demand-and-the-growth-in-the-number-of-households-54e3706ebf84
Bal
at 12:56 pm
maybe now Ontario has more investors compare to pervious years. so Inventory never going to be enough….they will be grabbing it …
John Doe
at 12:44 pm
For the record, I never read your “stat” blogs. Can imagine many do. I skip to the last few paragraphs and read from there to see if there’s anything interesting.
Daniel
at 2:02 pm
These are the blogs I enjoy the most. Just goes to show that there is something for everyone I guess. I’m not sure I see the upside of critiquing our host in this manner, IMO. Perhaps if he’s looking for feedback on topics or categories.
Condodweller
at 1:03 pm
If someone relists with a lower list price wouldn’t that catch more buyers and also extend the time period during which new buyers can also enter the picture? I think it makes sense to some degree. Probably in this market where it’s not as hot as before but still strong.
Appraiser
at 3:57 pm
CMHC changes underwriting practices on mortgage loan insurance:
https://www.ctvnews.ca/business/cmhc-changes-underwriting-practices-on-mortgage-loan-insurance-1.5497079
Appraiser
at 9:47 am
TRREB y/y sales data for June released today:
Sales up +28.5%
Active Listings down -19.3%
Average price up +17%
HPI price index +19.9%
With sales up and listings down, upward price pressure remains constant.
Bal
at 9:49 am
Appraiser-Are you comparing with last year or last month? i read sales and price are bit down compare to last month and yes listings are down too
Appraiser
at 11:48 am
Year over year or y/y.
Bal
at 12:03 pm
yes i realized …lol