

I was in the office last Monday night while a colleague of mine was reviewing offers on his west-end rowhouse.
Listed for $1,399,999, he figured that the house had $1.7 Million upside.
I didn’t see the house in person, but a client of mine reached out and asked what I thought it would go for.
I said that I felt it was a $1,550,000 – $1,600,000 house, but told him that my colleague from the office anticipated that it would go higher.
My client said, “No offence, but I hope your colleague knows more about real estate than you! The higher, the better!”
On Monday night, my colleague received seven offers. I figured this was a slam dunk.
But when I saw him in the kitchen at the office, he looked at me, puffed out his cheeks, and said, “Fuuuuuuuck!”
“Five of the seven offers are at $1,450,000,” he said. “The other two are shit.”
Before I could respond, he said, “Actually, all seven are shit. This house is worth way more.”
He told me that many of the agents were saying, “This is just my client’s first offer,” so he was optimistic that they would improve. But when the improved offers came through, four of the offers were below $1,500,000.
Why is that an important number, you ask?
Because the CMHC extended the mortgage insurance ceiling from $1,000,000 to $1,500,000, so there are a lot of buyers out there today who can’t go over $1.5 Million.
Four buyers came up to exactly $1,499,999.
One went over $1,500,000.
But the seller refused all seven offers and elected to re-list.
My colleague said, “I don’t get it. Where is the market? You give me this listing six weeks ago, I think I’m getting $1,650,000 in my sleep.”
I told him, “This happens every year in June. And we all get amnesia and question the market. The reality is, we’re in June, and most buyers bought in January, February, March, April, or May.”
My colleague thanked me for the explanation of how the Gregorian calendar works, then said, “You’re missing one thing.”
I asked what that was, and he said, “I got seven offers! So how can you tell me that everybody has already bought?”
Good point.
Perhaps the market is still alive and well?
If we were to look at the “spring market,” which runs from January through June, what would you expect the peak month to be?
I’ve run the data from 2002 through 2025, and it looks like this:
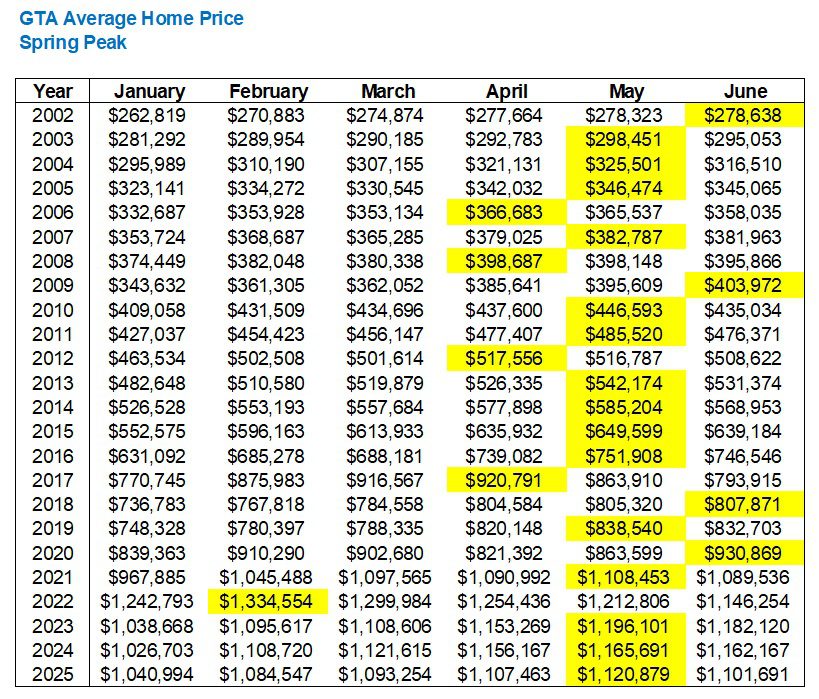
May has represented the peak fifteen times in this twenty-four year period, and save for 2022, the other peaks are all bookending the month of May.
We’ve seen the peak hit four times in each of April or May, but suffice it to say, if you were betting on a peak month, you’d go with May.
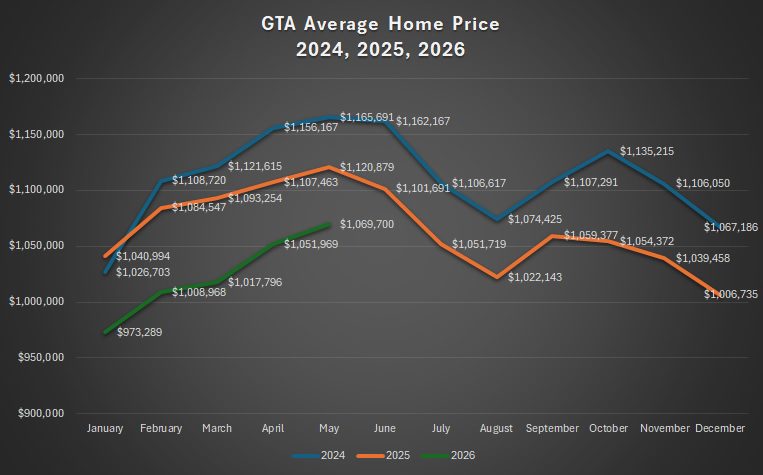
It should come as no surprise that the average home price increased from April to May as a result:
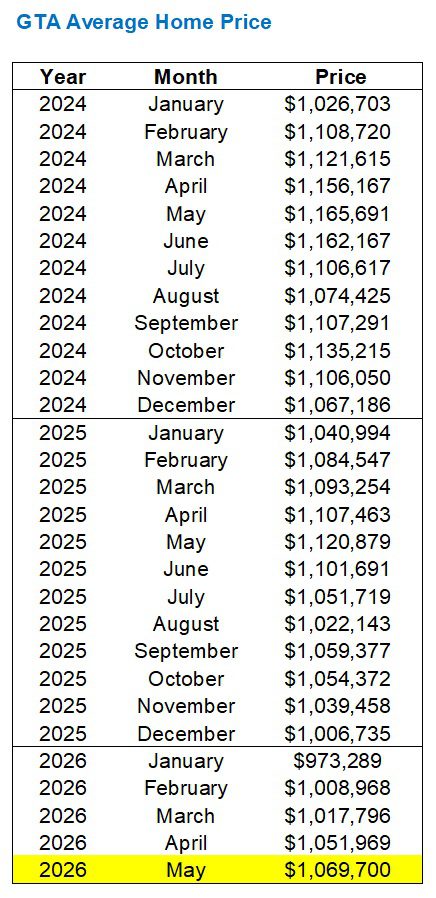
That’s a modest 1.7% increase from April, but an increase nonetheless.
We’ve seen the average home price increase every single month so far this year.
But again, you would expect that to happen.
We previously noted that the “peak” has come in May fifteen times in twenty-four years.
So is that 1.7% increase in line with the historical trend?
Well, consider that we saw significant market declines in each of 2008, 2017, and 2022.
If you were to asterisk those years, you’d only see 2006 and 2012 as years when the average home price did not increase from April to May:
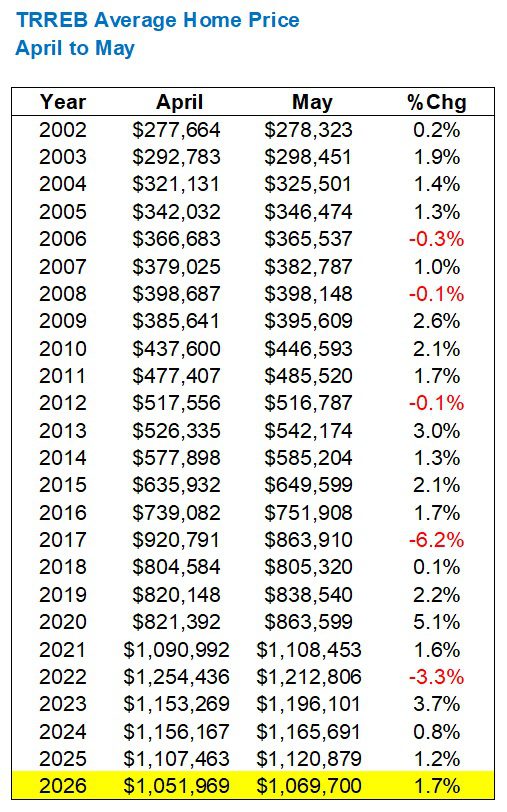
That 1.7% increase is slightly ahead of the twenty-four year average, which is 1.1%. It’s also ahead of 2024 and 2025, but here’s my honest take:
I would have expected the average home price to top $1,080,000 last month.
That’s based on a number of things, some objective, some subjective.
First, I would point to the historical trend. May is a hot month.
Second, I would look at how slow January and February were this year.
Third, I would offer my vibe-check for the market last month, which is to say that May was big.
So while we did see an uptick in the average home price, it was well below my expectations.
As for the year-over-year comparison, we’re continuing to see the gap between 2025 and 2026 narrow:
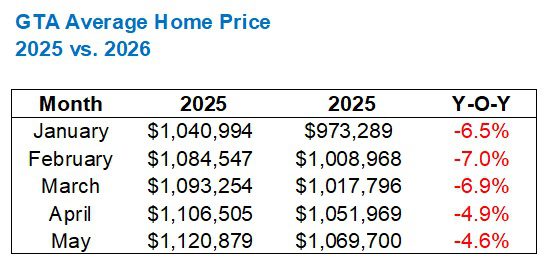
Again, the difference between -4.9% and -4.6% is marginal, but it’s part of an overall trend.
Prices are still well below 2024 and 2025, however…
How this translates by geographic region is as follows:
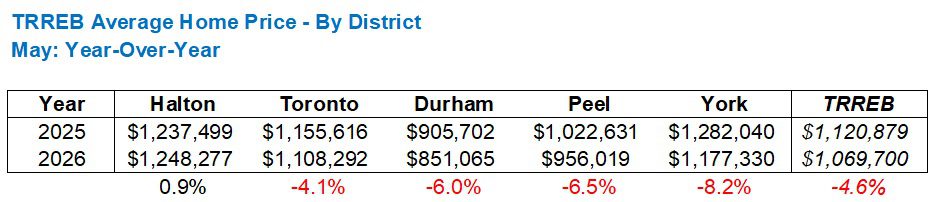
There’s something in the water out there in Halton, eh?
In reality, I think you’d be hard-pressed to find a house in Halton that’s worth 0.9% more today than it was this time last year, but that’s the fun thing about statistics, right?
The rest seems about right to me, as I would expect the 416 to lead the pack, and York to trail. Durham Region has been really tough so far this year too.
In terms of sales, we did see 6,583 sales in May, which is up 10.7% from April.
However, those 6,583 sales are still very, very low for the month, if we’re comparing to previous years…
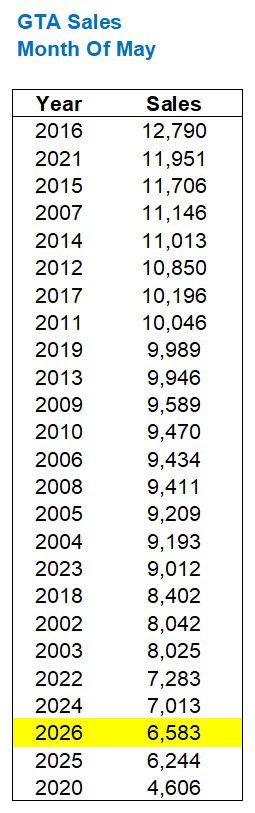
Let’s not forget that 2020 was during the pandemic, so that figure gets a special red flag.
We’re barely outpacing 2025, which, if you recall, saw the fewest sales this millennium.
Here’s an update on that, by the way. I’ve been tracking this all year:
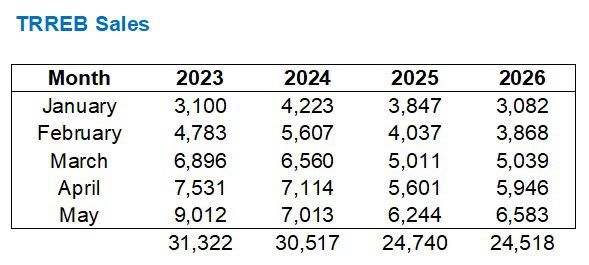
Sales were up over 2025 in May, so the gap between 2025 and 2026 has narrowed.
But we’re still statistically on pace to see fewer sales in 2026 than in 2025, which would be just downright shocking!
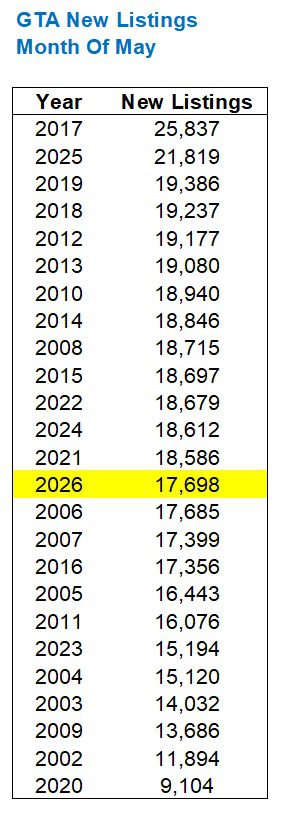
As for inventory, we saw new listings increase by 5.1% from April to May, which is well below the historical average of 10.7%, and below the respective April-to-May increases over the last three years: 33.7% in 2023, 10.9% in 2024, and 15.8% in 2025.
That puts last month’s figure mid-pack:
This brings us to a very important statistic, which is one that many believe signals a “buyer’s market” versus a “seller’s market.”
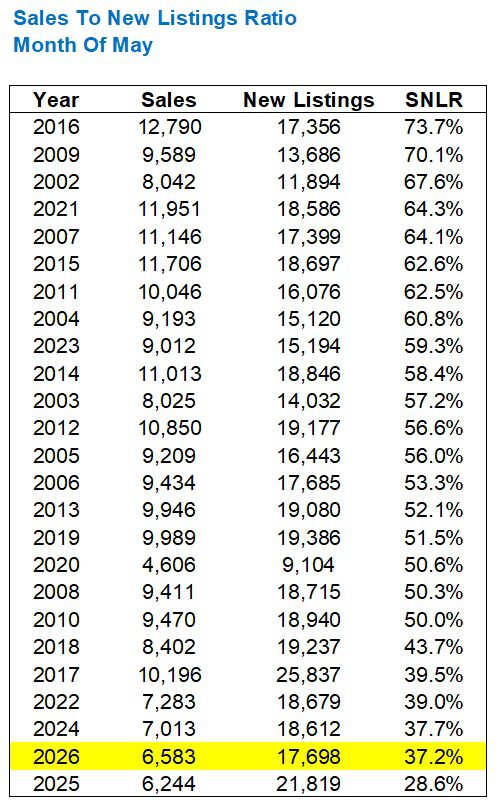
Here is the sales to new listings ratio for May:
Ah, right.
There’s last month, sitting second from the ocean floor!
While that 37.2% SNLR is significantly higher than the 28.6% figure we saw this time last year, it’s still, well, second from the ocean floor!
“Mid-pack” is 56.0%, which signals a seller’s market.
In fact, just about every month of May has represented a seller’s market, outside of our post-2022 peak.
Now, as for how this looks by geographic region:
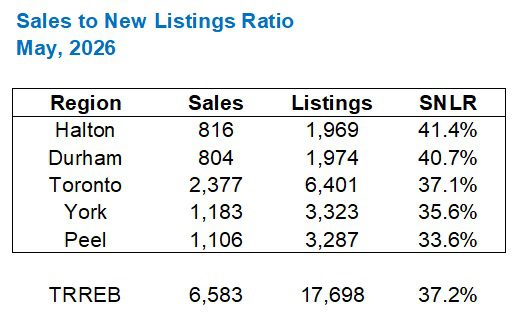
Not really what you’d call a “needle-mover” there, but it might explain why prices are up on a year-over-year basis in Halton. The Durham statistics sort of throw that theory out the window, but I digress…
Every year, scores of sellers prepare to list their houses in June because “the weather is great” and “the gardens look lovely!” And every year, new listings peak in June, sales decline, and prices decline along with it.
I believe that June will be a ho-hum month as we creep toward the finish line in the 2026 spring market, and I expect oh-so-many people to get a head start on summer, putting the real estate market on the back burner. After the miserable winter we just had, I think “early summer” is sounding pretty darn good to most people in this city…


Serge
at 9:05 am
I have always wondered: if there is such a thing as the “organic demand for housing” (i.e., without “investors”) in a city with a given population and median income? If so, one could compare this indicator against monthly data feed.
Moonbeam!
at 9:41 am
Well then it’s good that I listed and sold in May!
Moonbeam!
at 9:42 am
Well then it’s good that I listed and sold in May!
LLoyd Mosby
at 11:31 am
Good post. The stats back up the argument that for “the average house” its better to list in May even if the gardens aren’t ready. If the house gets stuck through the summer, it will require a price cut for fall and be looked at as stale. Attractively priced in prime lot/hood, doesn’t matter.
Ace Goodheart
at 11:41 am
The appraisals seem to have been “re-set”.
Not entirely sure why. Banks don’t seem to be accepting that houses that used to sell for 1.6, are still going to sell for 1.6. There seems to be more caution now than there was back in the heady days of COVID when you could appraise any falling over pile of rotten brick for anything you wanted to offer.
The pre-approvals also seem to be lower than they were. Again, not understanding why unless the banker head honchos know something we don’t.
I have seen several pre approval letters and they are light, man. So light.
People can’t bid to 1.6 anymore as they can’t pay 1.6. Someone is turning off the taps at banker land.