

Here’s an interesting proposition for you…
There’s a downtown condominium that has a suspect history, but which now has a clean bill of health. The sale prices in this building have been significantly impacted as a result of the “stigma,” but the rental prices have not.
Let’s say that a 420 square foot, 1-bed, 1-bath in this building sells for $440,000 and rents for $1,650.
Now let’s say that a comparable unit across the street in a different building, without that poor track record, costs $525,000 but also rents for $1,650 per month.
Which property do you think is the better investment?
The answers would probably be split 50/50 on this one and for good reason. I understand risk tolerance, believe me. I see it every day. I have sold three of these units so far (I have been tasked with selling a good number of them, one at a time…) and some buyers see the massively discounted price as an opportunity, while other buyers see it as a red flag. On the optimistic side, you know that there are a couple more kinks to work out in the condominium’s status certificate before the building is completely clean, and once that happens, more buyers will flock to the building, and the prices will rise. On the pessimistic side, you’re weary of the building’s track record, but more importantly, you feel “safer” buying in a building with more established prices.
Established prices? Doesn’t that mean “higher?”
Yes. It’s a double-edged sword, is it not?
Last year, my team listed over thirty condos for lease which was about triple the volume we usually handle. It’s not that we were going out of our way for leasing business, but rather so many condo owners either needed to find new tenants, on account of losing their tenants due to the pandemic, or decided not to sell, but rather rent – also because of the pandemic.
So far this year, I’ve only listed five or six condos for lease. It just seems to be where the market is going.
But does the overall market data back that up? Or was it just our clients that seemed to be leasing out units?
As an agent, this market can always keep you on your toes! You never know what’s around the corner.
So let’s take a look at New Listings for downtown condominiums, and we’ll use the same chart that we’ve been using since last year, simply filling in the missing months.
When we left off in March, we were coming off a month of February that saw a decrease in new lease listings from 2020. Only 1,710 new listings compared to 1,952 in 2020, which was downright shocking to me.
Did the trend continue?
Nope. Not even close:

New condominium lease listings skyrocketed in March and April, up 43% and 40% respectively from 2020.
You might be tempted to say that the pandemic caused a decline in listings in those 2020 months, but look at the numbers: both March and April of 2020 were way, way ahead of 2019.
What I find quite odd is the 6% year-over-year drop in May. From 3,256 new listings in May of 2020 down to 3,050 this past month. It’s not like new condo lease listings skyrocketed in May of last year. If you look at the data, you can see that they went berserk in June, with over 4,000 new listings for the first time, and they pushed 5,000 into October.
So why the decline in May?
Your guess is as good as mine.
I much prefer the graphs for this data as it paints a perfect picture of what’s happening in the market:

Look at that 2020 line!
I said above that we saw over 4,000 new listings in June and this continued through the fall, but even when listings declined substantially in December, they were still way, way ahead of 2018 and 2019.
Where do you see that yellow line going as we move into the summer months? Is it possible it can push higher than 2020?
As for condos leased, let’s take a look at the data:

April is an odd month, since the pandemic was full-blown at that point and few people seemed to be saying, “Hey, I think now is the time to move into a downtown condo for lease.”
We saw a mere 640 downtown condos leased in April of 2020, thus an absurd 293% year-over-year increase.
Nevertheless, even if you look at March, or May, you see that the number of condos being leased is doubling what we saw in 2018 or 2019.
Any idea why?
It can’t be because there are more listings.
We can’t simply assume, “If more properties are listed for lease, more people will lease them.” It might make it easier to lease; having choice, and all. But at the heart of the massive increase in the number of properties leased has to be the fact that more people are living downtown.
But what about the work-from-home movement, and the mass exodus from downtown Toronto? Weren’t we led to believe that nobody wanted to live downtown anymore?
This chart says otherwise:

Even if you take the pandemic year out of the equation, 2021 is ahead of the pack.
Wait, which colour line is the pandemic year? Does it matter? They all start the same, end up the same in February, and are pretty much aligned in March. It’s not until April, when the pandemic was in full bloom, that we see a divergence.
And yet, above it all is that yellow line for 2021.
What gives?
Maybe people aren’t leaving the downtown core after all?
As I mentioned above, I feel like June and July will be very telling months in terms of both new listings as well as condos leased. In 2021, this is when we saw inventory increase at never-before-seen levels. So if leasing action doesn’t follow suit, then the absorption rate plummets. And if the absorption rate plummets, then what happens? Prices drop.
I think we’re a good ways away from that happening, but it’s worth noting as we head into the third quarter of 2021.
As for the absorption rate, that’s always the third part of our equation, so let’s take a look:
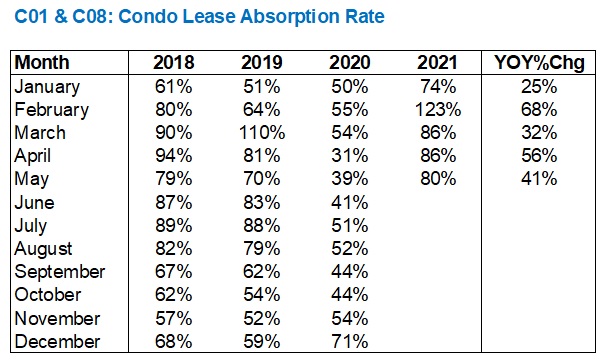
As noted above, inventory dropped in February so that 123% absorption rate isn’t surprising.
While we did see major year-over-year increases in absorption rate, again, we have to take the 2020-pandemic into consideration.
Looking at the month of March, we see an 86% absorption rate, which is absurd when you compare it to the resale market. But compared to the 90% in 2018 and 110% in 2019, it’s actually low.
In April, the same 86% absorption rate also fell behind the 94% recorded in 2018 and the 81% recorded in 2019.
In May, however, the trend turns in the other direction. We saw an 80% absorption rate in May, which is ahead of both 2018 and 2019, which saw 79% and 70% respectively.
It’s tough to say whether or not the absorption rate will climb as we head into summer, but if we start to see 4,000 – 5,000 new listings like we did in 2020, I don’t think this rate is going to climb.
Let’s take a look at the chart:
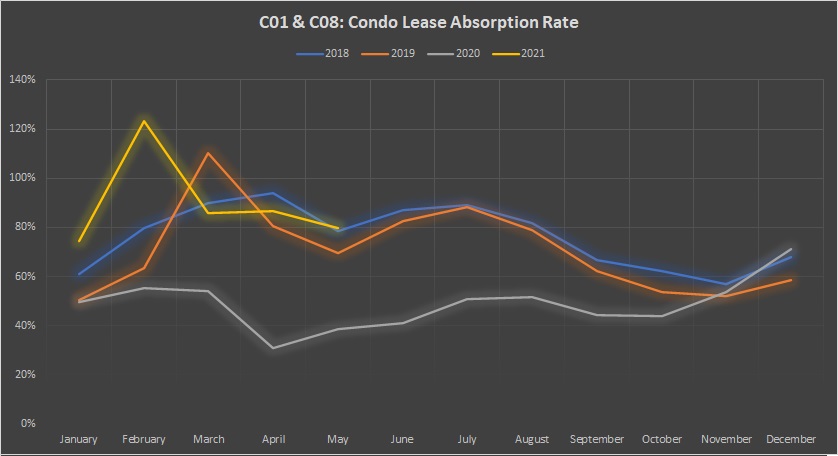
We’re quite accustomed to seeing less volatility in January, as is often the case in November and December.
In fact, if you look at 2018 and 2019, the two lines trace each other quite closely, save for the month of March.
So what was the cause of the spike in new listings last year?
Can we agree that it was almost certainly due to the pandemic? AirBnB owners decided to list their properties for lease, thus flooding the market, and with so many tenants having financial trouble and having to move out, condo investors also listed in droves.
So let’s say that we avoid that 4,000+ threshold from last June through October, and leasing activity continues to increase. What happens then?
Prices increase.
And if I were truly to pick a side on this, that’s the side I would pick. I mean, not necessarily prices increasing, but I do think we’ll avoid that 4,000 – 5,000 range that we saw last year, and I’m seeing leasing activity pick up downtown. So I could see the absorption rate increase, but I think it will be a while before prices respond.
While we look at TRREB stats monthly, this look at the downtown condo rental market seems to be a quarterly feature. So let’s meet here in the first week of September for a refresher. Geez, who wants to talk about September? It’s almost summer. Let’s not think about leaves falling just yet…


Ed
at 8:02 am
If you’re tasked with selling 30 condos in one building is there a strategy to which ones you will sell first or do you sell them ‘willy nilly’ (John Tory term) as whichever one becomes available?
Pragma
at 11:18 am
Isn’t it a safe assumption that in an environment where rents are dropping you would see leasing activity increasing? and the opposite would be true if rents were rising. How are rents doing?
Appraiser
at 9:12 am
Great thread here by Will Dunning on the housing supply problem and the unintended consequences of government intervention (i.e. increasing the mortgage stress-test):
“The government is slightly changing the structure of this game of Musical Chairs, by reducing the number of people who are running around the room looking for chairs that they can buy, but it also will reduce the number of chairs that people want to sell and
increase the number of people who need to rent.
Again, this policy won’t change the total number of people who need Chairs (housing) or the total supply. In the short term, these policies don’t materially affect the Game. But, in the long-term they have made it worse…”
https://twitter.com/LooseCannonEcon/status/1395810375434752008