
There was an article in the Toronto Star on Thursday talking about the “luxury” market in Toronto, which opened the conversation, but my obsessive-compulsive side wants to dig deeper.
In a market like this, speculation and opinion always trump the hard data, and there are too many people out there talking about how hot the market is, without providing evidence.
So because I’m back from a glorious couple days up on a lake, I’m now going to punish myself by combing through TREB archives and pouring over numbers…
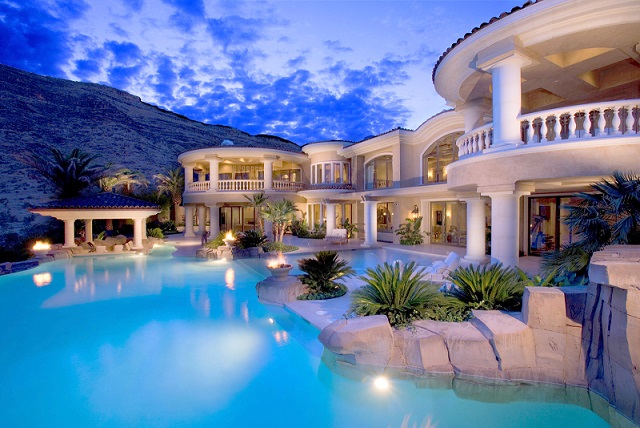
Any guesses as to why I chose that photo above?
Well, I suppose it’s because when you google “Luxury Real Estate,” you find something like the photo above, and not a 1,200 square foot condo in downtown Toronto.
“Luxury” can mean a lot of different things to a lot of different people.
“Million-Dollar-Home” can mean a mansion in one geographic location, and land value in another.
In Toronto, I don’t believe that a $1,000,000 property, in any location, can be considered “luxury.”
In fact, I don’t believe that $2,000,000 represents the “luxury market” either.
At $3,000,000, we’re talking. It’s not luxury, but it’s higher end for certain.
We can debate that if you’d like, but since the first-half of 2016 has now drawn to a close, I’d like to take a hard look at the sales figures, and compare the sales of properties over $1M, $2M, $3M, and $4M to that of the same period last year.
So using January 1st to June 30th, in 2016 and 2015, let’s look at the four categories, and let’s divide each into both “houses” and “condos.”
2015:
$1,000,000+
Houses: 2,881
Condos: 259
$2,000,000+
Houses: 598
Condos: 42
$3,000,000+
Houses: 176
Condos: 17
$4,000,000+
Houses: 61
Condos: 4
Total:
2016:
$1,000,000+
Houses: 3,900
Condos: 344
$2,000,000+
Houses: 961
Condos: 42
$3,000,000+
Houses: 276
Condos: 13
$4,000,000+
Houses: 99
Condos: 6
–
So the very first thing you’ll notice is that there are far, far more houses selling over $1M than condos.
It’s ironic, given the perception out there that “there are so many condos downtown.”
Yes, that’s true. But very few, it would seem, are over $1,000,000. Only 349 sales in the first-half of 2016, compared to 3,951 houses. So there are more than TEN TIMES as many million-dollar houses selling as million-dollar condos.
I think the basic take-away here is that “houses are expensive.” Not to dumb it down too much, but we all know that houses are a scare commodity in Toronto, and a million bucks isn’t what it used to be.
But there also aren’t any 600 sqft houses, or 1-bed, 1-bath houses (I’m sure there are some, but you get my point), and by in large, houses are much more substantial properties than condos, so these ratios should come as no surprise.
So let’s re-organize the above data, and compare houses to houses for the two time periods, to get a sense of what the volume is like.
$1,000,000+
2015: 2,881
2016: 3,900
35% increase
$2,000,000+
2015: 598
2016: 961
61% increase
$3,000,000+
2015: 176
2016: 276
57% increase
$4,000,000+
2015: 61
2016: 99
62% increase
Now keep in mind, of course, that house prices have risen dramatically from 2015 to 2016.
So a $925,000 house in 2015, wouldn’t be in the 2,881 sales that we saw over $1M in 2015, but it would count in the 3,900 we saw in 2016 after the price appreciation.
The average price of a home in June of 2016 was $746,546, compared to $639,309 – a whopping 16.8% increase.
But also keep in mind that sales were much higher in 2016 than in 2015.
In the first-half of 2015, there were 54,298 sales.
In the first-half of 2016, there were 60,368 sales.
Sales were up 11.2%.
So with prices up 16.8% on average, and with the number of sales up 11.2%, the increase in “luxury” sales quite as surprising.
What I do find surprising, however, is the disparity between the 35% increase in sales for freehold homes over $1,000,000, compared to the 61% for houses over $2,000,000, and 57% for houses over $3,000,000.
With an average 16.8% appreciation, sure, I can see why the number of sales over $1,000,000 is up 35%. But when we’re into the 60%’s, it’s not because of appreciation – that’s volume.
Now one last metric to run – we need to compare increase in sales of houses with increase in sales of condos.
The data on the condos is so small that it’s tough to draw a conclusion, but I want to compare just to see where the numbers are at.
$1,000,000+
Houses: +35%
Condos: +33%
$2,000,000+
Houses: + 61%
Condos: +0%
$3,000,000+
Houses: +57%
Condos: -31%
$4,000,000+
Houses: +62%
Condos: +50%
I hate running those condo numbers, since the “number of sales” over $4,000,000 went from 4 in 2015 to 6 in 2016, and thus an “increase” of 50%.
The sample size is too small to draw a conclusion, but in the $1,000,000+ category, where there are more sales (344 and 259), it’s interesting to note that the 33% increase is right in line with the corresponding 35% increase for houses.
In any event, perhaps the only real conclusion here is something to the effect of “real estate is getting more expensive.”
But I think something has to be said of the increase in $2,000,000 and $3,000,000 homes being sold. As I said above, that’s not because of appreciation, that’s just a massive increase in the number of homes.
Is it more baby-boomers down-sizing?
Is the market so good, and so hot for luxury home-owners that they can’t hang on any longer?
I welcome your hypotheses on this…


Paully
at 9:41 am
Wow! That is a beautiful mansion in the mountains!
Joel
at 10:31 am
It would be interesting to see what percentage of the over $2 million and $ 3 million are homes that have been torn down and rebuilt by developers vs the amount that were family homes of boomers downsizing.
Ed
at 8:18 am
Excellent point. I would suspect many in that range are new build infill homes.