
Last Friday, I brought up the topic of “listing and re-listing,” which seems to be real estate’s new plague.
I certainly don’t fault sellers for re-listing their properties at higher prices, when their “strategy” of under-listing, and holding back offers, doesn’t work.
But as May turns to June, and beyond, we might start to see more sellers simply (gasp!) list at fair market value to begin with.
Today, let’s take a sample area of the city, and see just how many properties have been re-listed…

If you’re following the real estate market closely, and have been for the past few years, it’s very likely that you really only care about, or follow, the increase in price.
The increase in the average price of a Toronto home over the last half-decade has been staggering.
With an average sale price of $497,130 in the year 2012, to an average home price of $920,791 this past April, we’ve seen house prices almost double in five years.
But the story doesn’t end there.
In fact, you might call that the conclusion to the real story, if you’re following along closely.
Whether I’m writing my monthly e-newsletter and making note of stats, or penning dedicated blogs on the subject as I did in the summer of 2016, I’m always more interested in the reason for the price increase, rather than the price increase itself, and over the last few years that has come down to simple supply and demand.
Ah yes, supply and demand! Our old friend!
Low supply, high demand, and massive price increases.
What a fantastic relationship the three have.
Just a perfect little economic love triangle.
Last summer, I really started to buckle down and look at the massive decline in real estate inventory, as a cause of the even larger increase in prices.
So much of the uninformed, or uninterested general public want someone, or something, to blame, and hence we started to get stories about foreign buyers, domestic house-hoarders, and people clamoured for government intervention.
But as we noted here on TRB, the decline in listings, combined with the surge in sales, had to be the #1 culprit, foreign-buyers be damned.
The decline in “active listings” was hovering somewhere between -30% and -35% all summer long and into the fall market, and it spiked massively in December when active listings were down 48.1%.
Then the unthinkable came: we saw -49.5% in January, -50.5% in February, and -35.2% in March.
The early spring market (or winter for those who are more sensible than us Realtors…) saw a dearth of listings, and demand seemed to be at an all-time high.
Prices soared, and it wasn’t until April that we started to see things slow.
As I said last week, I don’t think prices have slowed, but the pace of sales have.
The “game” has changed, and the players are learning to adapt, as we discussed in Friday’s blog.
So when the April TREB numbers came out three weeks ago, we saw that “active listings” number go from -35.2% in March, to +3.0% in April.
And everybody breathed a sigh of relief.
“Here comes the 2017 housing market,” people mused.
And yet the feeling out there, among buyers and buyer agents, is that the inventory levels haven’t really changed all that much.
The re-listing of properties is out of control, and I personally believe that it’s a major reason why we saw that supposed +3.0% increase in “active listings” in April.
So I spent the weekend examining a few areas of the city, and looking up each and every listing to see if this listing is truly “new” or if it’s a retread.
What I’ve done below is taken E01 and E02, and tracked every active listing.
I’ve taken the addresses out, but left the price, and added a column for whether the property had been re-listed, and whether it had been increased (or decreased in one case) in price.
Here’s how E01 looks:
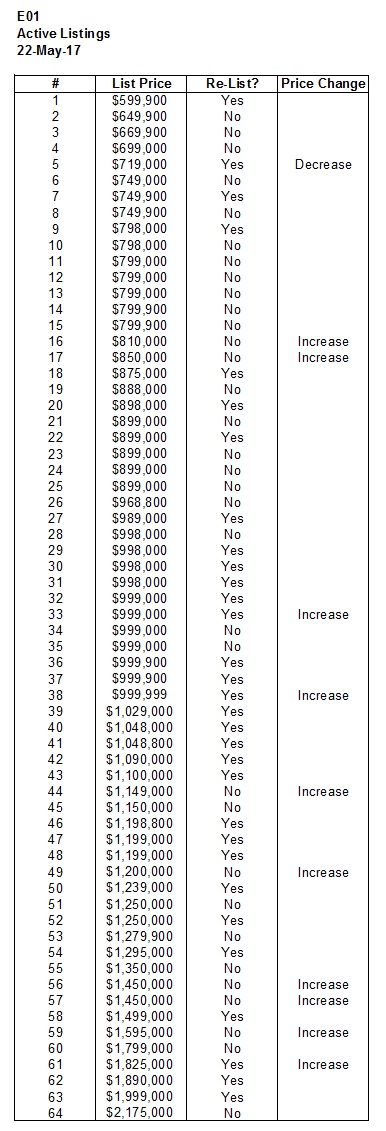
That’s 64 total active listings in E01.
And 31 of them have been previously listed.
That’s a whopping 48% of all active listings in E01 that have been re-listed.
But once you factor in the 7 properties that were not previously listed, but were increased in price, that’s 38 out of 64 listings that have essentially “tried the market” at a lower price before going with “Plan B.”
That’s an even more shocking 59% of all listings in E02 that are on to “round two” of the pricing game!
Let’s look at E02, just to see if E01 was an outlier:
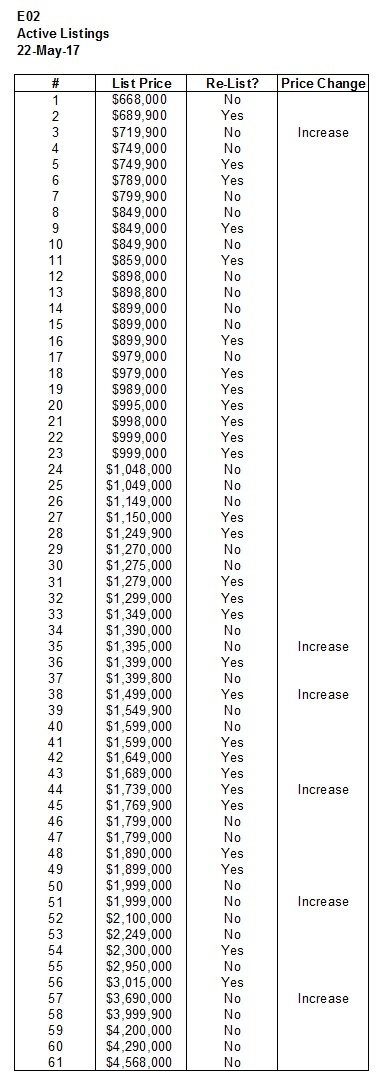
That’s 61 total active listings in E01.
28 of them have been previously listed.
46% of all active listings in E02 have been re-listed.
And again factoring in the 4 properties that were not previously listed, but were increased in price, that’s 32 of 61 listings that have gone to “Plan-B,” or 59%.
Exactly the same number as with E02, so we’re not dealing with an outlier area.
And while I’m sure some areas are different then others, I think it’s fair to say that this is a pattern.
The most interesting take-away from these two data sets is that the clusters of “yes’s” are around the $1M mark.
In E01, there are 17 properties listed between $989,000 and $1,100,000, and 14 of them have been re-listed.
In E02, there are 9 properties listed between $989,000 and $1,150,000, and 6 of them have been re-listed.
This seems, both anecdotally through my own experiences and blog posts, and statistically, to be the area where most properties are being re-listed.
Those $799,900 listings, where sellers are looking for $1,000,000, are consistently being re-listed.
14 of 17 in E01 is an incredible statistic! There’s simply no way to misinterpret what’s going on in this price point.
So let’s now cycle back to my original point about the “surge in inventory,” and where that magical +3.0% increase in active listings came from in April.
If we’re seeing close to 50% of all properties listed for sale in E02 and E02 re-listed, then perhaps this might explain why the surge in active listings?
The question you’re probably asking is, “We know that properties have been re-listed before, so how do the 46% and 48% re-list figures compare to May 22nd of 2016?”
Great question.
And unfortunately, there’s no way for me to track that.
There’s no way to go back into MLS and see what was listed for sale on that particular date.
And any work-around, estimate, or attempt at repeating the date would be questionable, so I figured, why bother?
In any event, we’re two weeks away from TREB’s release of the May data, and that will be very interesting to say the least.
On Thursday, I want to look at four or five reasons for the “strange” month of April in real estate, but in the meantime, I welcome you to draw your own conclusions from the data above…


Ed
at 8:10 am
Someone help me out here.
Although a listing may have been listed and then re-listed does it not only count as one ‘active’ listing?
And lets say this listing and relisting both happened in the month of May. I can see how it would count as 2 ‘new’ listings for the month but at any one time only one would be ‘active’.
If I’ve got this mixed up someone please help me understand.
Mike
at 9:40 am
Active listings refers to the total number of listings that were active, ie, did exist, in that month.
So re-listing would show a new listing, but also a new active listing.
Ed
at 2:54 pm
got it. thanks
Bugeyedbrit
at 9:40 pm
We have seen a shift in the market even on my street in West Toronto, 1 semi was listed low @ 1,100,000 and received multiple offers ultimately selling for just over 1,300,000, yet had k and t wiring, water leaks, old appliances and air con, unfinished basement and needs a whole redo generally.
The owners seemed to time the market perfectly as another semi on the other side of the street was also listed recently, this one was in better overall condition, with a ‘flip’ kind of redo, lots of staging and a better overall look than the previously described house, yet after 4 open houses and numerous viewings, there seems to be little or no interest @ the listing price1,150,000, so now its been re-listed for a touch under 1,300,000, yet is still sat on the market, seemingly going nowhere! I can only presume the owners are fairly set on what they view the house is worth and are willing to sit till they get it (or perhaps not sell at all?)
So either projects that have potential are still exciting buyers (though not sure what upside there is on a 1,300,000 semi that needs a whole lot of work to modernize?), rather than already finished ‘done’ properties or maybe the market turned and sellers potentially missed the boat?
vancouverite
at 2:38 am
The same thing happened here in Van, those properties that needed to be redeveloped/reno’d would sell for higher in multiple offers than those already renovated. I guess it was bidding between developers that stay clear of already reno’d.
Ed
at 8:06 am
My guess is timing. The property that needed to be reno’ed hit the market at the right time and a few weeks later everything changed.
Confused
at 8:50 am
How can a property have a price increase but not be re-listed? What is the price increase relative to?
chT
at 9:32 am
It’s called a “price change”. You list the property at the original price of let’s say $1.0M and after x amount of days you just simply change the price to $1.2M. You don’t terminate and re-list, just change the price.
T
at 1:39 am
Price changes (in mls / realtor land) are used to flag price decreases.
Terminating and creating a new listing for a higher price is – at least given how the current systems are setup – is the correct approach.
Some guy
at 9:42 am
David – This is a very good blog post. Well done.
I live in E1 and pay too much attention to local real estate. I track offer prices in my neighborhood (among other statistics) and – at least for my neighborhood – can confirm that new offer prices (typically through new listings, as opposed to amended listings) is a practice that has increased significantly in frequency the past few months. I see this practice among agents who I consider both high quality and low quality.
My GUESS is that high quality agents are doing this because they have disappointed buyers; they conduct an auction with an “offer night” and the vendor receives no offers or offers that didn’t meet their expectations. The agent then withdraws the listing and re-lists at price that actually reveals the vendor’s pricing expectations.
My GUESS is that low quality agents are doing this because they typically have poorer quality properties to sell, and they are not attracting any (or many) offers on “offer night”. They are inexperienced and are unsure how to advise their vendor clients about how to move a less desirable property, so they propose a “cooling off” period and re-listing (without any explanation for why this will actually work).
All this re-listing activity is likely signalling to buyers that there is uncertainty about the value of properties, and whether bids will be accepted. This dynamic may be creating price discovery problems (i.e., the spread between the bid and the ask is too large), and be causing fewer buyers to be willing to “cross the spread” and pay what vendors are seeking. This results in increased illiquidity (which can’t be observed through DOM, as it is normally done).
Condodweller
at 11:21 am
I think there is going to be a lot of price volatility due to what you describe as the cross the spread as on some still desirable homes people will be willing to cross the spread whereas for other ho-hum properties they won’t. This will also lead to a lot of confusion among both buyers and sellers though I suspect the gap will narrow over time as things settle down.
JCM
at 10:33 am
Re-listing is part of the story, but actual inventory on any given day is way, way up. And, without a doubt, sales are down.
If we look outside Toronto (say Oakville, Richmond Hill or anywhere in Durham Region), the phenomenal shift in the market is even clearer.
crazyegg
at 2:14 pm
Hi David,
Thanks for opening peoples eyes with your insights.
Some thoughts after reading your post:
New Listings is a metric that should be banned entirely. Net New Listings (stripping out the re-listed ones) should be used instead.
Active Listings I think is the best metric to use if you trying to gauge market supply. However, we need to compare with year ago numbers to see if there is in fact any change (April 17 active listings vs April 16 active listings).
Regards,
ed…
Tommy
at 2:43 pm
When will TREB stop using convoluted reporting methods? That would solve 90% of the problems of interpreting what’s going on in the market but I suppose keeping the system as opaque and antiquated as possible is deliberate. I can’t wait until ordinary Joe has access to all MLS data without having to use an agent. The ruling should be coming down any day now.
Guguta
at 4:15 pm
Why do the real estate experts not publicize these facts to open eyes..? Everybody praises the govt. measures for the good job of ‘cooling’ the market and allowing buyers to get a fair deal. Do they really? They are misdirected into withdrawing from the market and wait for other ‘goodies’ from the govt. which in the end will be higher interest rates and of course, higher sale prices. there is no way that this artificial surge in supply is going to lower prices any time soon. The sellers with competitive products will still sell at high profits.
Lucy
at 2:57 pm
Well, it’s the end of spring now. WINTER IS COMING!