

Last week, I took a buyer client to see two condo townhouses for sale in the same complex.
One was listed at $799,900.
The other was listed at $1,110,000.
Were they completely different offerings, given they were priced over $300,000 apart? Nope. Just different listing and pricing strategies.
The first condo was listed at $799,900 with an “offer date.”
The second condo was listed at $1,110,000 with “offers any time.”
My client much preferred the second condo, as did I. It was a far better layout, and although it was only marginally larger in terms of square footage, that layout made the unit feel superior in every way, and it was more functional and much more conducive to his lifestyle.
But had he not preferred the second unit more, he would have thought twice about offering on the first unit. Listed at $799,900 with an offer date, it meant that the seller and the listing agent were setting up for multiple offers, and in a balanced market like ours, many buyers don’t want to play that “game.”
The unit listed for $1,110,000 had a comparable sale from earlier this year at $1,250,000. And by “comparable” I mean that it was an identical model.
We ended up buying this unit for $1,090,000, which is $160,000 less than the identical model sold for this past spring.
My client was happy, his parents were happy, and I was over the moon – not just in terms of the price we paid, but in terms of which of the two units we bought.
The other unit – the one listed for $799,900, received eight offers on their scheduled “offer night.”
So how much did it sell for?
Trick question, because the unit didn’t sell.
The seller rejected all eight offers and the next day, the listing agent emailed all the buyer agents who had shown the property to say “The unit is still available to show.”
However, and this is a big however, the listing was not updated. It still shows as $799,900 with offers on September 21st. The seller and the agent clearly don’t want to show their hand in re-listing for their desired price, but in the meantime, the listing is in limbo.
The results through the first three weeks of the fall market have been mixed, to say the least.
Here’s a colleague sent me the other day:

That’s not a typo.
That’s forty-eight offers registered on a house in Scarborough, and my colleague says there were over sixty offers when all was said and done.
It should come as no surprise that the sale of this house represents the highest “sale-to-list ratio” so far this fall:
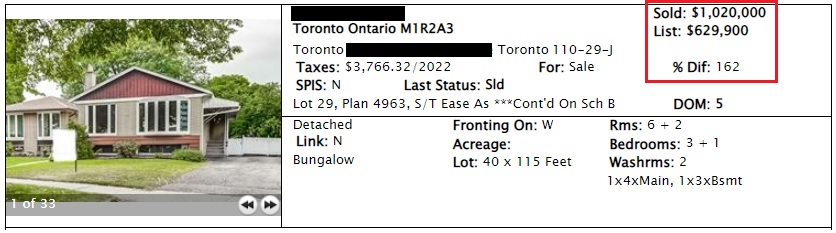
That’s not a typo either.
162% of the list price, wow.
But what was this house “worth?”
I think it’s fair to assume that it wasn’t worth anywhere near $629,900. I also think it’s fair to assume that of the sixty offers, thirty or forty of them were $700,000 or less.
More buyers out there are saying, “Let’s give this a try,” but when there’s sixty offers, you have to know that your conditional offer of $629,900 likely isn’t going to fly.
Another sale that really impressed me was this one:
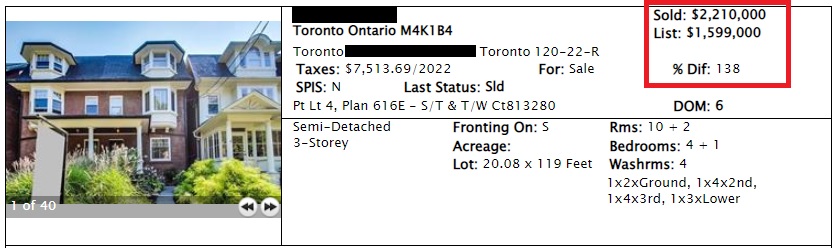
Impressed because it sold for 138% of the list price?
Impressed because it sold for $610,000 over the list price?
No.
Impressed because there were only two offers.
This house isn’t worth $2,210,000, trust me. The fact that there were only two offers has to tell you that the market for this property was thin. But if things like this are happening, then the market must be “back,” right?
To be fair, if we look at the bottom end of the sale-to-list ratios for freehold sales this fall, we find this:

When was the last time you saw a house sell for 69.7% of the list price?
That’s crazy.
On Saturday, I sat down to go through this fall’s sales data.
I looked only at sales from Tuesday, September 6th onward, since that was the true “start” of the fall market.
First, I looked at the sale-to-list ratio of freehold properties:
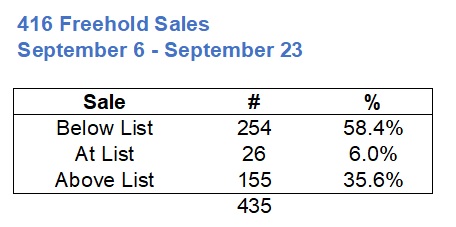
I think the fact that 35.6% of all freehold sales so far this fall have sold over the list price might surprise some people.
This was supposed to be a buyer’s market, right?
And yet more than a third of all listings are selling for over the list price?
When it comes to 416 condos, the data skews more toward a balanced market:

Nevertheless, 103 out of 585 sales going over the list price shows you that there’s still competition for condos and that, just maybe, the “list-low, hold-back” strategy can work in this market.
But what are we missing here, folks? With respect to this data, I can’t help but feel that it’s not telling us the full story.
Here’s a thought: a property listed for sale in July that sells in September is more likely to sell under the list price, right?
More to the point, if we really wanted to take stock of the fall market, we should only be looking at properties listed from September 6th onward, right?
So let’s re-run the above data but instead of looking at sales from September 6th through September 23rd, we’ll look at properties both listed and sold this fall:

The percentage of properties selling over the list price increases from 35.6% to 42.2%.
This makes sense.
Although to be honest, I thought it would be more of an increase. Nevertheless, 42.2% of all freehold properties that were listed from September 6th onwards ended up selling over the list price and I think that’s significant.
Here’s the same data for condos:

The percentage of properties selling over the list price increases from 17.6% to 30.6%.
This is a larger increase than we saw for freehold, although the overall percentage is still lower.
I think that a lot more sellers and listing agents decided to try the “list-low, hold-back” strategy this fall than those who listed in the summer, and the data reflects that.
But where you can really start to see the difference in how properties are being listed and sold is with respect to price.
Simply put, the lower-priced properties are selling over-asking at a significantly higher rate, and that’s true of both freehold and condominium.
Let’s divide the freehold sales by list price.
We’ll look at those priced $999,999 and below, those priced between $1 Million and $2 Million, and those priced at $2 Million and up:

This is exactly what we should have expected.
68.4% of freehold properties, listed and sold this fall, have sold in excess of the list price.
Comparatively, only 42.5% of properties priced between $1M – $2M have sold over asking.
I’m sure there’s a “sweet spot” where we could divide this further, such as $1.3M or $1.4M. The more demand there is for a product – in this case, “entry-level” houses, the higher the sale prices in the end. In February, that “entry-level” was somewhere below $1.4M. Today, it’s probably $1.2M as there are a lot more houses selling at prices we haven’t seen since 2021.
I’m actually quite shocked that 32.6% of properties listed above $2 Million are selling above the asking price, but that’s absolutely, positively a result of the lack of supply. I currently have six buyers looking between $2 Million – $6 Million and there’s almost nothing to show them. I’ve only taken two of those six buyers out to look so far this fall.
That is how thin our market is right now and I do believe that the September TRREB data, with respect to “new listings,” will back this up.
When it comes to condos, there are far fewer properties selling over the list price:

I’m using $600,000 as the cut-off for “low-end” condos, and while there’s a big difference between $601,000 and $999,999, we have to draw the line somewhere.
The $600K – $1M range shows us that 13.1% of properties are selling over the list price, but the $1M – $1.5M range shows us a 13.6% figure. Perhaps we could group this entire range together to simply say that twice the number of condos, below $600,000, are selling over the list price compared to those $600K – $1.5M.
Even still, only 26.9% of condos listed at $599,999 or below are selling over asking.
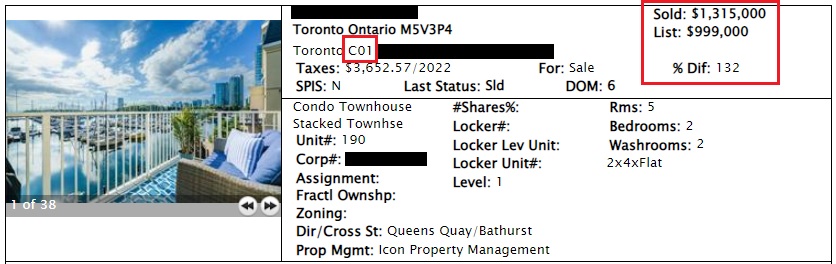
And when I look at the highest sale-to-list ratios for condominiums, I see fair number of C01.
Here’s an example:

How many people lined up to “bid” on this unit?
And what did they expect to buy it for?
So long as we’re seeing sales like this, it’s not a “buyer’s market” and it never will be.
In the next price threshold, we’re still seeing sales well in excess of the list price:
This unit happened to directly face the water, so maybe it’s not fair to show this as any sort of market indicator.
But if we were in a buyer’s market, this wouldn’t happen.
–
The above data refers solely to the 416, but perhaps a further discussion about the 905 is warranted.
Bottom line: the results are mixed thus far.
Nobody can say, with any level of certainty, that it’s a buyer’s market or a seller’s market. And even if somebody wanted to say it’s a balanced market, I’d probably ask, “Are you sure about that?”


Appraiser
at 9:27 am
The GTA hasn’t experienced a significant “buyers market” in 30 years.
J G
at 9:34 am
1996 was not a buyer’s market year?
Appraiser
at 10:33 am
From TRREB Market Watch Report summarizing 1996.
“TORONTO – Friday, January 3, 1997 —55,779 sales in 1996 sets new record for decade.”
“The Toronto resale market closed out the year with 55,779 sales of single-family dwellings, up a remarkable 42 per cent from 39,273 in 1995 and up 26 per cent from 44,237 in 1994.”
You were saying?
Derek
at 11:32 am
Maybe he meant 1995.
Appraiser
at 12:03 pm
The slump was severe and it was two-fold. I was there.
The market nose-dived in 1989 and it lasted for years, then made a slight recovery for a short period, only to relapse again in 1994, then to recover once more – for the long haul.
That is my definition of a significant buyers market; and it was begun more than three decades ago. All the old bears harken its return.
Derek
at 1:08 pm
It was the greatest buying opportunity!
Lisa
at 5:02 pm
To all people in a quandary about rates (variable/fixed) and purchasing decisions, know this. This gets worse from this point, not better. Anyone who is telling you otherwise is very likely set to directly profit from your near-term financial decisions.
Condodweller
at 4:21 pm
Yes, 96 was the best. I should know that’s when I bought. I remember the entire pre 89 to post 96 period as my parents came close to buying just prior to the bust and prices continued trending down after the initial decline in 89 until 96. I’m sure one can find outliers but my parents ended up buying few years later and their value still declined for years and I bought in 95 taking possession in 96 simply because it was too good to be true. I was only comparing it to rent and my calculations were that the cost of my place was something like 7 years worth of rent. Things turned around from there very slowly and the next 5-10 years were still a great buying opportunity.
I saw graphs plotting mortgage rates vs pruchase price and 96 would have been the best year to buy. David just covered the history of pre-con condos and you could buy well below market value for years after 96.
Number of sales didn’t have anything to do with it. I remember sales were going up regularly with the typical headlines even back then and I kept thinking what are they talking about as prices continued to go down. I cared about prices when I bought.
Adrian
at 9:28 am
I saw people on twitter talking about that listing that sold at 69.7% of list… Turns out there was a murder-suicide there in 2021! Probably explains the ridiculously low price… There’s no price I would pay to live there!
Graham
at 9:43 am
That’s the haunted house discount. Call 216-245-2368 for ghostbusting services.
Geoff
at 2:38 pm
Well it’s an interesting question – is it the fact that someone died there, was murdered there, or that it was just last year? Does time make it different? Consider an industrial loft building – it’s likely there were some industrial accidents, particularly in the early days. Or consider that in some houses, people would have been born in the house -which means that some % of children would have been stillborn and died in the house. Is it the knowing that bothers you? Remember, houses don’t kill people. People kill people.
J G
at 9:38 am
Why are we talking about listing price? During good times bulls said listing price don’t matter.
The fact is price is down 20-25% from Feb, and I believe it will go down another ~20% over the next 2-3 years as battle with inflation goes on.
Appraiser
at 2:35 pm
Is that you Garth?
J G
at 3:45 pm
Shouldn’t you be figuring out how to stop the cashflow bleeding on all your rentals?
Appraiser
at 5:24 pm
Don’t follow the logic. Rents are at all-time highs.
J G
at 5:42 pm
Until the job losses happen (as per Powell), and wages stagnate. They won’t cut rates until that happens.
Even then, LLs who bought in last 3 years aren’t doing well.
Alex
at 4:31 pm
hahahahaha
Lisa
at 4:59 pm
Unless something drastically changes in the last 5 days of September, sales volume in the GTA is down bigly. For September to be below August in volume is telling. The summer is over, there are no more excuses – how do you spin this?
JPR
at 4:44 am
@Lisa
Congrats on plagiarizing this tweet word-for-word. Give yourself a round of applause!
https://www.twitter.com/agentgina1/status/1574130013284204546
David Fleming
at 11:13 pm
@ J G
Good question, and you’re right – we do say that list price is irrelevant in seller’s markets, so I don’t want to come off as hypocritical by suggesting the metric is important now.
The reason I’m tracking how many properties sell over the list price is because I want to know the buyers’ appetite to enter competition. I also want to understand sellers’ expectations, strategies, and risk tolerance.
Del
at 10:49 am
David why is a seller able to leave a listing up for sale long after their offer date without changing the price?
Nobody
at 11:07 am
There’s no listing police.
All that does is demonstrate the seller/agent’s ignorance, laziness, &/or incompetence.
The only people hurt by not updating the listing to remove (or at least change) the offer date and revise the price are the seller & their agent.
It’s like bad photos on a listing – fewer people will be interested in the property and thus the transaction may take longer and bring in less money. Sellers and their agents should be motivated to do an excellent job, but we see all the time that they aren’t.
Condodweller
at 3:34 pm
I would go along with a balanced market. If people are pickier and only the cheaper/more desirable units are getting multiple offers that would indicate to me that things are more balanced. For a buyers’ market, I would want to see desirable units not sell.
When you have two similar units in one building where the better one sells near asking yet the inferior one doesn’t sell that’s a pretty good indication.
Appraiser
at 6:46 am
Housing crisis – what housing crisis?
“The average Toronto condo costs nearly 50% more than in early 2021… the average monthly rent for a condo in the city hit $2,963 in August.”
https://dailyhive.com/toronto/toronto-rent-increase-august-2022?__vfz=medium%3Dsharebar
Jimbo
at 10:45 am
I don’t know what you are celebrating.
At these prices Toronto will not be for families.
Where I live now my family pulls in $180-200k a year, and our home would never be 3x what we pull in. We are a family of 5 with two kids in daycare. The amount we pull in depends on the wife’s OT and any extra incentives I pull in throughout the year. The wife could easily pull in more if she committed to 1 shift of OT a week, but that is a lot of time away from the family.
I could be moved to Toronto at anytime, and I would be given two choices.
Choice 1: Sell my home and move my family. I would bring a $300-400k DP and my wage would increase by $20k. The wife’s pay would increase a little as well, maybe $2 an hour more, and our taxes would be a bit less. So we would have a $200-220k income. I don’t know what we could afford to buy and where we would live despite having a decent income and a good DP. Childcare would increase from $1530 a month to at least $3k I’m guessing.
Choice 2: I leave my family behind and my job provides $1,800 towards living accommodation and $200 for parking. At this rate, I don’t know if that would pay for a furnished bachelor with cooking facilities or not.
We could probably make a move work, but what is the cost to quality of life?
Derek
at 11:02 am
We must infer his rentals command the current market rate and he has no long term tenants enjoying below market rates.
Appraiser
at 1:14 pm
Who’s celebrating?