

Well, this is either going to make me a hypocrite, or show that I’m learning and evolving.
Maybe there’s a middle-ground in there somewhere?
I’ve always said that you really can’t make any conclusions by examining the real estate statistics that come out of the month of December, but after looking at the stats last week, I can’t help but focus in on a few of them.
Am I looking at these statistics because they’re out of place? Or should I simply come to expect “out of place” stats in this awkward, unpredictable end to ever year’s real estate calendar?
Can I use them to quantify the 2019 market as a whole? Or must I cast them aside and continue to examine the hot markets to draw inferences?
And last but not least, can I use them as a predictor of what’s to come in 2020?
There are reasons why market cycles are linked, whether those cycles are in the same calendar years or not.
The buyers who are active through the spring but don’t tie up properties, often wait until the fall. The slow month of August often acts as that bridge month between the two busy market cycles, and thus those buyers (and their agents) often look at market stats to try to forecast the road ahead.
The same can be said for fall buyers who aren’t successful in purchasing, who then look ahead to January and beyond as their time to shine.
But can these buyers look at the month of December for any insights?
I used to think not.
Historically, December is the slowest month of the year. And why would anybody look at the largest period of inactivity for insight?
That’s how I’ve always thought, and to some extent, still do.
But I was fascinated by how the Toronto real estate market finished 2019, and whether we can use this data as insight for the fall 2019 market, let alone a predictor of the 2020 market, remains to be seen. But I wanted to share it anyhow.
Part of the reason why I find the December data to be misleading is because of how dramatically our common metrics drop off. Look no further than average sale price, which drops dramatically every December, from November.
There’s nothing wrong with monthly fluctuations in our market, of course. There are peaks and valleys in our real estate calendar; hot and cold months, no doubt.
But the drop is so dramatic that it shows the data almost can’t be taken at face value.
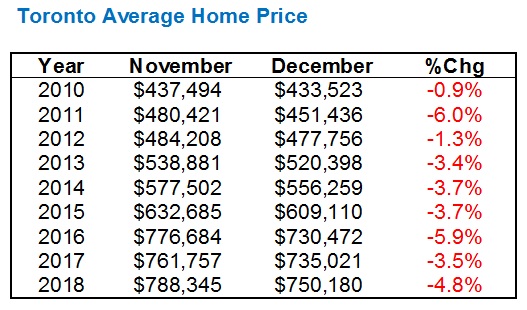
Coming into 2019, this is how the November-to-December drop looks for a decade running:
I mean, that’s nuts, right?
Nobody’s home dropped in value 4.8% from one month to another in December of 2019.
This is why I have a problem with December data, since the jumps in value during peak months, like March, to April, to May, are far more balanced.
Here’s where I feel like I’m either evolving or becoming a hypocrite…
Looking at this data coming into January when the December stats would be released, I was expecting, based on the last three years, a 4-5% drop from the $843,637 average sale price in November of 2019.
The market moved how it should move in the fall, with an $843,115 sale price in September, increasing to $852,142 in October, and then dropping modestly to $843,637 in November. So based on previous years, we would expect to see the December average home price fall somewhere between $800,000 – $810,000.
Only it didn’t.
Not even close.
With drops of 5.9%, 3.5%, and 4.8% from November to December, in each of the past three years, I was shocked to find that the average sale price in Toronto only dropped 0.7% in 2019.
From $843,637 to $837,788.
0.7%.
A rounding error, if you will.
Again, I used to shout, “Don’t read into December,” but now I was looking at this wondering if I could draw any conclusions from it. And you know what? I did.
I’m going to conclude that the 2019 fall market was exceptionally strong because of how the average home price held firm in December, not in spite of it.
Now why did the December home price hold so strong?
This is the fun part, since I believe the reason lays in objectivity, rather than subjectivity, the latter of which is so prevalent in conversations about our real estate market (especially those here on TRB).
Remember doing “proofs” in Grade 12 math?
There was something quite satisfying about knowing you got the answer on the test right, rather than just hoping you did. To solve a proof meant that you knew you were correct, otherwise you failed.
I found university economics to be similar in some respects, namely the relationship between supply, demand, and price, on an X and Y axis.
So for all the banter, conjecture, and opinion that floats around in the Toronto real estate market, sometimes it’s nice to see proof, of why something is the way it is.
This past month, supply dropped, demand, increased, and low-and-behold, prices increased too.
That is the way the relationship works, after all. There’s no debate about supply/demand curves, is there?
I’ll stop short of throwing up a graph…
While the focus thus far has been on the average home price, month-over-month, the year-over-year stat is even more significant.
Average home price increased 11.9%, year-over-year, from $749,014 in December of 2018 to $837,788 in December of 2019.
That’s the largest year-over-year increase of any month in 2019, which once again, tells me that home prices held really, really strong in December.
It also says something about momentum, which should be of interest to those looking to transact in the 2020 real estate market.
The year-over-year increases in average home price, for each month in 2019:
1.7%
1.6%
0.5%
1.9%
3.6%
3.0%
3.2%
3.6%
5.8%
5.5%
7.1%
11.9%
How is that for momentum?
Perhaps it tells us that the 2018 market was downtrending, and thus that is why 2019 looked the way it did, only 2018 wasn’t downtrending.
I can only conclude that this momentum is real, since the absence of the whopping 11.9% increase in December would still have pointed to upward momentum, year-over-year, through the fall.
Sales were up 17.4%, year-over-year, in December.
New Listings were down 18.4%, year-over-year, in December.
Prices were up 11.9%, year-over-year, in December.
Like I said, there’s some level of certainty when you’re looking at supply and demand curves, and when demand (sales) is up, and supply (listings) is down, prices WILL increase. It’s just impossible for them not to.
What you see above, with prices appreciating in relation to supply declining as demand increases, makes perfect sense.
Now, as for how we can use this to predict 2020, I offer the following.
Sales-to-New-Listings, or “SNLR,” is one of the most-used ratio when looking at real estate statistics.
It’s very common for SNLR to increase as the market moves through busier periods, so there’s nothing new about a higher SNLR in November, than October. That’s not the point I’m going to make here.
However, I want to make a comparison to a previous market cycle, just in case the spring 2020 market goes bonkers.
Have a look at this:
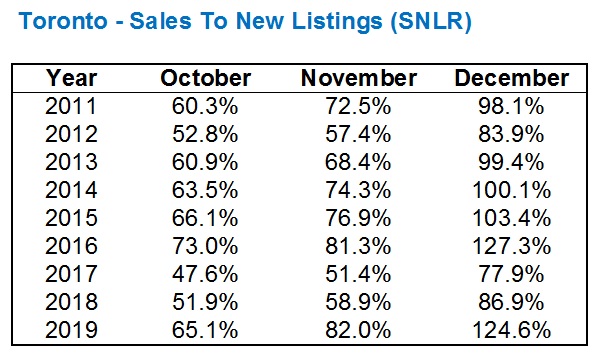
I was quite surprised to see the SNLR above 100% this past December, and while it’s not uncommon, it’s only occurred 3 times in the previous 8 years. And it wasn’t even close in 2018 and 2017.
But more importantly, when was the last time we saw a December SNLR this high?
You got it – the end of 2016.
And what happened to start 2017?
Madness.
Inventory levels were so dire in January of 2016 that something crazy happened: prices went up 20% in four months.
Just hear me out:
In January of 2016, active listings were down 49.5%, new listings were down 17.6%, average days on market was down 34.5%, and sales were up 11.8%. That combination resulted in prices increasing 22.3%, year-over-year.
We know what happened after this.
I’m not, in any way, predicting that prices are going to surge this spring.
But I am drawing your attention to the very high SNLR in December of 2019, compared to December of 2016, and combined with that upward momentum that I spoke of earlier, and the December home price holding its ground.
I mean, I certainly don’t see any reason for prices to go down, do you?


Christopher
at 7:52 am
As you pointed out with stats the supply/demand ratio indicates prices will continue to rise in the short term. We’ll find out soon if a flood of listings hits in the spring in response to a large jump in prices and we repeat the craziness of 2017.
balwinder bal
at 5:51 am
there was a times when buying a house was wondaful exerperiene witchlet the family. Lately,,is all anixty
Appraiser
at 7:59 am
The state of the market seems to have caught the attention of the Governor of the Bank of Canada as well:
“Canadian real estate is in danger of returning to a level of “froth,” said Bank of Canada Governor Stephen Poloz on Thursday.”
Poloz said the reinvigorated housing market in Ontario, Quebec and B.C. is driving a “fundamental demand.” That demand appears to be “outpacing our ability to build new homes, which can put renewed pressure on prices.”
https://rates.ca/blog/housing-market-risks-becoming-frothy-again-poloz?utm_campaign=frothy
Bal
at 11:44 am
If there is 50% speculation ..that might resolve supply problem
Appraiser
at 5:10 pm
Funny coming across this article from 2014 !
“The housing-crash bears have been wrong for 6 years. Why stop now?: Larry MacDonald”
https://www.canadianbusiness.com/blogs-and-comment/housing-crash-forecast-folly/
Twelve years of fear-mongering and counting…
Bears be awful silent lately.
balwinder bal
at 11:31 am
well i am bear and all i am gonna say …..my turn will come too and hope soon 🙂
condodweller
at 1:44 pm
Intriguing numbers. Great analysis. So things seem to indicate another year like 2017. Does that include the May correction as well? I also took economy 101 in university and while a appreciate the supply and demand theory, I always disliked the fact that it is often difficult to use it to predict the future. It can always be used to explain things after the fact. There are too many moving parts for me. In this case high demand vs low supply should mean high prices. Great, but then there is the pesky issue of higher prices causing lower demand. And what’s the effect of lower demand?…….Right. Scroll down if the answer is not obvious to you…..
.
.
.
Lower prices/substitution
Kyle
at 1:50 pm
Prices adjust to where supply meets demand. Demand does not then readjust for the new price.
condodweller
at 1:50 pm
Ok, before an expert jumps on me the higher price is not a cause of lower demand it results in lower demand and substitution.
Daniel
at 8:27 pm
David don’t you have an economics degree or something? I recall reading that in one of your marketing pieces I do believe.
David Fleming
at 9:45 am
@ Daniel
Not quite. I had a minor in economics, but an Hons. B.Com
paul
at 2:07 pm
curious to hear your thoughts on the vancouver market for 2020
Jimbo
at 2:06 am
A very strong December according to the statistics posted. You are in the best position to accurately predict Bayesian inference in this case.
My guess is the following….. The stress test had a larger impact than initially thought. Why didn’t we see it? More buyers than usual were ready to jump into the market. The ST hits and we see a small decline in sales, this captures the mean number of folks that would have entered but had to step back, it doesn’t include the number of new entries that would’ve happened on top of this number. The folks part of the mean and the upsurge that were in the wings just hit the ability to purchase and are entering the market. This will enhance the market the way it would have if the ST didn’t exist over a year ago.
I think you are seeing the the upsurge and sales that existed as growth but failed to come to fruition.
Appraiser
at 8:17 am
Pent-up demand.
Kyle
at 9:01 am
Jives with the anecdotal observations that some bears made last week about rents not being as hot at the higher end (i.e. above $2500/month). My guess is that the ST put a lot of would-be buyers’ plans on hold and into the rental market while they reevaluated, saved more, earned more, or whatever. But now those people are coming back into the buyer pool.
Chris
at 10:00 am
“Jives with the anecdotal observations that some bears made last week about rents not being as hot at the higher end (i.e. above $2500/month).”
David’s now a bear in your books? Your price point seems to be a touch off as well.
“I noticed weakness in the rental market last fall. I had a client who’s 1-bed, 1-bath sat for a month at $2,400, and he ended up selling it.” – David Fleming, Jan. 7, 2020
Kyle
at 10:42 am
I was referring about Professional Shanker (the one who actually raised the observation) on Jan 6.
“”Rental vacancy will increase, rentals are starting to sit on the market which would have never happened over the past 3 years, are prices too high, not sure. David, what is your perspective on this?”
BTW: Did you actually have a point to make, or just being pedantic again?
Chris
at 11:01 am
Your original comment about those sharing anecdotal observations on the rental market being bears would surely seem to encompass David, as well as Professional Shanker.
Just a thought, maybe next time try something along the lines of: “Jives with the anecdotal observations that some made last week about rents not being as hot”
Foregoing the use of “bear”, which you regularly employ as some kind of disparaging qualifier of opinion, would make your statement more accurate. I don’t think any rational commenter would label David a real estate bear, yet he did share his anecdote about rental market softness.
Kyle
at 11:28 am
While we’re just sharing thoughts, i have one for you. Try not to bury and mire discussions with nit picks about irrelevant details or semantics and instead try contributing points to the actual conversations being had.
Chris
at 11:33 am
Sure thing, Kyle! As soon as you try not to mire discussions with irrelevant qualifiers (e.g. “Bears!”), I will do my best not to nit pick semantics. Sound like a fair deal?
Kyle
at 11:35 am
Done deal.
Chris
at 11:36 am
I’ll hold you to it! I expect you to do the same to me. Cheers!
Kyle
at 11:37 am
And just to be clear, I did not say “not to nit pick semantics” i said “nit picks about irrelevant details or semantics”
Chris
at 12:12 pm
Sounds good, I look forward to our inevitable future debates about what constitutes a relevant or irrelevant detail!