

Last week was a big moment for myself and my family: it was the first time we all went trick-or-treating.
Actually, that’s not quite true. The dog stayed home.
But for myself, my wife, and my 5-year-old and 20-month-old, the experience was beautiful! Save for a fall here, and a scraped knee there, I’d say the evening went off without a hitch!
There was, however, one issue at the onset: who would stay home to give out candy? Bella, my dog, wasn’t equipped. So in the end, we were forced to be “those people” who put out a massive bowl of candy with a note that tells trick-or-treaters, “Help yourself.”
When I was a child, you’d stay up late praying for this! It was the opportunity to take the entire bowl of candy and dump it into your bag. But in 2021, the world seems to be (I can’t believe I’m saying this…) a better place. We came home to find the bowl was only half-empty, and I would hazard a guess that 95% of kids took 1-2 chocolate bars and happily scurried away.
My daughter understood the concept of trick-or-treating, but it took the boy a little while longer. Eventually, the light went off in his head, as he realized, “All these people are giving away chocolate, and not only that, my parents seem to have no issue with me eating copious amounts of it all at once.”
Have you ever seen a 20-month-old child run, full-speed, downhill? The legs just keep pumping and the torso tries to keep up. The arms flail and the head bobbles as the feet just keep pounding the pavement. You’re just waiting for him to fall and knock out all his teeth. I think he’d still be running today if not for the fact that he dropped his Smarties and stopped to eat them off the ground, which, of course, I let happen.
We probably hit about twenty houses, which was more than I thought we’d visit.
Maya was “Elsa” from Frozen, and we forced Duke into the “Olaf” costume, but he wouldn’t wear the hat. It’s just not the same without Olaf’s charcoal-eyes and carrot-nose.
I tell ya, that “Kristoff” outfit was itchy as hell. Made in China for pennies and sold on Amazon, I should have known it would be an uncomfortable evening.
But at least we got the family photo as the cast of Frozen, right? Actually, not the entire photo. We couldn’t get the dog to play “Sven.”
With Halloween behind us, it’s only a matter of days before the Christmas commercials start, right? I find that rather annoying. I think December 1st is the acceptable date, and if you really want to stretch it out, then November 25th, or one month of lead-up to Christmas, is fine. But when it’s November 5th, and you hear that familiar, “It’s beginning to look a lot like Christ-mas” jingle on the TV as advertisers encourage you to purchase that new Playstation two months ahead of time, I think that’s a big much.
When I write my November eNewsletter, it always dawns on me that we’re one month away from the real estate market basically drawing to a close. There’s still activity in December, but it’s just not the same. Transactions and listings are typically cut in half, and a lot of the sales are for properties that have been languishing on the market. There aren’t a lot of “hot, new listings” coming onto MLS around December 11th.
So with that said, we’ve got about one month left in this busy fall market. But how busy has it been? Has it lived up to expectations? Are we still gaining momentum and rolling full steam ahead, or did we peak back in September?
I always like to look at the statistics, but first, check in with my gut.
October was very busy for me and my team. We moved a lot of listings, some really good, some not so much. But even those not-so-great listings moved. I had one listing where I told the sellers to expect 4-5 weeks on the market, and we sold it within 24 hours of hitting MLS. That is always the sign of a busy market!
On the buy-side, things were very busy! I think back to clients who purchased a midtown house via bully offer on a Friday night. The four houses that we saw in tandem with the one we purchased received seven, five, six, and nine offers respectively, and they all sold for more than we expected.
So it felt like a busy month, and it felt like one where activity was up, prices were too, and it was a seller’s market in just about every category.
But what did the numbers say?
The media loves to compare year-over-year. I think thats’ because it’s the sexiest figure, and whether the market is up or down, you can use a year-over-year figure to exacerbate your point.
But I like to look month-to-month and then check back in previous years to see if the short-term fluctuations are in line with historical precedents.
When it comes to the GTA average sale price, the media ran amock with the 19.3% year-over-year increase in October, from $968,318 in 2020 to $1,155,345 this past month. That’s a lot, I won’t sugarcoat it, and I don’t know that anybody out there would argue this is “healthy.”
In our Monday morning meeting, I asked the team, “Do you think the average home price is going to increase from September to October?” We all kind of murmured to ourselves and then shrugged. “I guess so,” was the consensus. September was hot, so was October, and the market keeps going up, so why not?
Why not?
Well, because the average home price always increases from September to October:
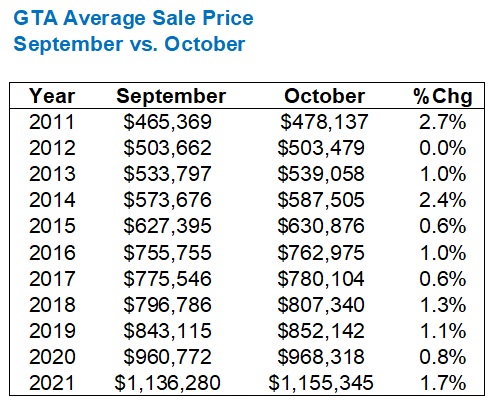
In 9/10 previous years, the average sale price increased. The only year it did not was in 2012 when the average declined by $117, or 0.02 of a percent.
The average increase in those ten years was 1.1%, so the 1.7% that the figure increased in 2021 is ahead of the curve.
Splitting hairs, semantics, call it what you want.
But the fact that the average home price increased from September to October means absolutely zero in the market context, since it does this every year. It’s that whopping 19.3% annual increase that we should be concerned about. Or not, if you’re a homeowner who never intends on moving…
The “City of Toronto,” or the 416, set a new all-time record as well, but the year-over-year figure was a mere 9.4%:
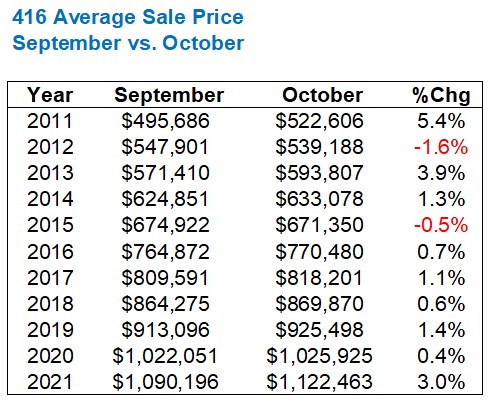
Having said that, the 3.0% increase from September to October is the highest since 2013.
As you can see above, in 8/10 previous years, we saw the 416 home price increase from September to October, so this is to be expected.
Now, I don’t usually go into the individual market segments, but I figured, what the heck?
Historically, the market for detached homes is mixed in the fall. In the previous ten years, we’ve seen a 50/50 split in appreciation/depreciation from September to October, but for four years running, we’ve seen that figure decline.
That skid ended this past month:

It’s worth noting that while the average GTA home price is up 19.3% year-over-year, and the 416 home price is only up by 9.4%, the 416 detached average is up 21.4%.
That’s an absolutely wild figure, and I think it speaks to the number of people who are out there buying their “forever home” in 2021, but also confirms what I have felt about the luxury market over the last two months: that it’s absolutely on fire! It’s not “normal” to see five offers on a $3M+ house, and yet we’re seeing that in this fall market. That’s the number one reason why I feel the detached average is up 21.4% from this point last year.
This represents huge upward momentum, and whereas the average 416 detached sale price has often peaked in the spring and come down in the fall, that didn’t happen this year, and that’s going to take us into a spring market where I expect even more buyers in this segment to be active.
The semi-detached market usually moves with purpose through the fall, as September sale prices set precedents for October and November, which really act as price floors.
The average semi-detached price in the 416 moved 1.4% month-over-month:

Again, we could have predicted this, since 8/10 previous years saw a month-over-month increase.
The condo market shed a modest 0.7%, month-over-month, but that pales in comparison to 2020:
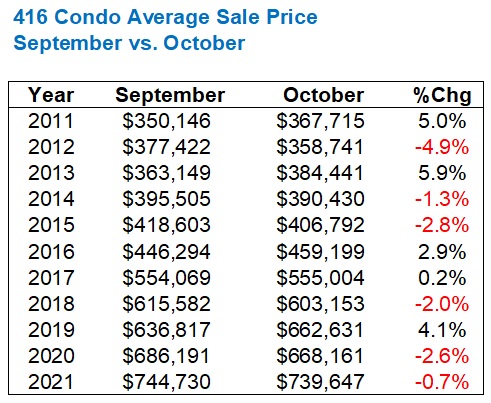
That 4.1%, September-to-October increase in average 416 condo price back in 2019 was a sign of things to come, as the Jan/Feb condo market in 2020 was the craziest I had ever seen. That ended when the pandemic began, but it was an indicator no less, as was the fall of 2016, which led to that insane 2017 spring market.
As for sales, we were coming off a fall in 2020 when the all-time record for sales in September led to an all-time record for sales in October, however, an October where sales still checked in lower than September.
That did not happen this past month:

In fact, we see that 2020 was actually the anomaly! A 4.7% decline in sales from September to October in 2020 was odd, considering the huge increases throughout the previous decade, not to mention 2017, 2018, and 2019, which averaged a monthly increase of 12.1%.
While sales may have dropped by 6.9% year-over-year, consider that they dropped from a record number in 2020! Those 9,783 sales were actually the second-most all-time for the month of October.
Now, if you’ve made it this far, you’re about to see what the real story in our market is.
Spoiler alert: it’s nothing new.
When it comes to the number of new listings in October, we saw a decline of 12.9% from September, and a decline of 34.1% from October of 2020. This brings to questions to mind:
1) Is a September-to-October decline normal?
2) Is that 34.1% year-over-year decline a concern, or is this like sales, where we’re coming off record figures from 2020, and thus a decline is expected?
Look at the numbers:

To answer the first question, a September-to-October decline is normal. In fact, it’s automatic.
In 10/10 previous years, we saw a decline, the average of which is 13.3%, so this year’s 12.9% drop is perfectly in line.
However, to answer the second question, the massive decline in new listings from October of 2020 is certainly a concern! Those 11,740 new listings are the fewest in the 11-year period analyzed above, and only once in all that time did the number of new listings in October even dip below 13,000, and that was way back in 2011.
Supply has always been the concern in our market. And despite conversations about foreign buyers, flippers, real estate agents, low interest rates, and the like, it’s the supply that really, truly is at the heart of our “problem” in the Toronto market, that is, for those that believe we have a problem.
When it comes to active listings, which is the number of listings available at month’s end, the situation is even more dire:
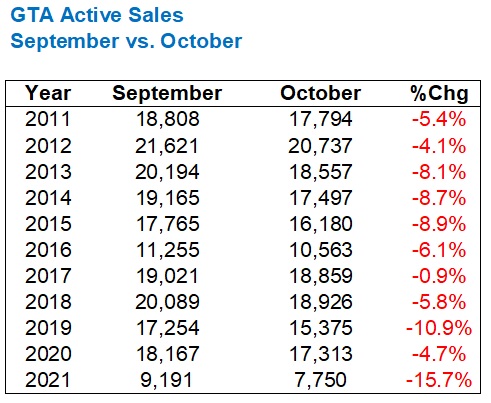
As with new listings, we see that in 10/10 previous years, the number of active listings declines from September to October.
But the drop is significant: 15.7%, when the previous decade averages a 6.5% drop.
Stats aside, just use your eyes.
Look at that number: 7,750.
The next lowest number is 10,563.
The average over the previous decade is 17,165.
Just think about that for a moment. That 17,165 figure is not a one-off. It’s not an outlier. It’s the average of TEN years.
And this past October, we were down to 7,750?
This is why real estate prices are where they are. There’s nothing for sale!
I don’t care what market you’re in, if you’ve got no product, and there are a slew of active buyers, prices are going to rise.
And in the case of the Toronto real estate market, we’re not just talking about rising prices but skyrocketing prices. How else do you explain a 19.3% year-over-year increase in average home price?
When you look at the sales-to-new-listings ratio, the story is spelled right out:
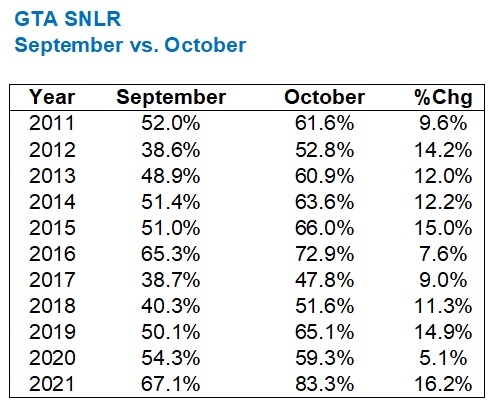
Month-over-month, the SNLR increased by 16.2%. That means the market is “tighter” in October than it was in September.
How tight was the market in September?
Well, at 67.1% SNLR, it’s the tightest month of September in our chart above, representing the previous decade.
But if you want to look at the entire data set, going back to 2002 when TRREB first started tracking this data, you’ll only find one year where September’s SNLR was higher than 67.1%, and that’s back in 2009 when the figure checked in at 67.3%. So September of this year was the second-tightest September ever.
As for October?
Well, at 83.3% SNLR, there’s nothing even close on that chart above.
In fact, the SNLR in the previous decade averages 60.2% in October. So consider just how little inventory there was in October to see SNLR clock in at 83.3%.
But if we go all the way back to 2002, we still won’t find anything close. In fact, the closest is October of 2009, at 73.5%. That’s not even close.
–
So what does all of this mean?
Presentation of statistics is one thing, but the interpretation is another.
October showed us that there’s just not enough for sale in the GTA to satisfy the demand, which is so ironic, considering that the summer election saw every political party talk a blue streak about the housing market, and yet none of them can do a goddam thing about it.
I was doing a buyer visit on Saturday and my clients and I met the owners. They were lovely, and the owner’s daughter actually went to school with my buyer! Small world! But the seller said something that sounds so cliche, but yet is so true – especially in the context of these statistics and the discussion about lack of inventory. She said, “It’s a wonderful family area. People try so hard to get into this area but there’s never anything for sale.”
Cliche, right?
Is it “hard” to get into an area? You’re not physically scaling a fence or anything.
And what does “never anything for sale” mean? Like, never?
It’s an exaggeration but it’s not hyperbole. With so few property owners wanting, needing, or looking to move, fewer and fewer properties are coming up for sale. And with seemingly more and more people looking to get into the area, decreased supply combined with increased demand is going to cause prices to skyrocket.
So, when you read this, how does it make you feel?
Skyrocketing prices: is that a trick or is that a treat?
If you are sitting pretty in your forever-home, it’s a treat. You don’t care about the 19.3% year-over-year increase in housing prices, because you aren’t looking to get into the market. You just sit back and make tax-free money each and every year as your home appreciates in value.
But if you’re looking to get into the market, whether it’s entry-level, move-up, house, or condo, this has to be a trick, right? It’s like when we were kids on Halloween, and there was always that one old couple who handed out bruised bosc pears when all you wanted was yet another mini Coffee Crisp or Crispy Crunch. Sure, that’s not exactly on par with the urban legends our babysitters told us about “razor apples,” but if we see another 19.3% year-over-year increase, we’re somewhere between razor-apples and the flaming bag of dog-crap that appeared on your doorstep back in ’88.
And for those who feel their non-stop house appreciation is a treat, what do expect your kids to do, down the line?
Now that October is in the books, what can we expect moving forward?
Call this a gut-feeling, and let me add that I’m not generally much for predictions, but I think the GTA average home price is going to retreat from that $1,155,345 figure. It’s not going up again. It’s just not. My gut tells me this is going to decline by 2-4%, which might be a rounding error for some, but with the December average home price always depressed, it could be the breath of fresh air that our market needs before we start all this over again in the New Year…


Appraiser
at 8:33 am
“Y’all remember when so many assessed the toronto condo market from ‘06-‘16 essentially like this: “unsustainable – look at all the cranes… makes no sense”. Where did you all go?”
~Frank Margani https://twitter.com/FrankMargani?ref_src=twsrc%5Egoogle%7Ctwcamp%5Eserp%7Ctwgr%5Eauthor
Condodweller
at 5:04 pm
Ok, so a 10 second scan confirmed the status quo. I’m glad I didn’t have time to read Friday’s blog and was able to do it now. I got a kick out of the letter. Are we really scraping the bottom of the barrel for new agents? I mean I thought it was a trivial matter to obtain a RE license and people can’t even do that anymore?
tspare
at 3:23 pm
Thanks for the detail data. Its amazing that GTA now has caught up to 416. I wonder if this is a sign that we are near the peak as you would think 416 price would be the ceiling. Your thought? Also whats your guess on why the SNLR is so low? Maybe you can do a blog on why people are selling these days when the new listing is so low.
BTW, watched your pick5 so came back to this to thank you for the work on this data.
Gord Collins
at 11:27 pm
Wow, like the yearly stats, better than what I have on my blog. https://gordcollins.com/real-estate/toronto-market-forecast/ I don’t understand why you stick with a lower price for 2022. I just don’t see demand disappearing. With the stock market so strong, people have a lot of money and they just need some encouragement to bring it over to the real estate market (rental property for long term income). Yes, it’s a treat for sellers for sure, and you should have another great sales year in 2022. People have a lot of money and the GTA economy is doing well. We haven’t even begun. With the US economy heated up by stimulus and recovery, and Alberta heated up by oil prices, it suggests Ontario and Canada are in a boom phase. The end of Covid will release a lot. Then immigrants and international students will return to eat up those condos. CMHC is calling for moderation in prices. What data do they draw on. They made that embarrasing call last year and they’re back at it again. Millennials are still drawing on their parents for help and they need a place for their new family. These young ones aren’t going to put their lives on hold too many more years.
PM
at 6:03 am
Not a perma-bear here. I see how tight the inventory is. I get the move higher. But with 5 year fixed having just jumped 50 bps in the past 6 weeks are we going to see a sideways market for the next 12 months? Or is everyone just going to switch over to variable rates to stay at 1.6% interest and max out purchasing power? Maxed out buyers pushes down demand in its own way.