
Toronto Life is at it again!
I can’t believe two years has passed since they published their rankings of 140 of Toronto’s neighbourhoods, and left it to the peanut-galleries (such as this one…) to debate, bicker, and critique the “findings” of their thorough analyses.
And now comes the updated, 2015 version, which has been Posted, Tweeted, “Liked,” Shared, and bandied about on social media, non-stop, all week.
It’s made too many headlines for us to not have a look at it here and now…
I’m a huge fan of Toronto Life.
How can I not be?
They constantly provide me with biased, inaccurate, and often wildly-speculated pieces on Toronto real estate, which make for great blog fodder!
I actually keep back issues of the publication in a special place in my office:
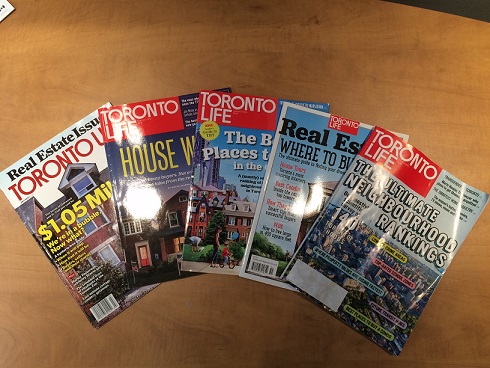
Everything they produce turns to gold, eventually.
Like this classic 2010 cover story on the real estate “bubble.”
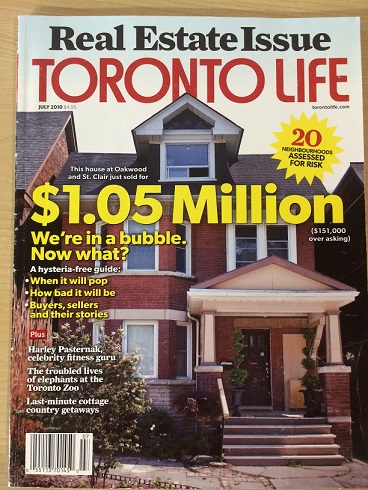
They even had a graphic called “How Bad It Will Be” with a “best-case scenario” of what looks like a 3-4% loss (tough to tell from their graphic, but the line was trending down slightly).
The irony about this piece is – the average home price in July of 2010 was $432,253, and in this past August of 2015 it was $602,607.
So had you listened to Toronto Life and the “bubble” talk, and not purchased a home, you’d have lost out on a 39% increase in average home price. Oh – tax free, of course.
In that 2010 piece, they also gave readers a “Risk Assessment” of a slew of neighbourhoods, which I’ve scanned from the print mag:
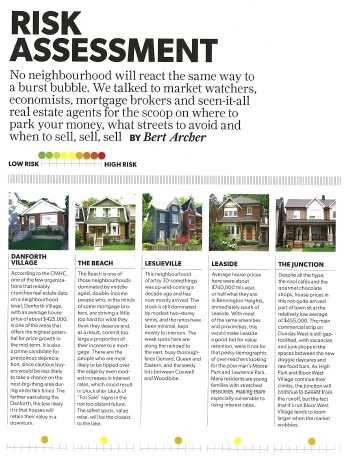
So consider that this “risk assessment” goes from “safe” at the one end, to “risky” at the other, what was one of the areas, according to Toronto Life, that wasn’t a “safe” place to buy a home?
Yonge-Eglinton, of course!
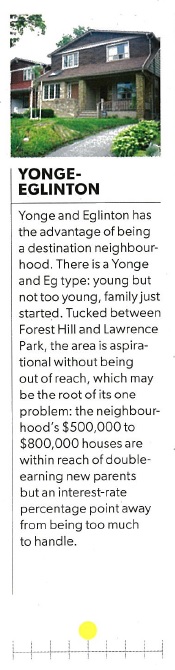
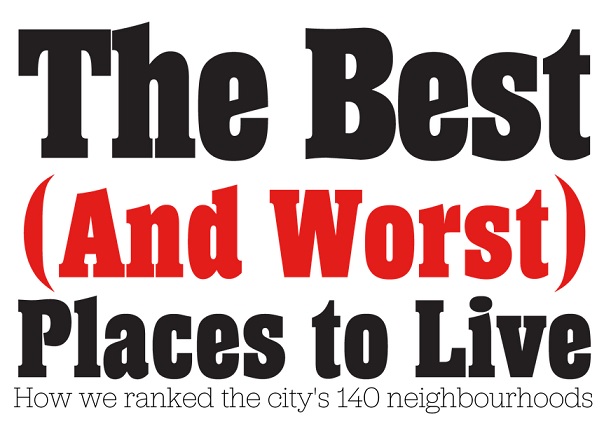
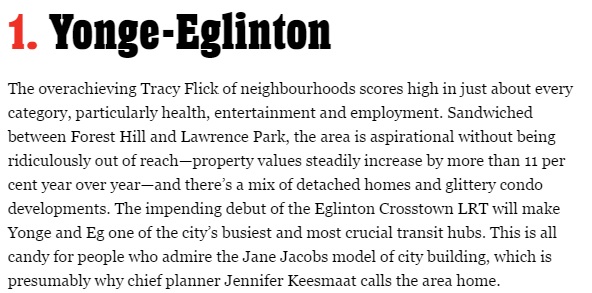
Now fast-forward to 2015, have a look at the “Best & Worst Places To Live” list of 140 neighbourhoods, and what is the number-one location in the city of Toronto according to Toronto Life?
Yep, you guessed it:
Well, at least they’re selling a lot of magazines, right?
In case you have no clue what I’m talking about, the 2015 Toronto Life “Ultimate Neighbourhood Rankings” have been released, and you can take a look at the online version HERE.
Let’s be honest here, folks: I don’t think any two people are going to agree on the rankings of 140 neighbourhoods! But having said that, some of the rankings are ridiculous, and it all starts with the “criteria” used in the first place.
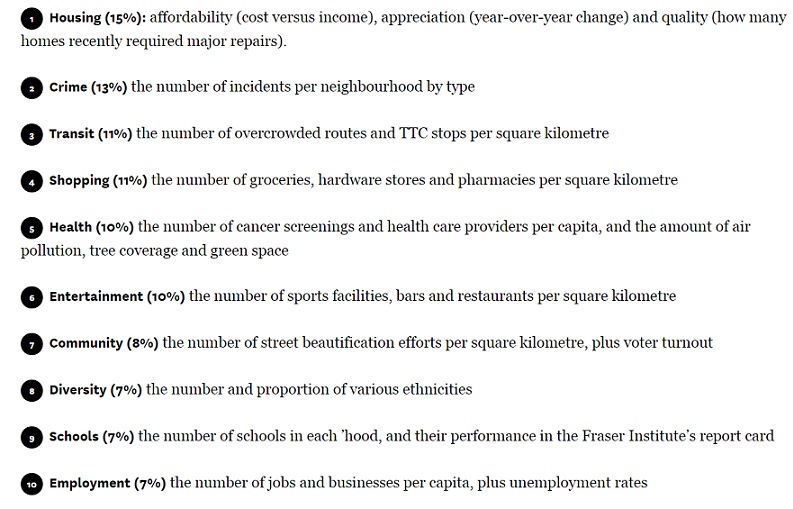
Here’s the complicated mathematical analysis used by Toronto Life:
I have problems with the following:
1) Housing.
I’m not sure if they view appreciation as a good thing, or a bad thing.
For example, in the section for Leaside, they write: “The growth of average real estate prices, year over year, is a comfortable 8.82 per cent.”
Are they looking for lots of appreciation, or little?
Not only that, this idea about homes needing “major repairs” is absolutely idiotic.
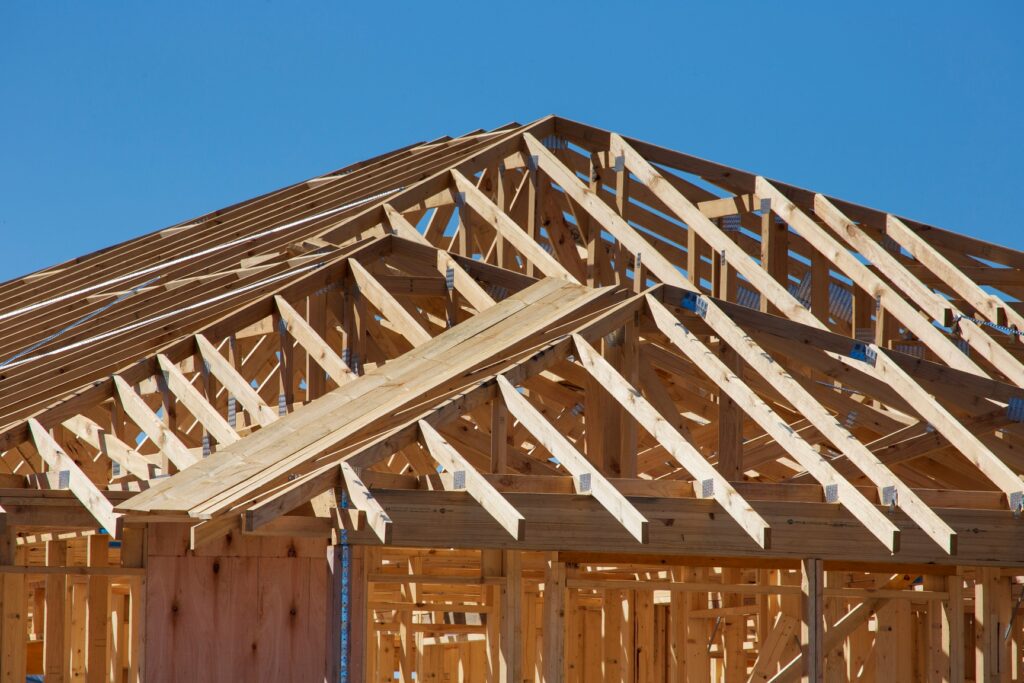
Many people seek out homes in awful condition so they can renovate.
The amount of people building or renovating homes in Toronto has never been higher. Many buyers are on the lookout for estate sales, which offer nothing more than land value. Others “don’t want to pay for somebody else’s work,” and look for great bones with the potential to add value.
The fact that Toronto Life is taking marks away because houses need work makes no sense.
I think they’ve read a bit too much about the TCHC’s “housing repair backlog” and forget that not all homes “must” be repaired (not to mention with tax dollars…), but rather some homes “can” be renovated and upgraded!
Does a 1980’s kitchen “need” to be repaired? I dunno. Ask Toronto Life…
3) Transit
This is ironic.
The transit is fantastic in many areas where people don’t care, ie. those more affluent areas where nobody takes transit, and there are a lot of “five car families.”
Suffice it to say, most of the neighbourhoods at the bottom of the list are going to have low transit scores.
5) Health
“The number of cancer screenings and health care providers per capita.” So, what, this is like the Ice Bucket Challenge all over again? Are we going to argue over which disease is better or worse?
“The amount of air pollution, tree coverage, and green space.” Call me a cynic, but I want to know where they got statistical breakdowns of these 140 neighbourhoods, on air pollution!
And to be honest, I don’t know if “tree coverage and green space” is what I would refer to as “health.” Perhaps the proverbial tree-hugger wrote this section while playing hacky-sack in the park…
7) Community
Voter turnout?
Really?
I mean really?
This is important in terms of where to live?
Let me try really hard to read into this.
Whoever included this criteria believes that higher voter turnout means that more people care about their own individual community.
In reality, I’m of the opinion that in every election, ever held, anywhere, virtually every voter starts from the very top of the voting card – with the Federal election, Provincial election, or what have you, and only then works their way down to City Councilors at the very bottom of the card, and often vote for them as an afterthought.
Street beautification efforts?
There’s that green-friendly, lefty, tree-hugger again!
In reality, most residents think of “community” in terms of the number of events that involve the people living within that area – school events, social events, neighbourhood gatherings, block parties, firework displays, bake sales, charity projects, children’s sporting events and leagues, etc.
And does having a lot of street beautification projects currently on the go mean that the area isn’t already beautiful?
Voter turnout? I still can’t believe it.
8) Diversity
Here’s a hot-button topic.
I’m going to be brutally honest here, and feel free to fault me, but I don’t think many people actually care about diversity. I think it just makes Toronto Life look holier-than-thou to bring it up.
Ironically, the residents of many areas of the city would prefer if their neighbourhoods weren’t diverse. I’m not saying I agree, nor am I saying that’s right, or just. But come on, let’s address the elephant in the room here – do you think the residents of Leaside-Bennington care that they scored a 14.8/100 in “Diversity?”
Or do you think some residents, of some areas in Toronto, prefer it?
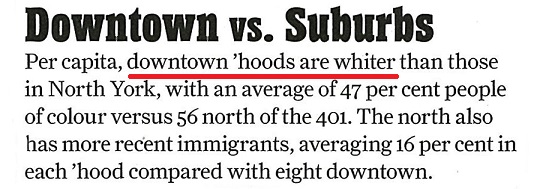
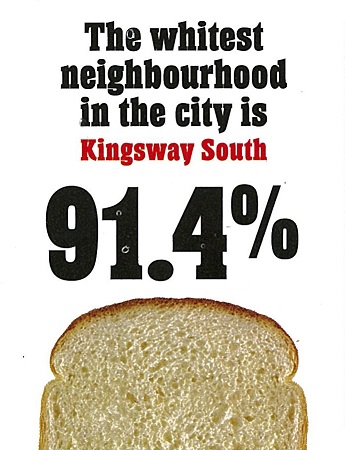
This Toronto Life article had a serious pre-occupation with white people. It’s littered through every page in print, and every section in the online version.
Here’s a blurb from the print version:
Here’s the caption for the #9 ranked neighbourhood:
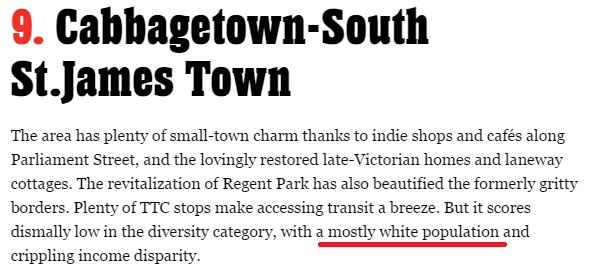
And here’s something interesting:
Great, thanks, Toronto Life.
Now I’m gonna head home and cry my white-self to sleep.
Did Toronto Life just jump on the multi-cultural bandwagon here?
I mean, it’s not just one mention in the article – it’s everywhere!
And they’re taking points away for areas being too white.
Honestly, I don’t care what colour the people are that live next door, or down the hall. Too white, or not white enough – it doesn’t matter to me, and I can’t believe this was put into print.
10) Employment
Raise your hand if you work in the same neighbourhood in which you live?
If your hand is raised, you’re in the extreme minority.
Toronto Life is measuring the jobs per capita within the neighbourhood, and using this as a criteria for the attractiveness of living in the neighbourhood itself.
Is it the 1940’s?
Leaside was built around the factories down on Laird drive so the workers had somewhere to go home to at night after the steam-whistle blew (or was it a dinosaur yelling, like in The Flintstones?), but that was 80-years-ago.
Today, very few people live and work in the same area, so I don’t see how this is a good measure of a neighbourhood.
–
So there you have it, folks.
I don’t like these criteria at all, and I think they have a left-wing undertone to them. I know, I know – you hate when I divide things into “left and right,” but all that’s missing from this is “11) Bike Lanes Per Capita,” and we’d be all set.
The reason, in case you’re wondering, why I make such a big deal of this, is because so many people read these Toronto Life articles, and are influenced accordingly.
Hundreds of thousands of people will read these neighbourhood rankings, and I’d hate to see somebody kick “Leslieville” to the curb because Toronto Life, for some god-forsaken reason, ranked the area #123 out of 140, behind many of the worst areas of the city.
In Friday’s blog, I want to highlight some of the ridiculousness of the graphics displayed in the print version, and have a look at my “Top Three Neighbourhood Snubs.”
In the meantime, if you’ve read the article, please share your comments below.
I’m curious to know:
1) What criteria would you use for ranking Toronto’s neighbourhoods?
2) Which of the 140 areas were ranked too low, and too high?


Appraiser
at 8:30 am
Way too complicated for me. Impossible to actually believe you can rank that many neighbourhoods with any degree of accuracy.
Off topic. With the Jays magic number at one, they need only split the double-header with Baltimore today to be AL East Champs.
Oh, the glory days are back!
Jim B
at 12:30 pm
Let’s not throw around the term “glory days” quite yet, please, Don’t forget that the Raptors have won their division (fairly easily) in each of the past two seasons, yet their playoff “success” has been, well,…. And don’t tell me the AL East is as good as it used to be (I’m a Red Sox fan, and as terrible as they’ve been – until recently – they’re right in there with the equally hopeless Rays and Orioles). All of which is not to say I think the Jays will tank in the post-season. I just prefer to wait and see (and again, as a Red Sox fan, I know what it means to wait!).
JoeJohn
at 1:43 pm
Are you from Toronto and happen to be a Red Sox fan? Shameless.
Jim B
at 3:18 pm
Actually, I’m from Montreal, and my Red Sox fandom dates back to the 1960s (before the Expos) when my dad took my two brothers and me to Red Sox games when we were vacationing in Maine (as all of Quebec did/does). Naturally, we went to Fenway every year from 1962 to 1966 but not in 1967. Figures!
So of course I dislike (not despise) the Leafs and Argos, but love the Raptors (no NBA in Montreal) and Toronto FC (the Impact coming long after I’d moved to Toronto). And I’m sure we can all agree that the Bruins are the lowest of the low (my Red Sox fandom does not extend to any of Beantown’s other teams).
Mike
at 4:05 pm
Let’s be careful what we wish for, the “glory days” were also at the start of a massive recession that cratered the condo market and sent housing prices into a negative funk until 2001.
Appraiser
at 9:02 pm
Congratulations Toronto Blue Jays on blowing out the Orioles 15-2 in the first game of tonight’s double-header. Just to put an exclamation mark on who deserves the title.
When you haven’t won the Division in 22 years, it qualifies as glorious to me.
GO JAYS GO!!
Julie
at 9:06 am
It’s almost impossible to rank neighbourhoods as we all have different needs. We moved from Forest Hill to Yonge and Eg a couple of years ago. When our kids were little, Fotest Hill was the perfect, quiet family neighbourhood. Now that our kids are teens, we all love living at Yonge and Eg where most everything is within easy reach. The kids love being able to just walk to the movies, shops, restaurants, subway, etc.
Joe Q.
at 9:16 am
These rankings are just like the city or country rankings put out by The Economist, etc. The weighting of the various factors reflects the preoccupations of those doing the ranking.
That said, I was pleasantly surprised to see my neighbourhood in the top 20. LOL
As for David’s comment “Call me a cynic, but I want to know where they got statistical breakdowns of these 140 neighbourhoods, on air pollution!” — this research was done by U of T in conjunction with Environment Canada. They are probably using ultrafine particles (which cause breathing problems) as a proxy for pollution in general.
See http://www.inhaleproject.ca/toronto_air_pollution_map
and http://www.thestar.com/news/gta/2015/04/21/air-quality-map-shows-torontos-most-polluted-neighbourhoods.html
Kyle
at 9:59 am
This list is like coming up with a ranking of the best/worst foods or the best/worst colours. Does anyone take this stuff seriously?
Toronto Life is a bit like Kim Kardashian. They both manage to monetize ignorance and nonsense into dollars. Quite an amazing business model, i must say! I just haven’t quite figured out whether their success is the result of brilliant strategy or serendipitous moments of stupidity.
Marina
at 11:36 am
The granularity they are going for is ludicrous.
I`d rather see neighbourhoods split into tiers and by lifestyle. Like family neighborhoods would have top tier places like Rosedale, then Riverdale, Lawrence Park, etc, then areas like Upper Beaches, Leslieville, and so on.
Young People neighborhoods would have St Lawrence Market and Liberty village and King West, then Distillery, and so on.
I`d like to see something for retirees too.
Also would be nice to clearly identify up and coming areas – new infrastructure, disproportionate appreciation of property values, new construction etc.
Trying to rank 140 micro areas is just stupid.
crazyegg
at 12:09 pm
Hi All,
This weighting scheme structure that is used by TO Life here is typical of many other social surveys out there. It is not complicated nor is it out of the ordinary.
However, one can disagree with the magnitude of the weight that is assigned to each variable.
Diversity is only weighted 7%. It is not a key driver in the overall scoring. As such, I would tend to agree with David that the comments in the article are very skewed for the number of mentions regarding the whiteness of neighbourhoods.
That being said, this survey like many other surveys are inherently biased to over-represent white people. Who commissioned this survey? Who are the voters in elections? Who is the editor? You guessed it: white people. Or more specifically, OLD WHITE PEOPLE.
Regards,
ed…
Jim B
at 12:24 pm
David, you do know that “criteria” is the plural of “criterion,” right? Oh, no, I guess you don’t.
JoeJohn
at 6:22 pm
Pretty tough words from an an anonymous armchair warrior. You are a guest on a professional’s blog. Have some respect for David.
Geoff
at 8:31 pm
And Jim B you do know that if you don’t have anything nice to say, don’t say it, right? Oh, no, I guess you don’t.
David Fleming
at 11:46 pm
What’s the plural for “moose?”
Is it mooses?
Or meese? I’ve heard “meese” before, but I’m not sure if it’s with an “s” as in “meese” or a “c” as in “meece.”
This has been bugging me for like two decades now, and I think it’s time I finally buckle down and solve this one…
Geoff
at 1:02 pm
moosi
Joe Q.
at 12:32 pm
I think the plural of moose is just …. moose.
Meg
at 12:36 pm
I’m surprised they didn’t include a walk score. That one measure potentially gets at many of the items on the list. Walkability impacts health, it affects community spirit, environment. If you have a very walkable neighborhood, chances are it probably also scores pretty high on parks, restaurants, local entertainment, and local jobs (at least, in the retail/service sector). Also relates to schools. Having a school that kids can safely walk to ranks high on my list.
I’m not as offended by the use of voter turnout as an indicator. I would expect voters as a group to be more involved in their local neighborhood than those who don’t vote.
The transit measure as described is a bit odd to me. When I think of desirable transit, I want something close by, frequent, and fast. # of stops per km doesn’t really tell you that. A house right on the subway line (or even a dedicated streetcar lane) is clearly much more transit friendly than one in a neighborhood with a lot of bus stops.
David Fleming
at 11:49 pm
@ Meg
Good call on the “walkscore.”
They could have also used the “transit score.”
I honestly don’t know who runs http://www.walkscore.com, but I trust their data more than whatever Toronto Life used…
bugeyedbrit
at 9:15 pm
My hood gets 2.8 for housing (Roncesvalles), really? Has anyone from Toronto life actually visited the area, 2.8 suggests we all live in Tents, really, 2.8 out of 100 ??
Joe Q.
at 11:36 pm
Looks like my earlier comment got eaten by the moderation monster.
David wrote: “Call me a cynic, but I want to know where they got statistical breakdowns of these 140 neighbourhoods, on air pollution!”
This actually does get measured, and it’s pretty granular. There are maps that show the average airborne particulates concentration (the major risk factor and / or aggravating factor for asthma) over the whole city, I think similar maps exist for ground-level ozone etc.
Unsurprisingly, the areas that fare the worst for air pollution are those near major highway interchanges. The south end of the 427 at the Gardiner / QEW, the 401 / DVP / 404 interchange, and the 401 / 409 near the airport are all bad. Along the 401 through Scarborough is pretty bad as well. Downtown is not great either.
“Tree coverage and green space” is important for health too, in a more indirect way. People tend to get sick less and recover from illness faster. Of course it is important for kids as well.
David Fleming
at 11:50 pm
@ Joe Q.
Sorry about that.
It flags most comments with URL’s, which sucks, because those are often the most in-depth and analytical comments!
I need to check it more often.
Joe Q.
at 9:35 am
No worries David.
Toronto Public Health spends a lot of time on this kind of thing (a good friend of mine works there) as people who are pre-disposed to asthma or respiratory problems and lived in these areas tend to spend a lot more time at clinics / ER / etc.
Kyle
at 10:39 am
There is or at least used to be (link no longer works) a map that shows every single City tree in Toronto. So they indeed can be counted, doubtful that Toronto Life did this though. I personally love trees, but caution needs to be taken when drawing the conclusion that trees contribute to health and recovery. The reality is that richer people live in leafy neighbourhoods, and richer people can afford to have better health.
Joe Q.
at 1:39 pm
Kyle — I am thinking of the very interesting hospital study from some years back (I think it was in NYC) where hospital patients were found to recover from surgery more quickly if their rooms overlooked a garden vs. a street or other buildings. The effect was statistically significant.
Joe Q.
at 1:42 pm
Correction — it was Utah, not NYC. See the article linked below for multiple lines of evidence that trees and green space have an effect on health and well-being:
http://www.apa.org/monitor/apr01/greengood.aspx
AndrewB
at 9:31 pm
They think Cabbagetown is too white?! I walk through the area to visit clients all the time. It isn’t very white.
Kyle
at 1:15 pm
As ridiculous as the idea of being able to accurately rank 140 neighborhoods is, I don’t see anything outrageous about saying Yonge and Eglinton was a risky (even then, the risk indicator was in the middle….) call back in 2010, but in 2015, it’s their number 1 pick. I mean, are things not allowed to change in 5 years?
Mark N
at 9:01 am
In a city as multicultural and diverse as Toronto, it is disappointing to see the Toronto Life rankings of top neighbourhoods being predominantly white/anglo/WASP cookie cutter enclaves. By virtue of this they are safe investments and self-perpetuating, but not very dynamic and certainly far from hip. The hidden criteria Toronto Life failed to reveal in devising their rankings was the ‘blandness factor’.
Have we not evolved beyond the 1950’s white-bread paradigm of what constitutes a good neighbourhood?
lui
at 9:43 am
I try to avoid areas where hipsters are flocking to.
bella amada mary
at 5:05 pm
I never thought i would be free from Asthma again after been diagnosed in 2014, i have tried everything possible in life from one doctor to another, one
hospital to another, series of tests, different kinds of medication, i had
already lost hope until i meet Great Dr. sebi online testimonies, a
specialist in herbal medication from Africa, i contacted him and he prepared Asthma herbal medication for me which i took for 7days and now i am completely cured. i want to use this medium to express my gratitude to him for saving my life and curing me from Asthma , for taking away all my pains and sorrows, I”m indeed grateful and i am
so happy I”m now completly free from Asthma. i will continue to tell the good news of
your great works to everyone, if you have HERPES, HIV/AIDS,ZIKA VIRUS,HPV or other disease contact him, Email: for more information you can talk with my on my whatsapp number +19093283569
Celina
at 6:19 am
I was cured of herpes simplex virus, I am so happy, The Doctor’s email ____________________________Robinsonbuckler11 @ {{gmail}} com…………