
As I always write in this space, every man, woman, and child has his or her way of going about the TREB stats once they’re released.
We can make an argument, one way or another, depending on which stats we use.
We can also bias ourselves, if we wanted to, by seeking out a particular metric.
The four stats I always look at are average price, sales, active listings, and new listings, usually in that order.
To be fair, most people only care about price, but those of us who want to do a deeper dive will consider benchmarks like the absorption rate.
The biggest surprise in my mind this past month was with respect to the average price.
I had predicted in my e-newsletter that the average Toronto home price would surpass $840,000 by the end of October.
Then in my “Predictions For The Fall Market” blog post, I used historical data from 2011 through 2018, and past years’ growth rates to come up with these predicted average home prices for the fall of 2019:
September: $819,893
October: $835,597
November: $815,937
Suffice it to say, those were low.
The average home price in Toronto this past September was $843,115.
This is a 5.8% increase over September of 2018, which is significant in itself, because this is the largest monthly year-over-year increase since the crazy 2017 market. Specifically, this is the largest increase since July of that year. Have a look:
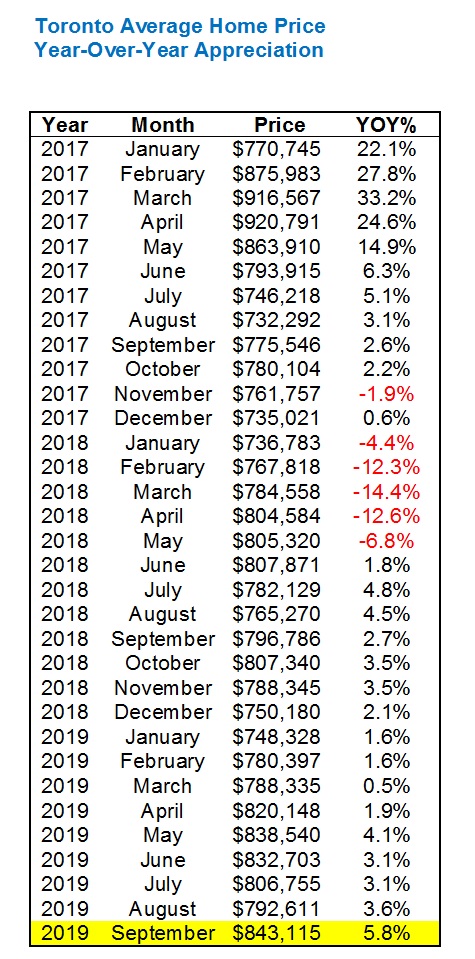
Sure, this 5.8% can’t hold a candle to the crazy numbers we saw in 2017, nor do the negative/red 2018 numbers really compare.
But even if you just want to look at 2019 for comparison’s sake, this 5.8% still stands out. And not just because it’s highlighted in yellow!
This is what I would call an indicator of an upward-trending market, and based on this, I expect October to be even higher.
For those of you that read my “Predictions” post in September, you’re aware that October home prices are typically higher than September, so let’s use that to try to come up with a reasonable guesstimate for October:
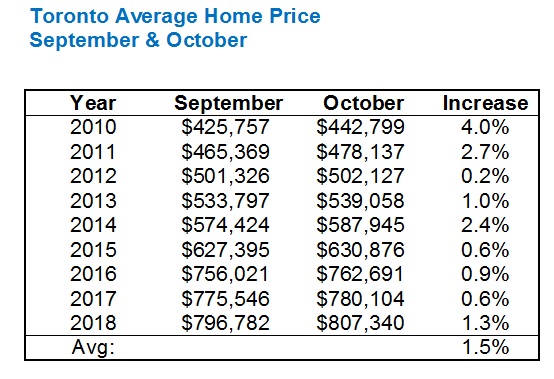
Home prices have increased, on average, every single October over September for the past nine years.
The average increase is 1.5%.
So simply using the $843,115 average from September of 2019, we arrive at a predicted October average of $855,762.
Now how does this $855,762 estimated figure, or even the actual $843,115 figure from September grade on a curve? What does it tell us about the overall health of the Toronto real estate market, and the path on which it’s headed?
Personally, I’ve always felt that a “very strong fall market” is one that trumps the spring, and for good reason.
If you had to guess, how many times in the past nine years, from 2010 to 2018, would you say the October peak trumped the May peak?
Half?
More than half?
Or less?
How about 7/9 years?
Take a look:
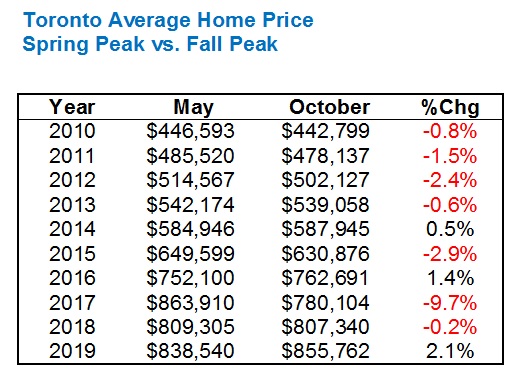
Assuming, of course, that May is the peak in the spring market (which it is, statistically), and that October is the peak in the fall market (the stats from the previous chart shows that it is), we can see that from 2010 to 2018, the October average home price only beat the May average home price twice: in 2014 and in 2016.
Add in 2019, and that makes three times in a decade.
That shows me that the market is strong, and while it does use an estimated price for October, even using the $843,115 from September would give us a better month than May.
Just for good measure, and because I was starting to wonder if my bias was starting to lead my selection of statistics, I wanted to know how an average of the “peak” months would look, and if it would change anything. So I looked at the average of April/May/June versus September/October:
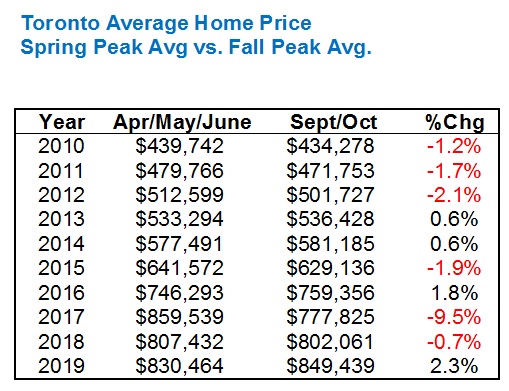
The only thing that changes here is that 2014 goes from red to black.
That still means that the average home price in the spring beats the average home price in the fall six times in nine years from 2010 to 2018.
And then along came 2019…
The other number that really stood out to me this past month was the amount of sales.
September saw 7,825 sales, which was a whopping 22.0% increase over the 6,414 sales in September of 2018.
That’s a huge number! 22.0%, wow.
Now we’re used to seeing numbers like this in the month-over-month figures, which is greatly affected by seasonality. But year-over-year should see far more continuity, and less far less volatility.
So I wondered: is 7,825 sales significant? Or were the 6,414 sales in September of 2018 just an outlier? Because if it’s the latter, then everybody touting this 22.% figure as a sign of incredible strength is being misleading.
Here are the sales figures from 2010 to 2018 for the month of September:
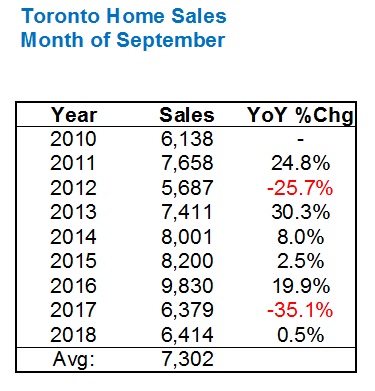
Alright, so it’s exactly what I just described: that “huge” 22.0% figure is simply inflated by a low number of sales in 2018.
The average number of sales over the past nine years is 7,302.
So while 7,825 is “above average,” it’s not as strong as that 22.% increase would have us believe.
Average home price and total sales were the only numbers that interested me this past month.
As I showed you in my “Predictions” post last month, inventory has been so incredibly consistent throughout September that an outlier is so unlikely.
Just as refresher, here’s New Listings for the past ten years:
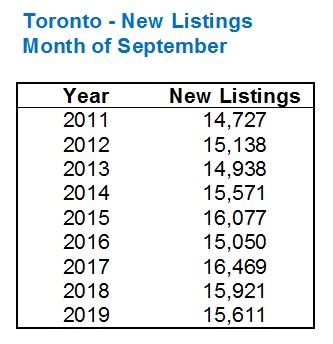
If not for 2011 (when there were a hell of a lot fewer condos than there is today…) then every year would be within 15,138 and 16,469, which is a 10% band.
That’s highly consistent during a very chaotic decade!
I did look at Sales-to-New-Listings just to see what it showed, and this is in line with the idea that this September is a lot busier than the last couple of years, and then somewhat in line with most years (outside the crazy 2016 fall market) in the last decade:

What still surprised me the most, however, is the fact that the September average home price trumped May, which has only happened in 2/9 previous years.
Or maybe I’m hanging on to that one stat because I’m looking for a positive metric?
Bring on October!


Christopher
at 8:04 am
A contributing factor to the recent elevated price and sales numbers may be the year long drop in mortgage rates. Rates have come down by about 1 percent from the beginning of the year and are back to the low levels of 2016-2017
Appraiser
at 2:36 pm
Mortgage rates have fallen it’s true, but the qualifying rate has barely budged. Its down only 15 basis points from 5.34% to 5.19%.
https://www.bankofcanada.ca/rates/daily-digest/
If the artificial demand dampener (a.k.a. stress test) were ever to be removed or somehow normalized, prices would be even higher.
There is still a great deal of pent-up demand.
Christopher
at 4:35 pm
True, but how many people are spending to their max borrowing limit?
Appraiser
at 6:59 pm
Huh?
Christopher
at 9:26 pm
If you would have been approved to borrow 600k, but because of the stress test are only approved to borrow 550k because of the higher qualifying rate, what does it matter if you are only borrowing 450k to upgrade to your new property? Not everyone getting a mortgage is borrowing to the maximum limit they are approved for.
Kyle
at 12:02 pm
I noticed that strength has returned to all parts of the market. In terms of price, all home types are up Y/Y, both in the 416 and 905. Likewise for Sales, with by far the biggest gain in Sales being in the Detached market.
Also noticed that the MOI is ridiculously low. Only 2.3 months of inventory in all of the GTA, and in Toronto it is actually under 2 months.
Professional Shanker
at 1:41 pm
No debate on the Sept numbers in the GTA, those came in strong.
Seems like previously mentioned pent up demand (2018 buyers who deferred) has entered the market combined with move up buyers (condo -> semi -> detached).
Many areas of strength but one area of concern is 416 detached in Toronto West and Central is flat with increased sales, what do the bulls attribute this to?
York figures are up and primarily driven by many 2016 & 2017 specinvestors finally uploading their flips at ~30% losses. This is healthy for the market long term.
Appraiser
at 2:37 pm
So weak.
Professional Shanker
at 2:54 pm
will not bring myself down to your level…..keep trying though!
Kyle
at 3:12 pm
“Many areas of strength but one area of concern is 416 detached in Toronto West and Central is flat with increased sales, what do the bulls attribute this to?”
2 words – Sales mix. Average sales being flat doesn’t mean property values in those areas are flat.
I’m seeing transactions that were unfathomable even in the hottest of the 2017 Spring market. New records are being set each day.
Back in Feb 2017, $5.9M could buy a 5000+ sq ft mansion with a pool on a massive ravine lot in Forest Hill (1 Ridgewood). Today that gets you a nice semi with front pad parking on a 25′ lot in the Annex (21 Admiral).
Professional Shanker
at 3:22 pm
That was my initial thought as well. At some stage detached 416 should see an increase in average price.
Why isn’t the top end moving?
Kyle
at 3:51 pm
I agree at some point average detached in 416 probably will increase, but not everything moves in straight lines, nor do all brackets move in lock-step.
As for calling West and Central 416 an “area of concern”, i think the main concern for those who own homes in those areas, is what to do with all their new found equity.
Chris
at 3:47 pm
Agreed with much of Shanker put forward. I continue to think the market feels a bit odd these days. As David alluded to last week, it seems spotty. Definitely some areas of strength, which I again concede I did not expect at the onset of 2019.
I agree, there are some transactions that would have been unfathomable even in the hottest days of the 2017 Spring market; but conversely, there are some transactions that come in at or below their 2017/2018 transaction, such as 21 Heathdale Rd, 719 Euclid Ave., 68 Pricefield Rd.
The City of Toronto overall seems solid, with an MOI of 1.9, and some parts of the city as low as 0.9. The 905, a bit less so, with MOI ranging from 1.5 (Milton) to 8.9 (King). Given these stats, wouldn’t go so far as to say that strength has returned to all parts of the market. But in some areas, definitely.
Omar Khan
at 9:50 pm
I really think you should have interest rates next to the yearly prices. Weather it’s prime or what people are actually getting. It’s one of the biggest reasons prices are up, rates keep going down. Last year to this year on a 5 year fixed you are close to .6 % lower.
William Ramdass
at 12:49 pm
Point to add: new listings for each month of 2019 has been below the corresponding month of 2018 except for Jan.
Kyle
at 11:31 am
More good news for housing.
“Most of the growth was concentrated in Ontario, where there were 41,000 new, mostly full-time jobs last month, bringing the unemployment rate down to 5.3 per cent.”
https://www.cbc.ca/news/business/september-jobs-report-54000-1.5317636