

Are you a baseball fan? Yes, no, maybe?
Surely, you’ve heard of Babe Ruth, right?
In 1921, Babe Ruth hit a whopping 59 home runs, which broke his own major league record.
Six years later, in 1927, the Babe broke that record by one, swatting 60 home runs. That record stood until 1961 when Roger Maris broke Babe’s record by one as well, hitting his 61st home run on the last day of the season.
And then in 1998, Mark McGwire took steroids and hit seventy home runs, while Roger Maris’ two sons watched from the stands and pretended to be happy…
Most records are records for one reason: because they were so unlikely to ever happen in the first place. So when records are broken, it’s usually in an incremental fashion.
Mark McGwire broke Roger Maris’ record not by one home run, or two. Not by three, or four, or five. He broke the record by nine, which, as a percentage, is almost 15%.
The Toronto real estate market in the month of February absolutely obliterated several very notable records, not the least of which is price.
On Wednesday, I wrote the number: $1,045,488 on a sticky-note and pasted it on my office wall. I’m not being dramatic here; I literally sat and drank my afternoon coffee and just stared at that number. It was so impossible to believe, and so impossible to make sense of. But then again, after the month we just had, maybe, just maybe, it made perfect sense after all.
In my February eNewsletter, I wrote the following:
By the time April comes around, we’ll see an average GTA sale price well in excess of $1,000,000.
That was my prediction, and I stood by it, even though it would have represented a monumental year-over-year increase.
But here we are, looking back at the February stats, not April, and not really seeing anything resembling that $1,000,000 figure, as $1,045,488 is in a different tier altogether.
February’s average sale price is to January’s what Mark McGwire’s home run record was to that of Roger Maris.
So then is March going to be Barry Bonds?
To put this $1,045,488 in perspective, let’s look back at the GTA average home price since the fall of 2019:

Recall that in that starting in September of 2019, prices were stagnant throughout that fall market. From $843K to $852K and back to $843K in a 3-month blitz that represents the busiest 3-month period in the real estate calendar, traditionally.
2020 was obviously slowed due to the pandemic, but once we learned to transact in this new world, prices rose steadily from June through the end of the year.
Back in the fall of 2020, I figured that we’d see the average home price cross the $1,000,000 threshold in 2021, but I didn’t know when.
Fast-forward to early-February of 2020, and with that $967,885 price recorded in January, I was predicting that we’d cross $1,000,000 by April.
Not only did we cross that mark in February, but we smashed through it. Obliterated it!
And that increase from January to February represents a massive 8.0% month-over-month increase.
So if you’re like me, you’re asking, “Have we seen 8%, month-over-month increases before? And if so, when?”
Great question! Although, I asked it…
Dating back to 2012, here are the top month-over-month increases in the GTA average home price:
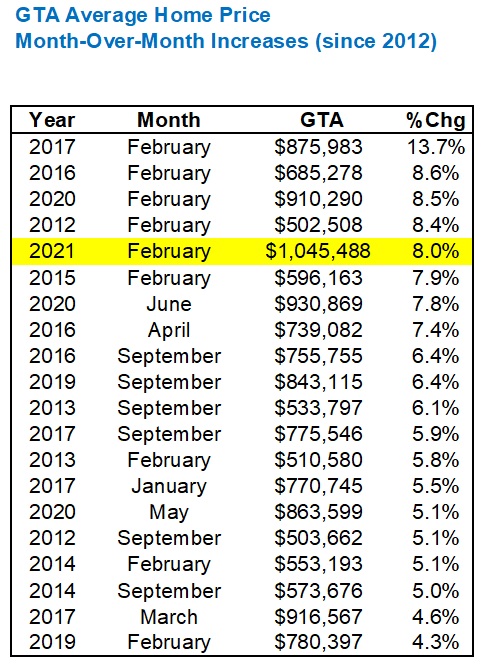
The top twenty is a bit much. I think you get the picture after the first few.
But I wanted to show you the top twenty because February is in there nine times! And if you’ve done the math on this, there are ten February’s included in the data set. So what does that say about February?
There are 110 months included in this data set and February makes up nine of the top twenty.
It seems to me that an 8.0% increase from January to February is really nothing to get excited about, even though I was excited about it all of last week. I mean, this February increase actually trails February of 2020.
Despite all this, I still can’t quite grasp the $1,045,488 figure.
And when it comes to the 416, the increase is even crazier.
We went from a January average sale price of $866,331 to a February price of $995,201. That’s a whopping 14.9%.
Let’s repeat the same data set with the 416 average home price:
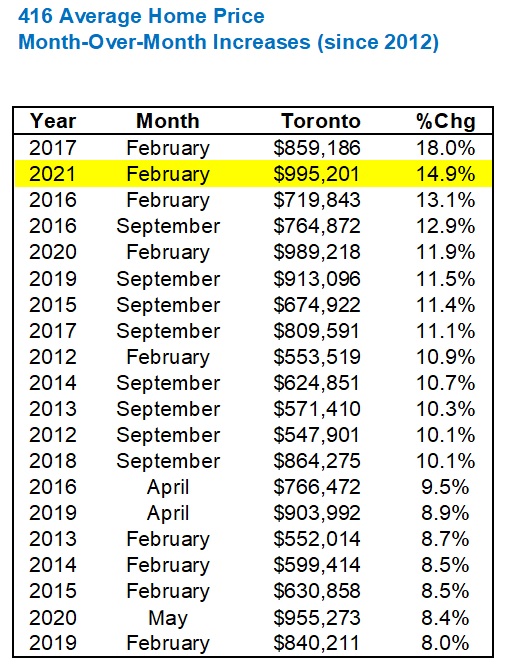
Interesting tidbit here: while the GTA’s average home price of $1,045,488 is a record, the 416’s average home price of $995,201, is not. The record 416 average home price was set in August of 2020 when the price hit $1,025,925. Try to make sense of that, if you will…
Now aside from price, the second most-notable statistic to come out of February’s TRREB stats are with respect to sales.
February saw a whopping 10,970 sales.
Crossing the 10,000 barrier isn’t rare, but it’s saved for the busiest months of the year.
In the 110 months tracked from January of 2012 onward, only 19 of those months saw more than 10,000 sales.
And until this past month, how many of those 19 were in the month of February?
Zero.
Here’s how sales in the month of February look:
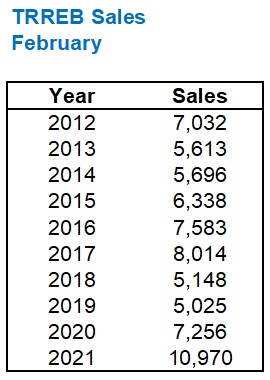
The previous record was a mere 8,014.
The 9-year average before this past month was 6,412.
So how can we possibly put 10,970 in perspective?
I honestly don’t know. Perhaps even more so than the ridiculous average home price, I honestly don’t know how to make sense of almost 11,000 sales in a month when that’s 70% higher than the average in that month.
To be fair, January saw a record number of sales too. So we went from a record-January to a record-February, and thus we’re keeping up a pace that’s already been set.
So along those lines, instead of comparing February to past February’s, let’s compare how the January-to-February performance stacked up against previous years to try and track that “pace” in the market:

This almost shows that record February sales figure in a different light.
Although we saw a record in February, we also saw a record in January. So those 10,970 sales, albeit impressive, are completely in line with 2020 from the standpoint of an expected increase, month-over-month, since both years saw a 58% increase.
Obviously, the 28% and 27% figures from the two previous years point to torrid months of February in 2020 and 2021, but look at 2016, wow! Now that was a February to remember!
In the end, prices in our market are determined by supply and demand, so if the demand for houses and condos results in a whopping 10,970 sales in February, and prices rose dramatically, then that must mean that inventory dropped, right?
No, it didn’t.
It actually skyrocketed!
Here’s new listings for both January and February, so we can look at how February of 2021 compares to previous February’s, but also to see how the expected increase month-over-month compares to the actual increase in 2021:
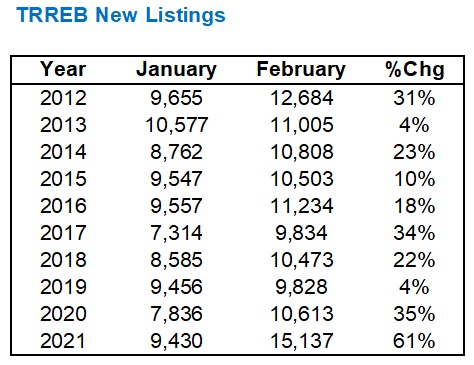
A record number of new listings: 15,137.
And a record percentage increase from January too, at 60.5%. Not even close to any other month since the start of 2012.
If you had told me that:
a) Sales will increase by 58%, month-over-month
b) New listings will increase by 61%, month-over-month
I would not have expected an 8.0% increase, month-over-month.
Now, as for how the market is absorbing the inventory, aka the “Sales to New Listings Ratio” or SNLR, let’s compare February of 2021 to past February’s:
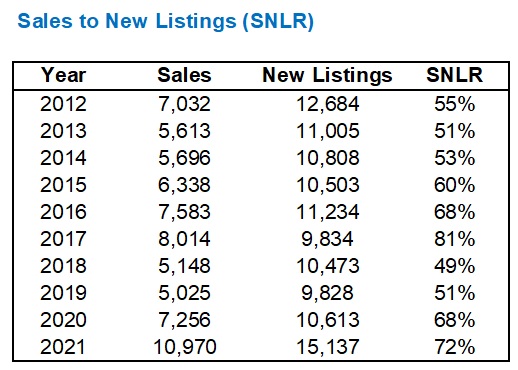
So we’re ahead of last year, but well behind the “crazy” 2017 market. That sounds about right.
SNLR stays pretty consistent in each month of the year, on a year-over-year basis.
Just look at this chart:
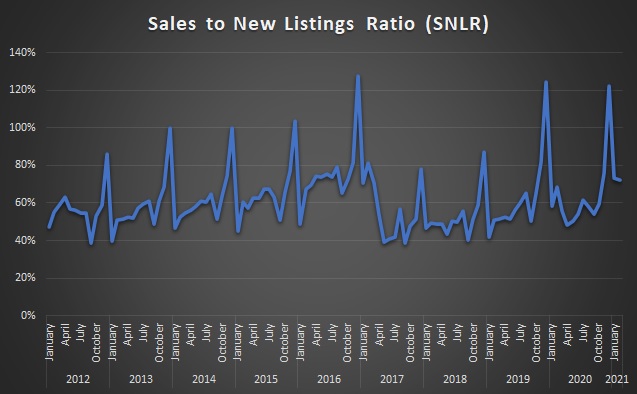
Relatively speaking, those peaks and valleys look quite similar, no?
My take-away from this month’s statistics is that both sales and new listings are up, almost in unison, and inventory remains very tight. But I marvel at the massive increase in prices as a result.
On paper, based on the supply and demand stats, I don’t think prices “should” have increased to that extent.
In practice, based on what I’m seeing in the market out there, I think prices could have increased even more.
I have so many stories to tell on TRB based on the last week’s experiences, it’s a shame I only post three times per week. 🙂
I’ll be back on Wednesday with another “Behind The Scenes” that I think everybody – buyers, sellers, buyer agents, and listing agents could learn from…


Razia Khan
at 7:23 am
What is the common man supposed to do? I want to buy a house. No big or extra ordinary but, cant afford. My budget went up from 7.30 to 9 but no luck. I even tried semi detached. That too crossed 9 lakhs . Thanks to multiple offers. Anyone can get mortgage approved for above one million but at the end of day should be able to afford to pay monthly installment. Thought cuz of pandemic ppl dont have money. But dunno how come ppl can afford to buy on much higher than the asking price. Prices are soaring high.I am just waiting for some miracle to happen when I can buy a house. It is sad.
Jeff Matthews
at 11:53 am
Buy a Condo. There are too many people in GTA for the average person’s first place to have Single home. Most of those buyers are move-up buyers who have big appreciation.
Either go vote for politicians who want to build out, or buy a condo.
Pankaj PATEL
at 7:23 pm
Happy to help you Razia. I am a full-time realtor since many years. Call us: 647-760-7061
http://Www.realtorpankajpatel.com
Geoffrey
at 8:19 pm
Wow that is tacky.
BHT
at 6:22 pm
Nice business plug on another man’s real estate blog…so lame.
JF007
at 8:24 am
I wonder how much of this activity is being driven by the investing group vs own to live group. And what would it mean to the sales and prices if say govt were to increase down payment requirement for investment property to say 35-40% as some reports have been suggesting that I read over the weekend. Some policy measures might very well be on the way in the upcoming budget to cool things down a bit..wait and watch time..but things are real crazy.. was roaming around GTA looking for an investment myself but prices to quality ratio was nothing to write about…I rather not invest than get sucked into a bad overpriced decision on a fixer upper over a million that needs another 100-150k of renovation…don’t envy the folks though who want to own to live… things not great for them right now..
Appraiser
at 9:20 am
Unfortunately. targeting investors, speculators, foreigners or any other imagined real estate bogeyman never works.
I admit though that the outcry from some of the chattering classes for somebody to do something is getting louder each week. Sadly, the Feds may well respond with yet more regulatory over-reach for political reasons. As if the mortgage stress-test and scores of other mortgage rules implemented since 2010 aren’t onerous enough.
Supply is the problem and more of it is the solution.
Build baby build. Especially rental and affordable housing.
JF
at 10:52 am
But supply at what cost…even what is being built is not cheap..all new builds with enough space for a single family are mostly in the 900’s range..i dunno if keep building mantra can resolve the sort of price appreciation seen in the last decade in Canada…not sure if anything can..a tax on primary residence capital gains tied to tenure of ownership to discourage home flipping maybe but very bad political and human cost so wont happen…or might given govt has to claw back what was and is being spent during this pandemic..or the other approach could be to go vertical instead of horizontal and detached/semi-detached ownership becomes destined to be out of reach for most.
Nick
at 11:37 am
I agree here. They always have one approach when it comes to this. Why is there no push to get more supply out?
Spend some government money cleaning up all brownfield sites around major cities. It would make it more attractive to developers and would enable them to build closer to city centres.
I know I’d rather live walking distance to things than out at the ends of Durham.
Libertarian
at 2:50 pm
“I know I’d rather live walking distance to things than out at the ends of Durham.”
Before COVID, most people would have agreed with that, but now that WFH is a legitimate possibility, most people want to live in the sticks because they get more house and land for less money.
Toronto is not getting any more subdivisions of detached houses. People have to give up on that idea. Never going to happen.
cyber
at 5:02 pm
Not necessary. This is a Toronto problem, not a Canada problem. Ironically, it may be up to Doug Ford’s discretion to solve it using the ultimate power province holds over cities (which are just “creatures of the province”, and whatever power they have is granted by the province and thus can be taken away).
75% of Toronto land mass is single family residential zoning (also known as the “yellow belt”, where generally only single family homes are allowed), 20% is employment lands, leaving a tiny fraction of the actual land mass up for development. No wonder developers build up! And the buildings get higher and higher as there’s less and less available land/redevelopment options remaining…
Most of the areas you would consider prime for walkable neighbourhoods, are actually in the “yellow belt”.
The State of Oregon in the US did a blanket up-zoning for the entire state. Bill signed in 2019 legalizes duplexes on all single-family zoned land in cities with populations above 10,000. In cities over 25,000, the bill legalizes triplexes, fourplexes, attached townhomes, and some “cottage clusters” in areas zoned single-family residential.
This is meant to encourage infill developments and “gentle densification”, and also allow access to desirable neighbourhoods to renters.
I would LOVE for Doug Ford to “stick it to Toronto” with blanket upzoning (this time, to affluent NIMBYs who are probably in the minority policy-wise, but over-represented in Committee of Adjustments meetings etc.)
Edwin
at 10:05 am
I really struggle to comprehend how sales can be so absurdly high for 3 months straight (and counting). Dec, Jan and Feb all had 50% more sales than a normal year. Where does all this demand magically appear from? And how sustainable is it over a long time period?
Appraiser
at 11:37 am
The theory last summer was that we had a late spring market due to lockdowns.
The spring market hasn’t stopped since.
Has the reaction to the pandemic greatly reduced or even removed seasonality from the real estate market ?
Caprice
at 11:17 am
Steve Saretsky has been on point recently, IMO:
https://www.youtube.com/watch?v=CB49Fn-TUU4
https://www.youtube.com/watch?v=2TFmi8QvP-0
Condodweller
at 1:55 pm
It looks like 2017 all over again. Are people buying first selling later still?
What about condos? I’m still not seeing big price increases there. I’m guessing institutional investors are scooping up units without going crazy on bidding.
Did we not expect listings to increase as prices increased? Perhaps, there were people who overextended themselves and now after a few $100k increases are cashing out and there’s plenty of demand to take it off their hands?
How about interest rates? Are record high rates not incentivizing new purchases before they become unaffordable?
jeanmarc
at 9:16 pm
I would like to see what happens when companies start calling people back to work and those who have moved out to the 905. Homes selling for average $900K in the 905 are now going for $1.3M+ in less than 2 years (i.e. look at the homes prices near the new Mackenzie Health hospital in Vaughan). MPAC is going to reap the property tax rewards. Greater traffic gridlock in the GTA coming. Worst is John Story’s ASE cameras increasing in the 6xith under 50km/h across the entire 416. No one seems to complain that these cameras were suppose to be in school zones but now showing up in non school zones (search 680news.com for this coming May’s release of new camera positions – smile guys and pay up). Traffic jam galore (road rage, more gunslingers on the roads) in the GTA as aka selfie boy (Trudeau) imports another 1.2M immigrants into Canada in the next 3-4 years (mostly settling in the GTA). Lovely times ahead in the GTA in the next decade+ to come.
jeanmarc
at 9:43 pm
There was a map (from 680news.com) a while back (a year or so ago) showing the average household/individual income per area in the 416. The average income in a number pockets did not reflect the cost of homes prices (meaning home prices were higher). For example, $38-40K and home prices were $600-700K in that area. Imagine how skewed it is now. Highly doubt people’s incomes increased 40-50% in the past few years when compared to the skyrocketing home price now.
jeanmarc
at 9:54 pm
Found it. It was back in 2017 from Toronto Star. Hover over and see incomes during 2016 consensus. Now compare the home prices of today. Have incomes increased the same amount to reflect home prices of today? For the average joe, increases usually follow rate of inflation.
https://www.thestar.com/news/gta/2017/11/09/do-your-neighbours-make-more-than-you-search-our-map-of-income-in-the-gta.html