
We need to know, otherwise, we’re consistently comparing apples to oranges.
The April TREB numbers were released last week, and the number being thrown around the most is “12.4%.”
That’s the average decrease in home price in the GTA, April-over-April.
But what if we look at what’s happening outside the central core, and compare the two areas?

Let me start off this blog post by speaking directly to some of the market bears and/or dissenters: you’re right.
You’re right to suggest that my constant complaining about the media using the worst numbers they can possibly find to show the market in a worse light, all in the name of selling newspapers, is offset by the media also using the best numbers they can possibly find, to show the market in a better light, when they feel like it.
It all depends on what you’re trying to sell.
Are we selling mania today? Or are we selling doom-and-gloom?
I guess the moral of the story is, there’s no point in selling the absolute truth when you can sell a better, sexier, wilder truth. Right?
Ever since I saw the CBC headline showing “Toronto Home Prices Drop 35%” two months ago, I’ve been keeping a closer eye on the headlines.
Recall this:

When sales dropped 35% from February of 2017 to February of 2018, the media pounced on this number, and clearly wanted to make the dip in the real estate market worse than it was. Call this a Freudian slip, or call it a mistake, but either way, the agenda is obvious.
But a lot of the TRB readers are right. When the market was red-hot last year, the media was pumping the tires of the market. Not quite Pitbull, Sylvester Stallone, & Alex Rodriguez up on a stage with laser-lights, but if you were a layman, you might come to the conclusion that the Toronto real estate market was heading to the moon and never coming back.
So now that the media has switched gears, and are giving us headlines with things like “…….lowest in 30 years,” forgive me if I’m looking to cut through the fluff, and look at what’s really going on.
I’m not Donald Trump; I don’t consider that “fake news.” In fact, I don’t blame the media; I blame the readers for not delving further into the story.
Case in point, if the headline reads, “The market declined 35% last month,” how many people will read the whole story, and realize that the “decline” was in sales, not price? Call me a pessimist, but whether it’s smart-phone users browsing headlines on Facebook feeds, or passer-byers looking at the front cover of a newspaper, I really don’t know if people want to know what’s going on out there.
That’s not to take anything away from you folks. The TRB readers on here? The people who post daily comments? You guys are collectively in the 96% percentile of general real estate knowledge. But what about the rest?
I just got off the phone with a young agent looking to start her career, and asking to pick my brain. She said, “I don’t know if now is a good time to start, with the market being so bad and everything.”
Come again?
Which market?
She was honest, and said that all the headlines she reads are awful, and all her friends in their early 20’s are lamenting that they can’t afford what they want. But market realities, headlines, and millennial-wants in 2018 are three VERY different things.
The GTA average home price this past month was down 12.4%, year-over year. That’s an average of $804,584 this April, compared to $918,184 in April of 2017.
But to suggest that this represents “Toronto-proper” is inaccurate.
I think a quick refresher on the GTA is prudent here, both for those that know it, but can’t picture it, and for those that pretend to know…
We have five areas:
1) City of Toronto
2) Peel Region
3) Halton Region
4) York Region
5) Durham Region
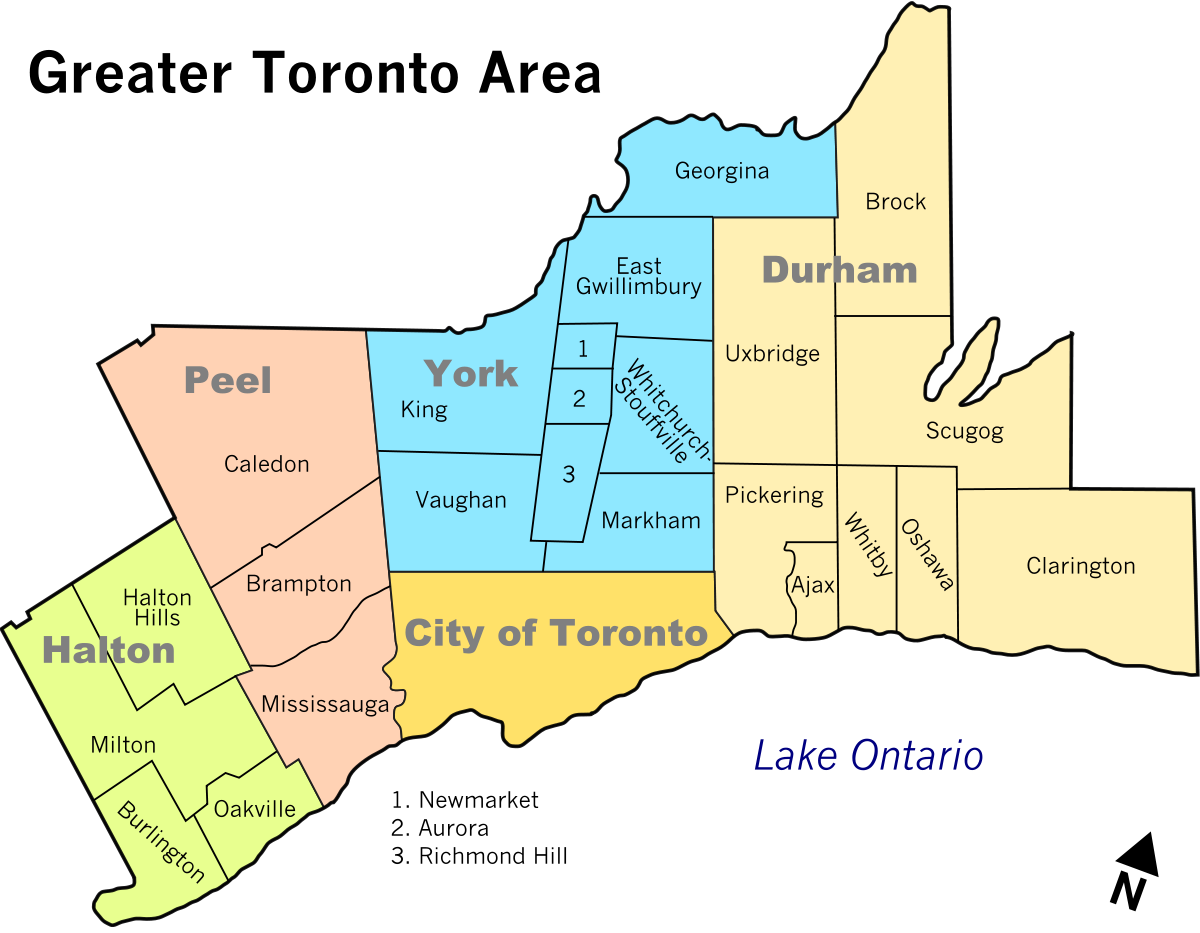
Ironically, “Toronto-proper” is the smallest of the regions that collectively make up the GTA.
It’s important to note that Simcoe County and Dufferin County are also a part of TREB, so while they aren’t part of the GTA, they are part of the “GTA-price.”
The City of Toronto is the most dense of the five regions of the GTA, and home to the most people. I might offer that it’s the most……..important(?) area to examine in a discussion of the overall Toronto real estate market, but try telling that to somebody who lives in Scugog…
So when we discuss Toronto real estate, what exactly are we talking about?
What would you guys think we mean?
Do we mean the GTA, or do we mean the city of Toronto?
To be quite honest, I would put Burlington in a different hat. I certainly would put Hamilton in a different hat, so where do you the draw the line?
I think a lot of the readers would agree, to some extent. Simcoe County, Clarington, Caledon, Milton – we’re not really talking “Toronto.”
But Vaughan? Mississauga? We’re kissing-cousins!
Where do you draw the line?
That’s why I think it’s so important to break free of these blanket-statements made by most people that simply refer to the average-GTA sale price.
And today, I want to look at the GTA as a whole, and then as individual parts, and then break down Toronto’s market even further.
So first and foremost, where is the Toronto market at the moment?
Take a look:
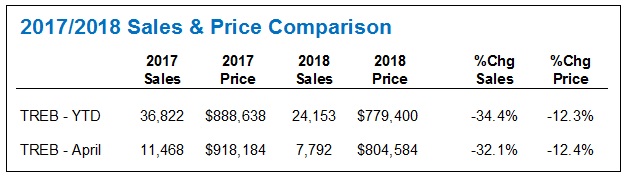
Recently I’ve been looking at both month-over-month statistics, as well as year-to-date.
Consider the YTD to essentially be a moving-average.
In this case, both tell essentially the same story: prices are down 12.3% YTD and 12.4% in April, and sales are down 34.4% YTD and 32.1% in April.
But that’s GTA-wide.
What about the regions?
Let’s look at the YTD stats for all of the areas that make up TREB’s “Average Toronto Sale Price,” as well as the sales volume:
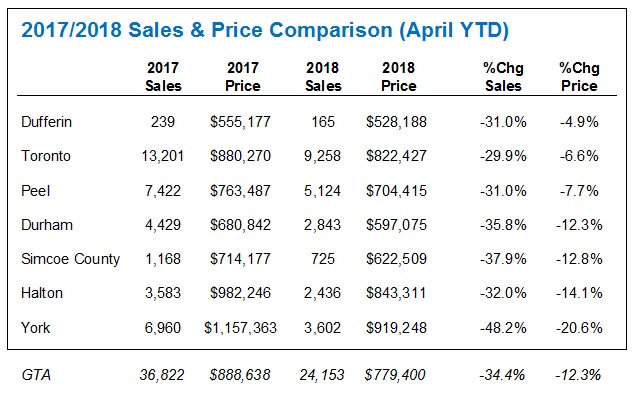
Interesting stuff, n’est pas?
With only 165 sales YTD in Dufferin, we could scrap it. Same goes for Simcoe County, as neither are technically part of the GTA. But it would skew the overall TREB data, and I don’t think their inclusion in the data changes the picture, so we’ll leave it. The only thing I will say is that the 4.9% drop in average home price, based on 165 sales YTD, doesn’t have the same foundation as something like 7,000+ sales would.
These are in order of %Chg, and as you can see, York Region has been hit hard.
A 20.6% YTD decline in average home price, which is actually worse than the 12.3% YTD decline in the GTA.
On the other hand, Toronto and Peel Region come out well ahead of the GTA figure, down ‘only’ 6.6% and 7.7% respectively.
So if my Toronto-bias were showing, I’d suggest that this 12.4% decline in average sale price in “Toronto” that the media is touting this month, after the 14.4% decline they touted in March, is not accurate in the context of what most consider to be “Toronto.”
At the very least, it’s prudent to distinguish between the GTA, and the City of Toronto.
Because I have the odd client that purchased in March or April last year, who asks me, “Is my home really worth 12.4% less than it was last year?”
My clientele is more astute, and thankfully only a handful are prone to taking a headline at face value, but no, their homes aren’t worth 12.4% less than last year. On paper, overall, on average, they’re worth 6.6% less, taking the Jan/Feb/March/Apr “moving average” that is the YTD sales.
But what if they’re in a semi?
What if they’re in a condo?
What if they’re in the once-holy, now-declining detached?
Worry not, I use those descriptions of detached homes facetiously, since the detached home is, and always will be, the Holy Grail of houses, and I don’t actually believe what the declining numbers say (more on this in a bit).
But now that we’ve established that the decline in “Toronto average home price” is essentially double that of “City of Toronto” properties, let’s break it down by house type.
Here’s the April (note we’re not using YTD here) average home price for each of the four major property types: detached, semi-detached, row/townhouse, and condominium, put up against the GTA average home price on the left, and then the HPI (416) on the right:
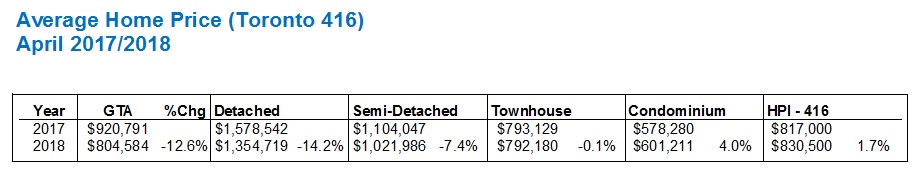
Here’s where the fear sets in for many detached owners.
14.2%?
That’s worse than the 12.6% GTA average decline, or even the 12.4% YTD!
But once again, you can filter by area, and see what is really going on.
For this experiment, I went straight to MLS as I wanted to break things down by location and property type, which TREB Market Watch does not do. I also enjoy pouring over thousands of lines of data in Excel…
I looked at C06, C07, C14, and C15 together, which is essentially Dufferin, Steeles, Victoria Park, & Hwy 401. Reason being, we know how York Region has done, but what about the northern-most part of the City of Toronto?
What I found was quite honestly exactly as I had expected:
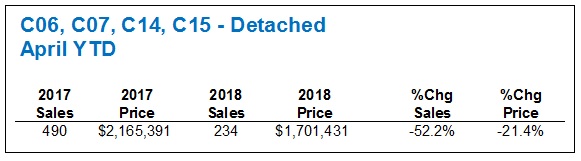
The average price of a detached home, albeit in a smaller sample size, is down 21.4% since the same period last year.
I was showing these stats to a colleague today, saying, “It’s only 234 sales, the sample size is small, and the 21.4% number could be way less, who knows.”
My colleague replied, “True, but there’s an exactly equal chance that it’s way more.”
Touche!
So while the Toronto-416 detached home price is down 14.2%, if you look at some areas of the city – in this example, north of 401, south of York Region, we can see that some areas were much harder hit.
Average that out across the various neighbourhoods of the City of Toronto, and I’ll think you’ll find there are some areas where detached prices are only down 3-4%, in the face of much steeper numbers. Ask active buyers, and buyer-agents, and they might argue there are some areas where prices are flat.
Shifting gears in two ways now – looking at semi-detached, as well as an example of where the decline is much lower, let’s look at the east side.
E01, E02, E03, collectively “the east side,” and let’s hone in on a very specific property type: semi-detached, 3-bedroom houses.
Sure, the sample size is smaller when we hone in. But I’d argue that eliminating 2-bedroom and/or 4-bedroom semi’s is going to give us a better feel for the market.
Keeping in mind that the average Toronto-416 semi-detached price is down 7.4% in April, here’s how things look in E01, E02, E03:
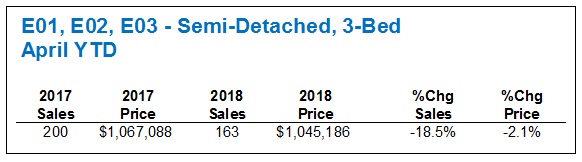
Down 2.1%.
That’s effectively a rounding error, and two points on either side brings you to yet another modest 4%, or even par.
I think you get the picture here.
My conclusions are the following:
1) The decline in GTA average home price, being applied to the “City of Toronto,” is extremely inaccurate.
2) The further you are from the central core, the softer the market.
3) Within City of Toronto, some areas are flat, some are worse than the 416-data shows. Once again, it’s all about the core.
4) Most property types and/or neighbourhoods in the central core of Toronto (save for condos, which are up) have seen only a modest decline, if any.
5) As we all know, 416 condo prices are up 4.0%, while the GTA average is down 12.6%. I didn’t even touch on this today, since I’m pretty sure most in the know are aware.
So have at it, folks.
I welcome your feedback.


Appraiser
at 7:33 am
Excellent analysis David. Confirming once again that real estate, much like politics, is local.
Housing Bear
at 10:25 am
If local then how come all of these areas had explosive growth over the past five years?
Heres todays lesson for you appraiser.
Generally speaking something is worth what someone is willing to pay for it. Higher demand and lower or stagnant supply can create additional competition and upward price movement as those with more cash will bid higher to win. In RE however, something is only worth what someone else is willing and ABLE to borrow for it (most people cannot buy in cash).
In high tide (lots of easy cheap money going around) all ships float higher. When the tide goes out…….. you get the point.
Assets dependent on debt financing all function like this. “Tide going out” does not always translate into a big or severe crash (although over the last ten years the tide has never been this high). It all comes down to how much bad debt is out there, which only gets exposed as the tides start to move out. The tides move slowly in RE. It can take several months to play out. Lots of bad debt equals lots of liquidation.
My question to you is do you deny asset bubbles are possible (even in Canada) and if not how high would have prices had to have gotten or at what rate of growth before you would think “Ok this doesn’t make sense anymore, we are clearly in a bubble” For me it was the 30% appreciation we started to see at the start of 2017 and when some crappy detached bungalow around the corner from me sold for 1.2 million at the end of February 2017. Called my agent up and had my place listed and sold by the first week of April 2017.
Not Harold
at 11:31 am
What I see in this data is a pullback in people who are overextending themselves – or at least whom many of us, the BoC, and various governments think are at risk of being overextended. So areas that were part of the drive ’til you qualify and those that are very popular with “totally legitimate businesses in foreign countries” are seeing severe declines.
Areas that have natural local demand are holding up pretty well or even increasing. The upward move in condos being a side effect of the restrictions – people who can’t qualify for a 1.2MM 3bd semi increasing demand for 2bd condos and the dominoes continuing on down the line.
Overall we should see a continued secular trend of substantial increases in core areas (houses along lines 1 and 2), decent appreciation for south Sauga and Oakville, and substantial increases in accessible areas that were previously working class (little italy, parkdale, leslieville..) as owner occupiers move to nursing homes and cemeteries. Toronto is a MUCH bigger and MUCH more important city than it was 40+ years ago while core adjacent housing stock hasn’t kept pace. Just take a look at the original houses in Hogg’s Hollow, Don Mills, Bedford Park, Lytton Park, Davisville… We can easily see a cyclical pullback in these areas (and are seeing it in prices flatlining and some flippers getting annihilated for over-renoing) but there is a long term reason for appreciation (including dramatic appreciation when houses get doubled or tripled in size and target market goes from junior bricklayer to mid-career lawyer/investment banker).
Housing Bear
at 12:15 pm
I agree that so far the pull back has been with people who over extended. I just do not believe we have even started to scratch the surface in regards to how many did so.
Drive till you qualify or downsize from house to condo until you qualify is the same in my books. For younger generation, if you do get trapped in a property due to price drop I would rather it be a house where I could start a familly rather than a 1 or 2 bd condo.
I lived in Davisville and now live in Leslieville. Lived in Little Italy when I was in University back in the day. It was much easier and faster for me to get DT from Davisville then either of the other two areas. How far can Davisville fall before people are willing to leave the “True Core” ……. its a ten minute subway ride from Davisville to King station.
Brick layers vs lawyers – Ok well how come we have not seen a big increase in average income?
Will certain areas hold up better than others. 100%, however the factors that led to everything increasing, once reversed, will have the opposite effect.
Long term will prices go up. Yes. Despite several corrections over the years, this has always been the trend. As long as our currencies keep devaluing, or our incomes start to go up more this should hold true. The scary thing is prices have risen much much more than incomes have. This is do to more and more debt.
The secular trend you mention can be described in much simpler terms. Rates have been falling for the last 30 years. Yes there have been some spikes up here and there but as a trend it keeps going down. We got as close to 0 as possible. Are negative rates possible for your savings – YES. Will a bank every offer you a negative rate on your mortgage (IE the pay you a percentage of the loan each year) absolutely not.
Is Toronto more important than it was 40 years ago to Canada. I would say so, but back in the last bubble it was the same story as today. World Class, rich foreigners (Hong Kong back then), new preference for care free condo lifestyle yada yada….. I also do not believe we are more important than New York or London who both had big crashes 10 years ago and appear to be falling again today.
A
at 1:17 pm
One of the effects of the financial crisis is that the wealthy got wealthier. So it is not just debt that is fuelling the prices.
Also, there are, what, 3,000 newly qualified lawyers every year. Is this pool big enough to cause a shift average income?
Not Harold
at 1:49 pm
Davisville is in my core area: it’s adjacent to Line 1.. there’s even a station named after it 😉 I expect to see substantial gains here as houses get gut renos and massive additions.
I didn’t say bigger than NYC, just that the city has moved up a lot nationally and internationally while housing is adjusting slowly (the big 89-95 real estate down cycle saw excessive retrenchment). And I did say we’re likely to see cyclical down periods, just like NYC and London are seeing and have seen.
You can easily start a family in a 2bd – heck even a 1bd. Lots and lots of successful professional families in condos in the core who only move when pregnant with 2nd kid or when first kid is 3-4. Partly due to saving an extra few years for the house, partly because of convenience of commute before you need 3 beds or a school. And many mid level families are staying in condos that are seeing schools delivered next door (City Place, Sheppard…)
On income changes – takes a LONG time to show up in statistics. Was talking about Leslieville improving 13 years ago and a good place to buy houses. Has come a long, long way since but very far from being all professionals. Little Italy has lots of houses rented out (cheap) as apartments, owned by old Italian families. Can easily be 50+ years between purchase and next sale – buy with husband 30 or 35, wife 5 years younger, sell when wife is 84… That’s 59 years.. And then income goes from $20k or less to $300k+++ you’ll see it over 2-3 census periods.
Housing Bear
at 2:04 pm
My whole argument is that area isn’t going to make much difference at all. This will come down to a classical credit cycle contraction.
Would 3000 lawyers a year pull up the average. NO . My point is that incomes in general have barely gained an inch in the last 20 years. So how are average Canadians buying property…… easier and more accessible debt. The fact that the wealthy have gotten wealthier only strenghthens my argument. The average person hasnt seen the gains….. how do they still buy? Debt. How many super rich people who pay cash do you know? I know several average canadians who own property here.
You have pointed out that there has been a big move to affordability. IE Condos. You have also acknowledged that flippers in Davisville area (or at least some of them) built way too much house. Yet prices will keep going up in Davisville because the houses keep getting bigger and bigger……. got some 1984 double think going over there. Who are going to buy all these mansions?
And sure you could have your first kid in a condo. Lots do, but most then try to move once the kid gets older or to have a second child right? The issue is if your condo is underwater when you go to sell. Good luck getting a bank to allow you to carry that loss over to a new property, where you will be more in debt. You are trapped in that condo unless you want to lock in your loss (if you can do so withoout bankruptcy), or you go bankrupt and start over. Hopefully your parents can bail you out.
Not Harold
at 3:05 pm
Housing Bear – your earnings stat is not substantially correct and is misleading.
On a National level, women’s average and median real wages have increased substantially while men’s real wages have increased very moderately, using 1981 to 2011 data (Evolution of Wages in Canada over the Last Three Decades, Stats Can, Morissette, Picot, and Lu). Further there has been a substantial change in wages by age cohort. 17-24 men have seen drops of 14% median and 13% avg, women dropped 6.5% median and 3% average, while 45-54 cohorts saw men UP 13% med, 17% avg and women UP 30% med, 32% avg, 55-64 saw men 17% and 20.5% increase, women 23.% and 30% increase.
You’re seeing massive delays to entry into workforce, massive returns to education, much higher lifetime earnings, and dramatically increased household income. Plus these are national numbers – Toronto’s workforce is not just larger than 40 years ago but dramatically more white collar and educated.
This data supports higher overall prices and substantially increased demand for Upper Middle Class family homes. We’re not talking about the average Canadian. We’re talking about the top 30% if not 15% of people in the GTA. The “average Canadian” working at Ford, GM, Honda, or Toyota is buying in St George, Courtice, Essa, or Ingersoll.
So you see very large secular drivers of demand in prime areas, leading to an expansion of prime areas and dramatic change in housing stock. Yes there are and will be cyclical reverses, 2017 was completely insane, and marginal areas got way out over their skis but you are arguing a secular bear market where the conditions don’t support it.
A severe recession could bring back 87-90 housing market, and I’ve been feeling housing was overheated for over a decade (mainly due to hangover from seeing the market flat for a decade previously). Not sure there are conditions for it but you never know. 5-10 years of flat or 2-5% annual price increase would put the market in a good place. It would be very hard on speculators but fine for traditional life stage buyers.
You seem to feel that we’re going to be Venezuela next Tuesday. Even Venezuela took 2 decades to its current spot.
Housing bear
at 9:31 pm
A few comments on income. I did not take a deep dive into the various segments of income earners. I just used the stats Can study from 2015. Between 2005-2015. Toronto average household income grew a whopping 3.3 percent (not annualized) I believe growth has been stronger the last 2 years. 20 years was perhaps an over statement.
That being said, if 1981 is your base year I would expect much larger growth for females. Women’s rights movements in the 60s. 20 years later you get the first wave of women who have been raised expecting to work and thus build skills their entire lives. High growth in 45-55 segment is really good for those that bought 20-25 years at much lower prices probably have paid down most of their debt. Hopefully they can bail out their kids and have been using their house as atm, or to speculate on more property. Scary income stats for the “peak millenial” generation that do stay in school longer (student debt) and if owners probably bought their place in the last 1-5 years at much higher prices.
Also I posted a good article above. Research showing speculators with high credit scores accounted for the bulk of defaults in the US. Much more then the subprime borrowers. Although these high credit/ high net worth folk did use subprime loans. Liked the teaser rate, interest only aspect I would guess
Housing bear
at 9:48 pm
*have not been using their houses as atms
Not Harold
at 9:59 pm
Bear –
I did a deeper dive, trying to look at real drivers of the housing market.
The city has 31% of people (with jobs) below $20k annual income and 10.5% above $100k. So mean or median income don’t tell us anything about people buying detached or semi detached. It’s all about how the subgroups are doing. $100k gets you at most a $452k mortgage from CIBC today! All of our interest is in people with top 10% incomes and/or substantial family wealth. Average Canadians matter for houses in Windsor, not Toronto.
Might just be my environment, but lots of people I know buy houses in their 40s and 50s – very few people are buying in their late 20s/early 30s in Rosedale/Lawrence Park/Forest Hill. Drake, Westons, Eatons.. sure but not “normal” professionals like doctors, lawyers, investment bankers…
Your Arizona data makes sense.. prime borrowers overextending to buy 5 houses, etc. Big danger in condo market – we don’t know how many people are swimming naked.
Housing bear
at 10:12 pm
Not next Tuesday. But for those that think that while the FED raises the BOC can just keep rates down for ever, (even though mortgage rates are significantly more tied to bond yields, which are tied to treasuries) should be reminded of Venezuela as a potential long term consequence of such a strategy. An unlikely outcome but even going to a 40-50c dollar would be terrible for Canadians. Think about how much we import, plus we wouldn’t want our level headed commander in chief to the south to start labeling us a currency manipulator
Housing bear
at 10:37 pm
Yes but if more and more rich people are occupying the core and Toronto proper and poorer people are getting pushed out to burbs should this alone change the composition of high income to low income and then as a result push the average and medians higher? Even if no one within their respective groups got a raise?
Assuming a normal distribution, the bulk of. That 10% above 100k are probably pretty close to 100k.
Also, if the core areas for the wealthiest (rosedale/ Forrest hill, LP etc) are circled by falling home prices to the north and condos to the south will that not start to pressure them? I would travel an extra 4 subway stops to save a butt load of cash.
Not Harold
at 1:13 am
Bear,
The numbers show that it’s not a normal distribution and if you look at the Star’s income map by census tract you’ll see core areas have VERY high incomes. Gentrifying areas like Bellwoods, Little Italy, and Leslieville are around average thanks to large number of renters and long time residents.
My entire thesis is that we have many more people that are making much higher wages, which pushes up demand in areas that were not doable 10-20 years ago. See Parkdale, Junction, W Queen West… that’s the secular demand driver and why you see houses getting gutted or dumpstered all over.
As to subways and buttloads of cash… nope. One thing matters: schools. Great public schools and, ideally, access to private schools. So Leslieville and Bellwoods are still mainly starter home only with a move to Riverdale, Leaside, Moore Park, LP, etc by start of Kindergarten or at least grade 2 or 3. Everything between Rosedale and York Mills is fine, after that not great and anything east of Pape is highly questionable. Going west primaries are ok once you get to high park but highschools are highly variable and it’s hard to get to a private school.
Housing Bear
at 7:03 pm
You know what. If the super rich or that 10% of upper earners represent the 8% of households that hold 20% of all mortgage debt then maybe things will be ok. At least from an ugly debt deflation scenario. Guess there is no way of proving who owns what right now. We will have to wait and see
Housing Bear
at 7:08 pm
*Provided they are in it for the long haul as well
Housing bear
at 7:23 pm
“A lot of people are literally on the brink of losing their home or having to sell,” she said, adding that she has advised some to consider the latter option because they have re-financed their homes to the point where they have no equity remaining.
Doesn’t look like it though
https://www.thestar.com/business/real_estate/2018/05/10/higher-interest-rates-add-to-home-buyer-struggles.html
Joel
at 8:48 pm
I agree with the increase of the house class. The land transfer taxes and increased population are making working class neighborhoods into professional neighborhoods.
Once neighborhoods like lislieville increase to be the same as davisville we will see buyers turn to davisville again and drive prices up there.
Appraiser
at 1:07 pm
Real estate is local in the sense that most people are concerned about what is happening on their street or in their neighbourhood, which can vary greatly from other areas.
What I can’t quite fathom is why you bought a home in the first place, only to sell at the first sign of a downturn. Now it appears that you are going to great lengths to convince yourself that you made the right decision.
Belief perseverance: “The tendency for people to hold their beliefs as true, even when there is ample evidence to discredit the belief. When faced with evidence that contradicts their beliefs, people may choose to discredit, dismiss, misinterpret, or place little significance on the contradictory information.”
Chris
at 1:27 pm
Why would Housing Bear need to try and convince himself? If I recall correctly, he said he was in a detached home in Toronto, and sold April 2017; clearly, he timed the recent peak. It remains to be seen if the price decline continues, or reverses, but as it stands right now, Housing Bear is almost certainly up.
You also failed to answer any of his questions. Great job on the AP Psychology copy/paste definition though.
Condodweller
at 2:03 pm
@Appraiser You do realize that definition works both ways, right? Before you cut and paste definitions you should apply it to yourself first. It’s ironic that you would post this in the very article where David has presented the numbers where save for condominiums ALL housing types in ALL regions are negative for YTD/YoY and MoM numbers are only going up due to seasonality. How much evidence to the contrary do you require before you concede that the market is heading down?
Chris
at 2:24 pm
Come now, Condodweller. That would be far too introspective for appraiser. To expect anything beyond raging-bull sentiment, and expletive laced insults from that troll is to set yourself up for disappointment.
Appraiser
at 4:42 pm
Hey @ Chris, Your nit-picking is boring and pedantic as usual. Where’s the principle re- payment and subsequent equity build-up Housing Bear would have gained had he stuck it out.
Half-baked? You’re not even in the oven.
Chris
at 5:56 pm
Hey @appraiser, did you make yet another error and reply to the wrong thread? Not surprising.
Sorry that you find my pointing out your mistakes “boring and pedantic”. I’m sure you’d much prefer we all just glossed over your inaccuracies, omissions, and flat out falsehoods, and took your garbage at face value, but alas, that’s not going to happen.
Where’s the investment returns Housing bear has earned on his presumably invested money?
Ah, another personal insult. Typical, low brow content, from a typically low brow troll. You’re just embarrassing yourself at this point, buddy.
Appraiser
at 6:30 pm
@ Chris: Splitting hairs, a manic obsession with minutiae and missing the big picture seem to be your greatest attributes. Congrats.
Chris
at 7:07 pm
Ah, appraiser. Lost yet another argument and once again resorting to attacks and diversions. Classic troll-like behaviour.
Until you’re able to debate topics logically and coherently, without resorting to hypocrisy, insults, profanity, and other fallacies, you’d be wise to slink off with whatever dignity you still have intact.
Housing Bear
at 1:50 pm
Unlike you I acknowledged what I will have to see before I abandon my thesis. What is the mortgage/debt market telling us in the fall or by the end of this year. Have also acknowledged that if I am wrong I will jump back into the market. If the price of a detached climbs 14% between now and then I could buy for the same price I sold at. Down a bit due to transfer costs and the rent I am paying this year, but that is the risk/reward calculation I committed too. And I got some good years out of that property………though I got way better gains. Gains which I have locked in. No debt, no stress watching rates go up.
Appraiser
at 4:04 pm
On a 900,000 sale, that’s $45,000 in commission plus legals to sell, plus moving costs, not to mention the stress of moving and uprooting yourself and family (if that applies). To buy back in at the same price will cost at least $30,000 in land transfer tax , legals and moving costs, not to mention uprooting yourself again.
Add in the rent you’ve squandered ($25,000+? per annum) in the mean time, and your out $100 G’s.
Chris
at 4:25 pm
Where’s mortgage interest (assuming Housing bear had a mortgage still), home maintenance, insurance, property tax, etc., in your calculations?
Half-baked math, at best. But we’ve come to expect that from you.
Housing bear
at 9:46 pm
If prices get back to April 2017 by end of year than yes. Needs to grow by 14%, possible yes. Right now I’ve been following comparables, and feel like with costs and everything else taken into account I would be up about 50 to 60k. No where near the dollar gains some of you long investors have been use to. But hey, even a broken clock is right twice a day
Ben
at 9:05 am
It takes a lot of time and effort to get the facts in an impartial way and build sufficient knowledge on which to base a conclusion. Unfortunately many mainstreet media and people don’t do it and their pre-established biases kick in when searching for facts. Good analysis David.
Chris
at 9:09 am
Compared individually to the other regions, yes, the City of Toronto probably is the most important area, with a population of 2.7M. However, the GTA as a whole is home to 6.4M people, meaning more people live outside of the City of Toronto (but within the GTA) than live within the City itself. Hence, I would argue it makes sense for headline figures to be for the overall GTA market. A headline figure will never be granular enough to accommodate everyone, but that’s not really the point of it; it’s to offer a high level view of the overall market as a whole.
Anyone with a modicum of sense should realize that this headline number will likely not perfectly align with their individual situation, just like the CREA Canadian market data doesn’t perfectly align with each regional market. But, for those who are interested, it is straightforward enough to open up TREB’s report, and find the area and home type that is most relevant to them.
And for those who prefer graphic visualizations, someone was kind enough to make this:
http://torontorealestatecharts.com/
It doesn’t break down all the neighborhoods and homes types of Toronto, but splits out detached from condos in the City, as well as detached in different areas of the GTA.
But alas, none of this will help those who only read the headlines, and don’t delve into the story or do any further investigation. We can’t rightly expect these people to have anywhere near a comprehensive understanding of this, or really any, topic. C’est la vie.
Chris
at 9:20 am
On an unrelated topic, Housingbear, this article might be of interest to you:
https://www.bloomberg.com/news/articles/2018-05-09/for-3-4-million-subprime-canadians-poloz-can-t-go-slowly-enough
“A non-subprime person might say, ‘Well, what does that mean? That’s one dinner I could do less in a month,’” he said. “For subprime, and we see this every day, when they are budgeting down to every C$10, this is a lot.”
Sounds very similar to the discussion had here a few days ago.
Housing Bear
at 10:27 am
These are the real stories to keep an eye on. If it turns out there is not a lot of bad debt out there, and we do not start to hear more and more stories about financial ruin, then I will have to concede defeat, and jump back into the market. I think by the end of this year we will have a much better grasp of how far this will go
Professional Shanker
at 2:02 pm
All comes down to employment as it always has, if the economy turns and unemployment increases, it will start the snowball. Similarly, if people stay employed they are likely to continue paying debt and any defaults are likely to stay contained and not disrupt the market.
Tommy
at 4:33 pm
Even with 100% employment, real estate prices are tied to actual incomes. There comes a price point that is prohibitively expensive for most. Toronto proper is resistant to corrections (which is one reason why I buy in the city rather than the burbs) but not immune to it. It now takes $100k annual incomes to buy an average condo. If the price of an average condo keeps increasing eventually the pool of buyers runs dry.
The high employment argument was made in 1989 too right before things tanked.
Appraiser
at 5:08 pm
Dear god, not another 30-year old reference. Why not go back to 1929?
Chris
at 6:03 pm
Dear god, not another whiny appraiser gripe, complaining whenever someone references situations from another date or place.
Condodweller
at 6:39 pm
@Appraiser Have you heard the saying that those who ignore history are doomed to repeat it? I just saw the corollary to that which may apply to you better: “The only thing we learn from history is that we learn nothing.”
All the bulls have commented in the past that 89 was different. The circumstances were different but it is the closest we have to the same point in the cycle to today for comparison i.e. 89 was the top of the cycle as 2017 may have been the top of the current cycle.
Housing bear
at 9:56 pm
I covered this yesterday. My thinking is that even flat prices for an extended period would lead to arecession. Much of Ontario’s GDP growth over past decade has come from real estate and related sectors, albeit the snowball effect here and it’s magnitude will come down to how many individuals in those sectors drank the koolaid and are too exposed
Housing bear
at 9:56 pm
At shanker
Professional Shanker
at 12:10 pm
I appreciate your train of logic but I am not sure a slow down in RE (flat prices I consider a slowdown as servicing debt with no appreciation is akin to renting) will necessarily trigger a wide spread recession which would lead to significant job losses. That said the entire RE industry/spec flippers are in for a rough ride if the market goes sideways and interest rates continue their ascent upwards.
Chris
at 3:32 pm
And just like that, the B20 stress test ticks upwards yet again, as bond yields climb and banks raise rates. And all this without Poloz lifting a finger.
https://www.theglobeandmail.com/investing/personal-finance/household-finances/article-canadas-mortgage-test-just-got-tougher/
Housing Bear
at 10:38 am
Heres a good little read. 1 page article from the early 90s talking about the fallout to the condo segment. Back then we got a 50% correction when only 40% of sales were to investors.
https://twitter.com/ExtraGuac4Me/status/993800713653305346
Condodweller
at 2:50 pm
@Chris You cannot compare Canadian sub-prime mortgages to what was going on in the US in 2007 and prior. In the US it was an all out fraud where people were “forced” into buying houses in some case that they didn’t want lured in by extremely low rates that were sure to go up in the near future using NINJA loans. All these mortgages were bundled into financial instruments which were then sold as safe investments back to the public. It’s possible that some B lenders, I don’t even want to call them sub-prime, are fudging incomes to get the deal done but I highly doubt we have much if any NINJA loans happening in Toronto. I recall seeing stories where people were hired to forge mortgage papers on a full time basis in some states.
Chris
at 3:30 pm
Where did I say anything about the United States?
The Bloomberg article is clearly about Canada, our 3.4 million subprime borrowers (as defined by credit reporting agency Transunion), and the impact that rising interest rates will have on these people.
Housing bear was discussing this topic a couple days ago, and the impact it will have on both the housing market, as well as our overall economy as a whole.
Condodweller
at 4:05 pm
You didn’t it’s just when anyone uses the sub-prime demographic as a trigger for a possible crash most people will automatically think of the 2007 US crash as it was caused by the sub-prime defaults. I am not familiar with Transunion’s lending requirements but I know there are many self-employed/business people with irregular income and assets who have gone to B lenders and perhaps sub-prime lenders because they know they can service the debt but banks are too cautious to lend to them.
The fact the article talks about people budgeting down to $10 dollars is a concern. I would need more in-depth information to draw conclusions on it. I doubt there are millions of sub-prime homeowners within one rate hike away from defaulting.
I agree with Housing Bear that increasing interest rates will be the impetus for declining housing prices but I think he is a bit over pessimistic on the timing and the magnitude. Time will tell.
Chris
at 4:22 pm
Subprime just means people with less-than-prime credit ratings. It’s not meant to draw connections to the US crash, it’s a classification of borrower.
Transunion isn’t a lender, they’re a credit reporting agency, like Equifax. They compile data on people, like you and I, based on how we pay our debts, etc., and then assign us a credit score.
So what the article is saying is that there are 3.4 million people with less-than-prime credit scores in Canada, who could be squeezed as interest rates rise.
Not all of them are homeowners, and the article doesn’t touch on any real estate aspect to the story. It simply explores how rates will impact those with variable rate loans.
Condodweller
at 4:58 pm
@Chris My fault, I quickly scanned through the article and transposed transunion with progressa. Now it makes more sense. I see they don’t do mortgages at all and they differentiate themselves from a payday loan company by “We provide larger loans, for longer periods, at lower interest rates. ” Yay! For these people it makes total sense that they budget down to $10.
Ok, so most homeowners access credit through their HELOC and credit cards which shouldn’t be considered sub-prime. So this article is not really relevant unless people max out their HELOC/visa and are forced to go to a payday loan to try to keep up.
Chris
at 5:59 pm
HELOCs and credit cards aren’t sub-prime; the people taking out HELOCs and credit cards could be sub-prime borrowers.
Proegressa is discussing their clientele, which may or may not be homeowners. They don’t get into that.
But Transunion’s assessment is on all credit-active Canadians. Surely, some of the 3.4M sub-prime borrowers are homeowners. There’s insufficient information in the article to make that assessment though.
The reason this article is relevant is because it ties in to the discussion Kyle and Housing bear were having the other day, about what rising interest rates will do to people’s cash flows.
Condodweller
at 7:59 pm
I have seen subprime being used to describe both people and products and in this article it’s the people. My point was that people with good credit, frequently homeowners, are not likely to be customers of payday type loan companies just as clients of Progressa are not likely to be homeowners, especially since they don’t provide mortgages. They are half a rung above payday loan establishments.
Sure, some sub-prime borrowers transunion is referring to may be homeowners but I suspect it is a very small percentage. They would have to be the ones who purchased their home recently and don’t have equity for a HELOC but again if you are sub-prime why would you buy a home. Or a better question is how are you buying a home.
I did read the thread the other day you are referencing and I agree that higher interest rates are the likely cause for a continued decline in house prices but I maintain that it’s going to be due to higher mortgage payments not because of too much payday loans. Bad things happen when unanticipated events occur such as a higher than anticipated interest down the line.
Housing bear
at 8:56 pm
An interesting paper from last year calls into question whether or not it actually was the sub prime borrows (not loans) that brought down the market. Their reasearch shows that pre peak subprime borrowers represented 70% of foreclosures (although record low dafault rates at this time) after the bubble peak the default spike was almost exclusively from higher credit score borrowers who held multiple properties (speculators)
https://www.google.ca/amp/s/qz.com/1064061/house-flippers-triggered-the-us-housing-market-crash-not-poor-subprime-borrowers-a-new-study-shows/amp/
Arizona had one of the highest concentrations of investors and was around 45% of the total mortgages in 2007.
https://www.google.ca/amp/s/www.theglobeandmail.com/amp/report-on-business/top-business-stories/how-speculators-fed-us-housing-bubble-fuelled-bust/article4197115/
Condodweller
at 1:53 am
That is an interesting theory HB. Did you pay the $5 for the entire report? It sounds logical that prime investors had higher value at risk at the top. I suspect it’s all in the timing but at the end of the day, based on what I read as I have no first hand info, it was spiking interest rates that caused the crash. One common theme among the various bubles in the past seems to be greedy investors overextending near the top.
Housing Bear
at 7:00 pm
Waiting for the price of the report to correct to $2.78. Overvalued right now
Joel
at 8:43 pm
I don’t buy this. I am a mortgage broker and over 50% of clients that are sub prime are self employed that don’t declare their taxes. These people can easily handle the shitlft in rates. Also probably about 2% of subprime loans are done variable. They are all 1-2 year terms and fixed.
It is very rare that anyone who is not financially solid takes a variable rate mortgage.
Kyle
at 9:27 am
https://www.zolo.ca/toronto-real-estate/trends gives a really detailed daily look at Toronto real estate stats.
As of May 9th the 416 avg price is 904K, which is only down 2.8% vs where we were last year. The breakdown by housing types is as follows:
Detached: $1.4M, – 12% vs last year
Towns + semis: $917K, + 4% vs last year
Condos: $611K, + 7% vs last year
Chris
at 9:39 am
Zolo is great for their timeliness, but be cautious when using their most up-to-date data, which is pro-rated.
“What does pro-rated data mean?
Based on historical reporting, it can take up to four weeks or more for transactions to be reported. This means that approximately 30% of home transactions that occurred within this period have yet to be included in this report. Because of this, this period’s numbers are considered “pro-rated.” “
Ralph Cramdown
at 10:31 am
Nice work. If experiences elsewhere are precedent, AND if things get worse here, the core would typically be the last to decline, would decline less compared to “drive until you qualify” land, and be the first to recover.
Here’s another way of looking at things. YTD GTA sales counts only (not dollar volumes) by price range, compared to 2017 and 2016:
Price Range 2018 YTD vs. 2017 vs. 2016
$0-to-$99999 7 -58.8% -78.8%
$100000-to-$199999 66 -60.0% -86.4%
$200000-to-$299999 351 -63.5% -88.3%
$300000-to-$399999 2045 -39.0% -56.9%
$400000-to-$499999 3519 -12.0% -32.5%
$500000-to-$599999 3627 -7.5% -24.6%
$600000-to-$699999 3657 -17.9% -10.3%
$700000-to-$799999 2942 -24.7% -9.6%
$800000-to-$899999 2074 -39.2% -8.4%
$900000-to-$999999 1505 -41.3% 3.1%
$1000000-to-$1249999 1879 -47.2% -4.8%
$1250000-to-$1499999 1075 -55.3% -19.4%
$1500000-to-$1749999 527 -64.3% -26.8%
$1750000-to-$1999999 279 -66.4% -31.8%
$2000000+ 600 -66.7% -29.5%
All 24153 -34.4% -30.2%
Where have all the millionaire buyers gone?
Not Harold
at 11:34 am
That looks exactly like the intended and expected effect of changes in mortgage qualification – massive drop in 1-1.5 range, cooling in under 1MM but up compared to 2016. Affirming everyone’s belief that first four months of 2017 were on crack!
Housing Bear
at 10:31 am
And thanks for todays post David. Must have taken a lot of time to put this together and I enjoyed the break down.
Carl
at 10:33 am
Nice thorough work, thank you. Even so, these are still only averages. Averages are distorted in many ways. They don’t let us compare the sales of the same properties.
To get a better answer to the “… client … who asks me, ‘Is my home really worth 12.4% less than it was last year?’ “, we would need to look at those homes that sold in 2017 and then again in 2018 (or 2016 and 2018 for another comparison).
w01
at 11:12 am
How about w01,w02,w07 breakdown please?
Kyle
at 11:16 am
Hear, hear!
Chris
at 11:40 am
http://www.trebhome.com/market_news/market_watch/2017/mw1704.pdf
http://www.trebhome.com/market_news/market_watch/2018/mw1804.pdf
Page 4 onward breaks down the regions of the City, first with all home types, then broken down by home type.
You can compare average/median prices, sales volumes, listing numbers, etc., from April 2017 to April 2018 for any of the areas or segments that are of interest to you.
Ben
at 12:27 pm
TREB stats are useful and provide a breakdown by property type. However, I feel you need more granularity to assess a particular market because the mix of quality within each property type impacts the average. For instance, if you look at detached houses in W07, there are older bungalows (still the majority) going for $1.0-$1.2m and newer homes going for $2.0-$2.5m. The mix impacts the monthly avg. quickly in that area.
A
at 1:09 pm
W07 is where my buddy lives. I constantly try to convince him to sell his new home for move to a “C” pocket like C12/13. The W07 bungalows are moving if they are on quieter streets. There are some nice bungalows on 50” lots.
Not Harold
at 2:12 pm
Seen a few overdone bungalows in W01 on The Mash asking $1.6!!! Utter craziness.
Can easily see paying 1-1.2 for a bungalow in W01 on a quiet street a reasonable walk to Islington or Royal York subway and bulldoze it – aim for 2 to 2.5 for new 2 or 3 story, or put in 2 semis selling for 1.8.
Chris
at 1:16 pm
For that much granularity, I would say talk to a real estate agent, or look at comparable homes that have sold recently on Mongohouse, Housesigma, etc.
Depending on how deep you dive though, may be a pretty small sample size.
Kyle
at 1:19 pm
Thanks Chris
All Home Types in W01, W02 & W07 Apr 2017 vs Apr 2018, ends up being flat vs 2017:
2017 Sales: 187
2017 Price $1,034,208
2018 Sales: 185
2018 Price: $1,056,458
% Chg Sales: -1.1%
%Chg Price: +2.2%
Mainly due to W01 outperforming. W01 stats for All Home Types Apr 2017 vs Apr 2018:
2017 Sales: 61
2017 Price $839,302
2018 Sales: 67
2018 Price: $1,087,237
% Chg Sales: +10%
%Chg Price: +30%
Chris
at 1:30 pm
And here David thought 234 was a small sample size!
Natrx
at 1:17 pm
Definitely right. In this cycle, the disparity is more notable. This is due to the generally fundamental different demographics throughout the GTA. ‘Toronto’ is still inundated with working professionals with salaried type jobs located downtown which is still HOT! The job market is on FIRE. More higher paid immigrants/Visa workers and limited space. Even the fundamentals/price disparity between Scarborough and East York has widened
Other GTA places have less salaried type people which the new rules makes it more punitive to get a mortgage (i.e. business owners/self employed). More choices/spaces too outside of Toronto. So if you’re the average salaried employee looking for anywhere west of VP, south of Eglinton, to Jane Street, you will be in for a surprise. Those in Scarborough/Durham are more impacted since you have less salaried type people looking, but it is an opportunity for those that are desperate but squeezed out in ‘old’ Toronto.
Of course, the thought of a further commute (time lost) plus higher transportation costs = desire to stay within close proximity to subway/Streetcar/Uber from downtown.
Condodweller
at 1:38 pm
“1) The decline in GTA average home price, being applied to the “City of Toronto,” is extremely inaccurate.”
Thank you, David, for taking the time to present all these numbers and breaking them down for us. However, I am a bit confused with your first conclusion. Are you saying that the TREB numbers are incorrect? Becuase the GTA average home price is down, the City of Toronto average home price is down, and as you pointed out the City of Toronto is part of the GTA. I think most people get what average means and the actual price in the core may be a bit higher but it is declining.
You know how they say there are three types of lies; lies, damned lies, and statistics?
Not Harold
at 1:58 pm
David did great work.
I see his point being that the all GTA averages hide such substantial variance so as to be useless: price decrease IN Toronto is dramatically smaller than in 905, and region to region in 905 is highly variable. York is VERY bad, 416 is small pull back, and much of old North York is pretty bad while old Toronto is basically flat.
Condodweller
at 3:44 pm
@Not Harold I understood what his point was. I am simply saying it’s a bit misguided and misleading. Average is average. For everything that’s 20% above average, there has to be one that’s 20% below average. Newmarket is 6% above average and the core is 8% below average. The average does apply to all parts of the included area. Anyone who signed an offer on a million+ home hopefully knows what an average is and shouldn’t have trouble calling his agent to find out how much above/below the average his/her house is if he/she can’t find it online.
BTW the difference in dollar terms isn’t that dramatic at all. 20% of a house in Newmarket isn’t that much more than 6% of a 2 million house in the core.
Not Harold
at 5:28 pm
Condo – you’re taking as given that ALL GTA is a useful stat. David’s contention (and mine) is that with the extreme variance between different housing types, locations, and buyer profiles that such a broad measure isn’t a useful metric of the health of the market.
Provincial or National stats can occasionally tell us something but are exceptionally unlikely to. Calgary, Vancouver, Windsor, and Sydney NS all moving in the same direction is unlikely.
When the entire GTA was moving up, quickly and close to uniformly, that was useful, and concerning. If the entire GTA were moving down uniformly, that would be useful and concerning. With our current highly variable picture the headline is misleading (see my conversation with shanker).
Condodweller
at 7:30 pm
I wouldn’t put words into David’s mouth because I don’t think your interpretation is what he meant. He has broken out the date by individual housing types and everything except condos are down. He is, as I read it, saying that the average number is not representative of the core. I have already addressed that. If what you are saying is that there are different areas with disproportionate numbers of various housing types which skew the numbers and you would rather exclude some of the data then you are starting to manipulate the statistics to fit your narrative. David is using correct data but changing the narrative.
The entire GTA is in the same geographical location in the same economy. By using the average you are smoothing out the anomalies. It’s not like we are including Calgary in the average. If the 905 economy was 90% dependent on oil prices and the market price has crashed then you would have an argument that the core is different and it will continue to go up. One of the advantages of living in the GTA is the diversity of industries which helps employment stay balanced in case one has a problem.
Not Harold
at 8:18 pm
Condo –
As I mentioned with Shanker, the issue is that core old Toronto has different demographics and demand drivers than old North York north of 401 and than York Region. North of 401 and York region have many more of the buyers specifically targeted by policy changes against foreign buyers and supposedly overlevered buyers.
Core old Toronto has lots of condos (which are doing well) and prime to super prime houses with prime to super prime commutes.
So what’s interesting is to see if the market behaviour represents a slowing economy and changing market that is liable to look like Vegas 07/Toronto 87 or if the behaviour is reacting to changes in policy against marginal buyers and overseas investors.
If all of GTA is moving similarly, we have a macro story and look out below. If we have very steep declines in marginal areas and places that are especially attractive to overseas investors (i.e. Markham, Richmond Hill, north of 401) but flat to nearly flat in prime areas then the story is more the impact of those policy changes.
Highschool math teaches you mean, median, mode, which are important and useful distinctions. But the shape of the data tells even more of the story. What’s the variance and standard deviation? What type of distribution is it? What does the shape of the data look like? Let’s explore the data in more than 2 dimensions…
Going finer grained can be an indication of someone attempting to mislead. But so can cherry picking broad details.
I don’t have an agenda, neither bull nor bear. I’m actually net short housing and have been skittish for a long time. I’m specifically interested in what the market is actually doing, what that says about the effect of policy changes, what it says about our local and national economy.
I believe that the high level of variance according to location, demographics, and housing type tells a story that is more about the effect of policy changes than an impending economic melt down. It is my thesis that if both York region and core Toronto were down 12% +- 2% this would be a bad sign for the national economy and the health of the banks and insurance companies. It is further my thesis that the core detached being flat, north of 401 detached down 21%, and York region (all types) down 20% shows that measures against over reach and foreign buyers have hit VERY hard but don’t seem to have effected prime local demand.
These policy changes could have knock-on effects over the next 12 months, we could hit a major recession, there could be an asteroid. Lots of ways Toronto real estate could go very, very bad, with every region and every type being down 30% or more. It doesn’t seem that this is what’s happening and that taking this very broad GTA average as indicative is highly misleading whether you are a policy maker, a buyer, an investor in Canadian financials, or a professional with internationally portable skills.
So in an exceptionally long winded way, that is why I believe the fine-grained details matter more than a broad GTA average.
Condodweller
at 3:05 am
You have clarified your reasoning for going fine-grained which is a good academic exercise and I am sure there is a good PHD thesis work to be had there if you can explain the finer movements in various areas. If you can prove the reason for the price discrepancies for the various locales and predict future movements the more power to you.
I don’t believe there are meaningful differences in the various subgroups which cannot be linked to obvious reasons for the price differences. The main theme seems to be affordability whether caused by b20 or other factors is academic. The north end of York region like Newmarket has the largest decline because it was the end of the wave of drive until you can afford buyers and it is the first to pull back once the trend started to reverse. The 21% decline of SFH north of the 401 you cherry picked can be explalined by b20 as prices were over 2 million there. I can’t think of any factor in a specific area that might warrant a significant divergence in price for that area. I don’t consider less than 10% a significant divergence. There are wealthy households all over the city including outside the 416 therefore I don’t believe that it’s the wealth effect that’s keeping the core alive. People simply want to stay central therefore there is higher demand there if people can afford it. It’s where the rise started and most likely it will be where it ends. I don’t think it’s because it’s demographically unique.
I think our great city is diverse enough that the GTA average is a good enough market indicator at a high level and after that you can drill down into pockets to explain where those pockets are compared to the average.
Now if you want to pove to me that there is something unique about say E02 and therefore it will diverge from the average and it will shoot up 30% while the rest of the city continues to decline then you have something. But I think that’s highly unlikely.
Professional Shanker
at 2:38 pm
I find it almost comedic to focus on the central core when trying to draw any type of market psychology perspective. What % of home sales compared to the overall GTA market does this area represent and what % of overall GTA population are you focusing on?
The reason I ask is because the health of the real estate market in our metropolis is heavily dependent on the call them relatively speaking cheaper detached homes in the non central core areas. Why is that, because the top 5% of wealth & income individuals are typically buying in the central core and this subset of the population will not be the driving force in influencing the health of the RE market in Toronto. It is the average people who determine the larger price direction of the market. Therefore, it is non-core areas which people should be paying more attention to, during the upswing from 2015 to 2017 and currently during year 1 of the great deleveraging cycle potentially.
That said the reason David focuses so heavily on the core part of the market is because that is his target market, which to your credit will be less prone to massive economic swings.
Not Harold
at 3:25 pm
Shanker it’s because Toronto is different from North Oakville which is different from Caledon which is different from Georgetown which is different from New Tecumseth, all of which are GTA in TREB stats. And old Toronto is different from old North York which is VERY different from Scarborough.
Health of demand in the core is tied to health of the main industries (finance, law, accounting, advertising…) which are tied to the National and Global economy that drive overall health of the region. The non-core areas were explicitly and repeatedly targeted by government policy action recently. We’re trying to see how that policy works out and to see what the overall behaviour of the market is.
Did the policy create a recession? Are we seeing signs of a recession caused by other things? Are we seeing large declines in all parts of the market? Are we seeing responses that match up to demographics of different areas (more reaching buyers, more foreign buyers, etc)?
If Honda or GM close while Deloitte continues to do well you’ll see one outcome in real estate. Recently lots of mining investment bankers and executives were very stressed but this year they should be doing better leading to changes in supply and demand in different areas than those affected by GM.
Professional Shanker
at 4:42 pm
I can see your perspective, that if the speculative areas (York) are hit hard but the core keeps on chugging, then the policy actions have accurately been implemented in line with their intention.
I just worry that we are bushing off 30% price declines in areas which could be a red herring/have consequences to the overall market, but to your point, then we will/would see this come through in other areas.
That said the central core areas are for the wealthy, so my rationale is that any decreases in these areas would be a lagging indicator not necessarily a leading indicator, no?
Not Harold
at 5:15 pm
No, the core areas plus south Oakville and Sauga and other similar spots, are leading indicators. You’re talking about people with visibility into where the local, national, and global economy is headed. Their ability and willingness to spend fluctuates very closely with the health of their industries – can I pay for this place in cash/am I confident that the next 2-4 years of commissions/bonuses will cover it..
The leading indicators are the velocity and volume of transactions – buyers disappear, properties don’t come to market barring divorce, death, or sustained unemployment. A substantial drop in prices would definitely be lagging (when Galen Weston or the CEO of RBC HAVE to sell down 40% everyone else has been nuked) but there are other signals. Also looking at gentrifying areas like Leslieville 3bd. Very much a leading indicator of core economy health.
Kyle
at 3:44 pm
“What % of home sales compared to the overall GTA market does this area represent”
31%
https://pbs.twimg.com/media/Dcv3C7yWsAA-DHf.png
Kyle
at 4:00 pm
38% using David’s 2018 YTD sales figures.
Chris
at 3:47 pm
City of Toronto Population: 2,731,571
GTA Population: 6,417,516
So the City of Toronto comprises 42.56% of the GTA’s total population.
Professional Shanker
at 4:25 pm
I was more questioning/speaking to the “central core” which is referenced numerous times by David and it’s ability to withstand price decreases so far. What % of sales and what % of the pop’n is he focusing on when saying this market is hot throughout Spring 2018. From the 2018 YTD sales referenced here, total Toronto sales are 38%, the strong central core is what….15%?
Chris
at 6:01 pm
If one were so inclined, you could look at sales volumes of the central Toronto regions, and compare it to the sales volumes of the rest of the GTA? Off the cuff, I would guess that your estimate is fairly close. But I haven’t crunched the numbers to check.
Appraiser
at 4:19 pm
“Looking at Home Price Index (HPI) which takes out effects of mix, each of the 4 benchmark housing types are steadily improving every month. Two of the 4 are positive y/y and condo apts are > 2017 peak. (SF = single family)”
Scott Ingram, May 9, 2018. https://twitter.com/areacode416?lang=en
Mirrors exactly what I see in my business every day. Prices stopped going down a while ago (apples to apples) and are steadily rising again.
Tommy
at 4:25 pm
We’re seeing the usual seasonal price patterns (e.g. Prices increasing from January thru spring) but I don’t no know that we can make any meaningful extrapolation from this. How long will it last in the face of growing inventory? Will prices be higher next year or lower? When record condos are completed in 2022, rents won’t be able to cover the carrying costs for most investor units. How long before condo prices see the same correction that the detached market did? Will we see average one bedroom condos selling for $800k without any pullback?
Kyle
at 5:08 pm
The gap between inventory and sales has been shrinking since last summmer, ou can see the graph on zolo
Tommy
at 7:24 pm
For condos, only.
Kyle
at 7:34 pm
No, for all properties
Tommy
at 8:39 pm
Which graph specifically shows this? The Toronto market graphs at https://www.zolo.ca/toronto-real-estate/trends are inclusive of all home types. I see no breakdown for each housing type.
Kyle
at 10:40 pm
The one labelled Number of Sales and Inventory is for all types – NOT condos only as you incorrently claim . The vertical distance between the grey line and blue line has been shrinking. Which again directly contradicts your claim that inventory is growing.
Tommy
at 10:06 am
It doesn’t appear to be shrinking at all, but if there is any shrinking in inventory in the “Number of Sales and Inventory is for ALL types” it’s because inventory is shrinking ONLY because of condos.
Kyle
at 2:09 pm
Pure nonsense
Chris
at 4:29 pm
GTA HPI YoY
Detached -10.34%
Attached -8.82%
Townhouse -2.62%
Condo 10.17%
City of Toronto HPI YoY
Detached -9.55%
Attached -4.53%
Townhouse 3.67%
Condo 12.35%
Tommy
at 4:19 pm
Looking at subsets of the market is akin to misdirection. It’s great to compare stats of the GTA versus Toronto proper and notice that declines are smaller in the core, which is expected, but looking at E01 versus C01 or semis with 3 bedrooms versus bungalows with 4 bedrooms gets into a level of minutiae that has little predictive value.
The market is correcting, in some areas more than others, but the trajectory is down. Condos are up but sales are stalling. The gravity of regression to the mean is not easily overcome for long. The market went off on a wild tangent beginning in 2015, and its coming back down to earth, which is good and healthy.
Appraiser
at 4:54 pm
Some data, instead of slogans (“reversion to the mean”) would be helpful in bolstering your position.
Tommy
at 7:26 pm
It’s the straight red line you’ll find on https://s-i.huffpost.com/gen/5026956/original.jpg
Condodweller
at 12:53 am
@Tommy This is a great chart that I have been looking at whenever I have said to look at inflation-adjusted historic prices in my various comments in the past. I think analyzing this chart would make for a great entire post for David. I was looking for a chart that went back further but 1953 is probably good enough as it captures 3 complete cycles. IMHO this chart should scare the heck out of anyone currently considering buying who is not prepared to keep it for at least 10 years. Note: the current price is actually off the chart!
Tommy
at 12:53 pm
In related news it actually took 47 days to sell a house last month, not 20 days.
https://twitter.com/JohnPasalis/status/994543126285975552
Still in strong seller territory (thanks in large part to competition for condos – the most affordable housing option), but more double the time TREB is reporting.
Tommy
at 7:28 pm
And yes, if you prefer to reference other crashes rather than 1989, be my guest. The point is that RE is cyclical. Always will be. If you think there is some escape this time around, you’re ignoring rudimentary economics.
Appraiser
at 9:09 pm
You said the trajectory was down. Then provided a graph illustrating that the trajectory was up. Then decided to lecture upon rudimentary economics. Got it.
Tommy
at 10:03 am
The chart ends at 2016. It’s now 2018 – the trajectory has changed.
Tommy
at 10:22 am
Appraiser, is this you? https://forums.redflagdeals.com/rental-income-property-good-investment-gta-2192066/
Appraiser
at 10:28 am
Looks like another Ben Rabidoux fanboy. My investment properties have been cash flow positive for many years, thanks to basement dwellers like you – and you don’t want to know about the capital appreciation over the past decade, it will make you cry.
Professional Shanker
at 11:25 am
So from what I presume, you are a landlord investor with multiple properties. Do you review your capitalization rates on a regular basis and at what point would it make sense to move from this asset class to something with a higher after tax investment return? Reason I ask is because you are stating you are cash flow positive for years which makes sense if your investment properties were purchased call it pre-2014. At what point does a capitalization rate become so low that an investor will crystallize their appreciation gains given that their current market value of capital is not yielding an attractive yield?
Also, how do you forecast future rental rates into your properties which of course would alter your forward
Tommy
at 12:40 pm
I’m a real estate investor and I’d be happy to compare net worth with you any day. I suspect I’m much younger than you, too. None of these things blind me from a market that is in serious trouble.
Appraiser
at 1:02 pm
@Tommy re: related news – Pasalis later updated the days on market chart to indicate that 67% of solds were only listed once. So it’s a minority of properties that are driving the “real days on market” – but I see you ignored that one. Also days on market are negatively affected by holding off offers on properties that would have sold sooner.
lui
at 11:36 am
Still surprise some sellers are just leaving their listing to rot and not adjusting their selling price.Either bad agent advice, pure ignorance or wishful dreaming better times ahead.One of my co workers at work bought a townhouse in Oakville in 2016 and just recently a exact model a few houses away sold for $80,000 cheaper than what she paid for hers.She’s not one happy camper.
Appraiser
at 12:38 pm
@Professional Shanker, Perhaps you could finish off the ‘wannabesophisticated-soundinginvestor’ diatribe that appeared to trail off aimlessly at the end.
What happened, did your mom tell you to get off the computer?
Tommy
at 12:48 pm
1) What impact, if any, do you think the new AirBnB rules will have that come into effect on June 1st?
2) What impact, if any, do you think investor purchases of cash flow negative pre-construction condos in 2016 to present day will have on the condo market when the units come to completion in 2020 – 2022? Consider that half of pre-con condos purchased in 2015 with occupancy in 2017 are cash flow negative (sometimes to the tune of several thousand dollars and with interest rates of 9%)
3) Do you think growing detached inventory is going to subside in the near future? Why?
4) What impact, if any, will increasing interest rates have on housing prices?
5) What do you make of the news that a significant amount of mortgage holders say that an increase of $200/month in expenses would make them insolvent?
6) Do you believe RE is cyclical and if so, do you simply think that a correction is much farther off than the bears? Or do you think Toronto real estate will just keep going up in your life time?
Professional Shanker
at 1:28 pm
Not trying to be anything….I am just asking a couple questions, I am not an RE investor but you are so I am interested in your perspective, not a insult.
Put in a simpler manner – I just don’t see the forward yield from an investor perspective at these prices – help me understand what I am missing? Expectation of increases in rental rates, future prices, etc.?
Why can’t I get 3% in a medium risk corporate bond as opposed to being a landlord?
If it’s a 5%+ yield at current market prices then I understand the added risk, but the math does not support 5%……
The floor is yours….
Appraiser
at 6:20 pm
@ Shanker: If indeed you are not being facetious or disingenuous, my apologies.
Every investor is different, so I can only speak for myself. I see real estate investing as a get rich slowly proposition. Most if not all get rich quick schemes are scams.
There are few assets you can buy with leverage, whereby you can have someone else (a tenant) help to pay off that asset for you over time. Whether or not an investment property is cash-flow positive from the outset is not the end all and be all for me. I’m in it for the long haul. If the property goes up in value over time, that’s a nice bonus.
My goal is to have fully paid for, cash-producing assets to supplement my retirement. I’ve also made sure to accelerate the payments on all my mortgages to get there as soon as possible. And I’m almost there.
Cap rates, ROI, etc. are so much theoretical financial jargon to me. I try to keep it simple and stick with the program. I also find that most people who throw these terms around may look smart, but have empty pockets.
My advice is to devise a financial plan you can believe in and develop the willpower to see it through.
Housing Bear
at 7:06 pm
LOL
Appraiser
at 7:32 pm
Happy renting there Bear. Good luck timing the market.
Long Time Realtor
at 7:46 pm
Hey there Housing Bear, do you even have a plan? LOL LOL
That Guy
at 8:02 pm
Ha! Ha! Not only does @Housing Bear not have a plan, he doesn’t have a clue. Well said and well done @Appraiser, good for you.
Housing bear
at 9:27 pm
Clearly you can’t do basic math. Very simple calculations that allow you to evaluate one investment vs another. Real estate isn’t the only game in town. And if any of you three wiz kids can read you will have full insight into my plan.
That being said, it does look like appraiser got in early enough to be alright. Assuming he hasn’t been HELOCing it up to finance more properties
And I should stop to thank all three of you, where else would people like me get our liquidity from. Hold onto that bag tightly boys
Housing bear
at 9:46 pm
And renting hasn’t been so bad. Thinking about trying to find one of those commie landlords who’s happy to subsidize my life style month over month. If you rent a 2017 model there is a 21% chance! I’d take those odds anyday over betting against the credit cycle
Housing bear
at 9:52 pm
*48% chance
33% chance it’s more than a 1000 a month!
Wonder what the subsidizing will be on a 2016-2017 pre sale. Stupid socialists
Chris
at 9:53 pm
Return on Investment is “theoretical financial jargon” in your books?
Oooh boy…
Appraiser
at 10:41 pm
It’s all jargon to you basement dweller. It’s all you know. Now get out your pen and sign that rent check, or you’ll be out on you butt – again. Unless of course it’s your mom’s basement.
Clean up your room moron.
Chris
at 11:03 pm
Ooh you got me good, appraiser! I have been left reeling from those wicked burns!
Maybe try spending less time writing childish insults on the internet and more time learning about basic concepts like Return on Investment?
Tommy
at 10:41 pm
I think that since landlords are now under rent control, it is important to be cash flow positive from the start but I get your overall point.
Condodweller
at 12:57 pm
@Tommy Actually it’s not as important to be cashflow positive as you think. If you are someone who saves $1000 each month it’s not a problem to be $500 cashflow negative monthly. Instead of investing the entire $1000 you would just use $500 towards your mortgage/costs etc.
Professional Shanker
at 4:49 pm
Appraiser – No I am not a dick – I ask questions sincerely.
The leverage side of the RE yield equation is from what I believe the great equalizer which skyrockets the ROI. Plus, I really like the inflation hedge RE provides.
I think that is where the disconnect lies potentially amongst you and some of your combatants so to speak! You are a long term RE guy – the market rallies and gullies are noise to you as you would never sell at any price, so cap rates at specific points in RE cycles are irrelevant to you.
My assessment of investments and the financial jargon you speak off, I live and breath everyday, so it is difficult to turn it off when looking at anything including RE investing.
You state that you fast forward principal repayments on your properties, may I ask are you actively looking at expanding your portfolio in the current market, potentially by re financing some of your current properties?
Appraiser
at 8:32 am
Yes, bought a new condo apartment for the first time last year in a smallish low-rise multi-building complex that is way under valued in my opinion. All other investment properties are or were freehold. Yes, we have taken money off the table over the years, some of which we used to pay off our prinicple residence. We have been mortgage free for many years.
I’m old fashioned and always put at least 20% down of my own cash, even before it was required. We will finance the rest. I will NOT pay CMHC fees – which are a total rip-off. I could never understand why buyers pay the insurance premium but the lender is the beneficiary.
The deal doesn’t close till December and the builder is already selling the same unit for $40,000 more than I paid. Units on the re-sale market that are already finished in other buildings in the complex (there are 8 buildings in total, 6 are finished and occupied) are selling for more than $80,000 more than I paid. Go figure.
So on paper I’m way up but I don’t intend to sell. The plan is to rent it out for the next 10 years or so and then move in to the unit when my wife and I are approaching our dotage. It’s a nice little”adult life-style” community with a 9-hole golf course, community centre etc.
Again, not a short term strategy.
Kyle
at 10:44 am
@ Shanker
If you’re looking only at the initial starting point or in the very short term then yes the bond might be a better investment. But people don’t buy investment properties as a short term investment. Over the medium to long term, a well chosen well managed investment property is going to way outperform that bond. Show me a corporate bond where the coupon rises each year. Show me a corporate bond that over the long run has had capital appreciation like an equity except with lower volatility? Show me a corporate bond, which suddenly gives you a permanent boost to the coupon, the way owning an investment property does when the mortgage is paid off.
I know many who have slowly become very wealthy over time by owning investment properties, i actually don’t know anyone who got wealthy by buying and holding bonds.
Professional Shanker
at 4:03 pm
Completely agree with you on the long term view, I would never dispute that. I just get caught up currently with the go forward value proposition at today’s market values over the short to medium term in the GTA, I believe there are likely other more attractive investment asset classes, perhaps I am wrong, only time will tell. That said the build wealth slowly plan of investment properties utilizing leverage is what Appraiser speaks to which I appreciate – it amplifies the ROI and has made RE investing very lucrative over the past 10+ years. If you are in it for the long term than I guess there is no market price which someone would sell at, you just keep purchasing the next unit through good and bad times.
If I asked you about purchasing an investment property now in the GTA – the initial starting point you speak of – what are your thoughts compared to other investments – a simple one being a run of the mill world market ETF – which do you think would have a better pay off 5 years out – leverage included for the sake of RE.
Kyle
at 5:48 pm
TBH, I would not consider an investment property if my time horizon were only 5 years. The longer you hold it, the better your returns tend to be and the lower your risk. Sure people who bought 5 years ago (when average prices were only 522K) are doing well, but compare them to the people who bought 10 years ago (when average prices were only 379K). Both of those landlords, would have properties worth today’s average of 804K and both are receiving the same rents today. If we however had a downturn, the person who bought 10 years ago, woudl have a 143K buffer over the one who bought 5 years ago.
Jennifer
at 1:04 pm
I’m surprised agents are not more fussed about the municipal land transfer tax. At the price homes are selling at these days, it’s not an insignificant amount of money people have to fork over AT CLOSING. It surely makes people think twice about moving – there is a point where it makes more sense to stay put and put that $30,000 or $40,000 etc. into an addition or renovation. There is no doubt that listings/sales in Toronto are lower because of this too.
o
at 2:54 pm
Bingo.
steve
at 1:04 pm
excellent post …. thanks for crunching the numbers!
Batalha
at 2:50 pm
“there’s no point in selling the absolute truth when you can sell a better, sexier, wilder truth”
Every seller needs a buyer.
RealGeorge
at 2:53 pm
Am I the only one who thinks “Tom Robinson Band” whenever David refers to this site as TRB? Their second album was titled TRB2, after all, so they did refer to themselves this way.
RealEstateObsessed
at 4:32 pm
I follow real estate sales date very closely through Mongohouse and I live in E1 area in a semi-detached. Prices have not come down at all and at times appear that they have gone up?! Bungalows were selling for $700’s last year but now it’s upward of $800’s to close to $1M. Semi-detached close to Danforth or leslieville are upwards of over $1M (regardless of parking). All of the government initiatives to try to soften the housing market didn’t really do anything in 416 core. I’m still baffled at who these people are that can afford semi-detached or detached homes for $1.2-$1.4 M??? It appears to be all young families or young couples…so where are they getting their money so I can get some of that???
BJA
at 4:48 pm
I agree with REO. I live in an E03 detached west of Broadview, and I’m amazed at the (asking) prices for the dinky little bungs up around O’Connor. Who in the world can buy these places for $800K-plus?
Not Harold
at 5:18 pm
It only makes sense if you scrape the house. But it makes a lot of sense for every bungalow in that area to get scraped and turned into one or two 2+ storey houses.
Jennifer
at 1:42 pm
seriously!!!! prices haven’t budged in that area – it’s shocking what people are paying. Is it the low inventory? Where people are getting money from is beyond me. I wish we had insight into the amount of the mortgages being put on. We need lawyers to give some insight.
Appraiser
at 8:13 pm
“Here’s 416 freehold active listings for the past 23 years (as far back as I have monthly data through TREB). 28% below 23 year average.”
Scott Ingram, May 10, 2018, https://twitter.com/areacode416?lang=en
Hey there @Tommy – yeah that inventory is really piling up. And these are raw numbers, not taking in to account the increase in the housing stock over the past 23 years. LOL!
Tommy
at 1:28 am
They are indeed. In 2016 they were 1452, in 2017 they were 2034, and in 2018 they were 2327. Expect it to be back over 3000 in April of next year.
The trend, is not your friend.
Note that we’re in a market that is running purely on steam now… a crazy train produced by a 10+ year bull market whipped into a frenzy beginning in 2015 thanks to speculators devouring 50% of new condos. Although the breaks have been put on the market (via government intervention and prohibitive housing prices), it has so much momentum that it keeps screeching forward rather than stopping promptly.
This has always been the real estate market behavior – its prices are sticky because sellers want what their neighbors did the year before and hold out for it, stupid money (aka amateur investors) continue to buy to the bitter end (even though all the smart money bailed at the top in 2017 – check TorontoLife.com to see which major banking people sold their mansions last year), and real estate salespeople keep pumping and dumping new pre-con condo product on the FOMO amateurs with ever-mystifying promises of value gains upon completion.
But the smell of death creeps in year after year…. just as it did from 1990 thru 1996… it’s a long painful but necessary process. The amateurs have been dupe again just like they are in every generation. Same game, different players, same result.
Tommy
at 1:32 am
Also note that the share of housing has changed substantially in the past 23 years. Freehold went from dominant housing type, to smallest housing type. The graph only accounts for a subset of the real estate market. The lion’s share is now in condos and leasehold low rise. In other words, more people than ever before are competing for a smaller share of freehold (which the graph depicts) and despite this, inventory is trending up. That’s bad news.
Tommy
at 1:34 am
One other point… and this one’s going to hurt… the graph looks at Toronto proper… the market that is most resistant to downward pressure. You don’t want that agent to graph what’s going on in the 905 region collectively known as the GTA. Starting to get real ugly…
Tommy
at 1:47 am
Don’t worry, Appraiser. The average one bedroom condo with 700 sq feet will cost $1 million by 2022, easily. There are just so many people willing and able to spend that kind of money on a tiny shoe box in Toronto (never mind record mortgage debt, record consumer debt, record HELOC debt, record school debt, record high rental rates, half of new condo investors losing money monthly, record low cap rates, increasing interest rates, record high condo inventory completions to come over the next 4 years, NAFTA and noncompetitive tax policy that’s bleeding business from Canada to the south, low rise inventory increasing, sales volumes falling). Oh, and in the same time span, detached will average $2.5 million. Not a correction in sight as far as I can tell. Sounds legit.
Tommy
at 2:27 am
…stress test, eccentric arrangements in order to make ends meet (people co-buying with friends/family, people living with roommates, millenials living with mommy and daddy into their mid 30s), incomes lagging further behind housing price growth every year, alternative lenders (shadow lenders) with higher rates growing their market share, boomers renovating rather than selling due to costs/fees associated with upgrading or downgrading, China clamping down on capital leaks leading to reduction in foreign buyers, banks tightening up lending to insulate themselves, Airbnb rule changes to shake up rental markets.
The run-up in 2016 and 2017 was a completely normal event with no consequences, except for more positive price growth. The slow down in sales volumes won’t have any impact on agents, lawyers, construction workers, supplier industries. Greater debt won’t have any impact on discretionary spending and businesses will continue to flourish, even under minimum wage increases and less customers. Canada magically avoided the 2008 worldwide economic meltdown and is immune from them after 1990.
I could be wrong. Nobody can foresee the future. Maybe taxi driving immigrants, uber eats delivery millennials, and over-leveraged “investors” will save the day after all, and accomplish something never done before in the history of real estate.
Tommy
at 11:46 am
Another not-so-positive trend for you:
https://betterdwelling.com/see-ya-local-millennials-are-abandoning-toronto-and-vancouver/
Chris
at 12:59 pm
Uh oh, now you’ve gone and done it…didn’t anyone warn you that posting of BetterDwelling immediately invites verbal abuse?
Appraiser
at 9:19 am
Help me out here @Tommy. The article references intraprovincial migration and then links to the StatsCan website, but not to any specific charts or data regarding same. Where did the author’s information come from?
Tommy
at 2:17 pm
First graph on:
http://www.century21.ca/scott.ingram/blog/April_2018_charts_don_t_look_now_but_the_market_is_improving
“As I have noted the past couple of months, freehold sales are now at their lowest mark since 1996 (TREB monthly data only goes back that far). This month the number dropped below 12,000 for the first time, and I expect a month or two more of declines from a rolling 12 month perspective. The average across the this period has been 16,527, so the April number of 11,799 is 29% below average.”
Freehold sales volume are at their lowest in 23 years. How can they be so low when there are millions more people in the GTA than in 1996 and fewer freeholds (as a percentage of housing) than at any other time in Toronto’s history?
FDP
at 10:33 pm
Ontario is the financial hub of Canada, period.
Ontario will always be the place to make money and British Columbia will always be the place to enjoy it recreationally, period. We will be OK.
Appraiser
at 10:37 pm
And the Golden Horseshoe is the hub of Ontario.
And Toronto is the hub of the Golden Horseshoe.
Not Harold
at 5:15 pm
Montreal was the financial and corporate hub of Canada and had been for hundreds of years. Sun Life and RBC filled huge office buildings with their statement headquarters across the street from each other.
Things change: Sun Life just built the second iteration of their headquarters in Toronto while RBC and the BANK OF MONTREAL have been effectively run from Toronto for 4 decades.
So the drivers for Toronto can disappear in an instant, just as they did for Montreal. And even a strong secular driver for growth and price appreciation can get knocked back for a decade by a severe recession. Bay Adelaide was a stump for over a decade and 2 Queen was the first major building delivered in the core in over a decade when it opened in 03.
Toronto has strong drivers and I believe in the city long term but always keep in mind how and why things can change. Mindless optimism is even more dangerous than mindless pessimism.
FDP
at 7:33 pm
Fair enough, @Not Harold you’re entitled to your angle. MINDFULLY, I disagree.
Appraiser
at 9:06 am
And poorly constructed theories coupled with mindless fear-mongering may be the most dangerous of all.
The GTA and the greater golden horseshoe are the future economic growth engines for at least the next several decades. http://www.mah.gov.on.ca/AssetFactory.aspx?did=10852
Jordan
at 5:55 am
So was nyc. It still dropped in 2007\8. But everything comes back, it just took nyc 7 years
Geoff
at 12:27 pm
Well say what you want about @Housing Bear, he at least put his money where his mouth is – selling his house and renting because of the strength of his belief. #Respect!
Housing bear
at 7:37 pm
Thanks Geoff. Will have to eat my words now if I’m wrong but chose to bet the credit cycle and so far everything has been working out as expected
Bal
at 5:17 am
Housing bear plz call me
Geoff
at 11:49 am
well I don’t want to exactly wish you good luck, but it’s interesting. I think that David should do a whole blog on just you!
“Everybody has a plan until they get punched in the mouth” – mike tyson
“No plan survives contact with the enemy”
Housing Bear
at 5:58 pm
The big problem is, and why no one should be wishing me luck, is that if I’m right no one in Canada wins (I’m not trying to short), we all lose as taxpayers and as individuals with investments or who work here……………just some of us lose more.
Zarks
at 9:41 pm
Too many moving parts to accurately pin point how this will play out but I am worried. I say this as a custom home builder first and realtor second, the margins are becoming very thin and borderline gambling. I feel lucky to have been able to sell one of my builds recently after having been on the market for 12 months. I see plenty of inventory with that continue to sit even after major price adjustments. I don’t know how some people are carrying these investment properties, I doubt any are cash flow positive unless it was purchased 8+ years ago. None of mine were ever cash flow positive, I was just happy to have renters cover my interest payments until I decided to tear the property down.
Ellen Sydney
at 8:51 am
In my opinion the rise in real estate price in Ontario today just reflects the fall of Canadian dollar. It means the government of Ontario is losing battle for economy. Lets say the house market price today is $2,000,000. If you convert it in US dollars we will get about $1,350,000. Compare to 2014 , when the same house was worth $1,050,000, and $1 US dollar was $1.096. Now that’s $1.78. Do calculations. The increase in price of $300K shows bad economy. Our Government is trying to destroy the real estate market instead of doing something really helpful for economy and people. Like to build refineries in order to decrease gas price finally.
Appraiser
at 8:57 am
“Did you see Derek Holt from #ScotiabankEconomics ‘s chart on Ontario and B.C. wage growth? Near decade highs w/ wages up 5.9% y/y in B.C. and 4.3% y/y in Ontario. ”
Frances Donald, May 11, 2018. https://twitter.com/hashtag/ScotiabankEconomics?src=hash
Tommy
at 4:14 pm
LOL, wages are up! Yet they’re still a fraction compared to the cost of real estate or renting. Those are up double digits several years in a row!
Condo pre-sales are stalling in Vancouver and when the same happens in Toronto, it’ll be the straw that breaks the camel’s back.
https://biv.com/article/2018/05/realtors-developers-brace-crash
Condos are all that’s propping up the bizarre perception that this market is still invisible despite the “flat” prices of low rise since one year ago. A grand delusion held by amateur investors and end-buyers. Fundamentals don’t matter… the federal government’s war against further price growth doesn’t matter… bond prices which compel the BOC to increase interest rates doesn’t matter…. this line of thinking is going to be put to the test in short order.
Tommy
at 3:05 pm
“In his Monday morning Newsletter dated May 14, 2018, Vancouver realtor, Steve Saretsky has provided the following observations re: the current state of condo construction throughout the REBGV area:
Completions are at an annualized rate of 32,000 units which are the highest they have been since May, 1994.
There are currently 55,692 units under construction which is the highest rate since March, 2008.
He added, “Condo developers are having a challenging time offloading new product”.
In addition, he mentioned just last week that his inbox has been “flooded” with promotions by developers offering “decorating allowances” to potential buyers along with realtor bonuses in order to spur sales.”
….and so it begins….
Tommy
at 3:13 pm
Wow… does anyone know the backstory behind 300 Glenayr Road? It was sold 3 years ago, in 2015, for $2.8 million.
It was put back on the market in March of this year for $4.3 million, and eventually sold 3 days ago for…. $2.8 million
After all the huge gains from 2015-present how is it even possible for the house to sell for what it did 3 years ago?
https://housesigma.com/site/search/house/C4111890
https://torontolife.com/real-estate/house-week-2-8-million-forest-hill-tudor-modern-conveniences-secret-hatch/
Zarks
at 1:44 am
Mortgage renewal, desperate to sell & unreasonable initial asking price.
Jordan
at 5:57 am
True points about gta vs core, however volume still down tremendously in the core and volume drops beget price drops. But the economy’s too good and no one needs to sell. Hence this stalemate of small pric movements in the core.
Those looking for a big crash aren’t going to get it with the economy as strong as it is. Just doesn’t happen
Tommy
at 12:20 pm
The “economy is strong” argument is weak in light of the fact that the median income is $40k in Toronto, most new jobs are part-time service jobs, credit growth is finally declining, people struggle to pay rent, and many mortgage holders are up to their eyes in debt. Preceding every single market crash, peons heard that the economy was strong…. until it wasn’t. In other words big crashes happen when economies are strong, every single time.
jordan
at 3:00 pm
you are confusing cause and even. big crashes happen because a strong economy turns. Toronto is extremely exposed now should we enter a recession. you could get a 30-40% home price drop. Im just saying it aint happening until you have forced sellers and you dont have forced sellers with unemployment at 5%
lui
at 7:18 am
This is a soft correction for 2018.Sales are down across the board but 905 pricing has corrected from 2017 mega highs which should be expected.Toronto condos are still booming even with sales down.Rents are rising which attracts more investors which eventually will drive prices higher.
Tommy
at 2:56 am
There’s no such thing as a soft landing in real estate, unfortunately.